There has been some talk about rainfall records being set in Toronto this summer.
I thought I should address this for Waterloo.
Here are the top 5 July precipitation totals:
1988 - 223.2 mm
1987 - 195.4 mm
1951 - 191.8 mm
1991 - 182.6 mm
1950 - 180.6 mm
Right now we are in 6th place for the July rainfall.
As of 10 am on July 28th we have had 164 mm.
We might be getting a few showers before the end of the month, but it is hard to imagine that we will get the 17 mm to catch up to 1950.
Here are the top 6 June/July precipitation totals:
1947 - 309.4 mm
1927 - 296.7 mm
1967 - 286.3 mm
1987 - 285.6 mm
1953 - 279.4 mm
1951 - 276.6 mm
Here we are only in 7th place with 270.4 mm.
However, we could move up depending on just how much we get this week as we only need 6 mm more.
Monday, July 28, 2008
Tuesday, July 22, 2008
Another week, another record rainfall.
On July 22nd between 7:30-7:45 pm 23.0 mm of rain fell.
That is the highest 15 minute rainfall we have recorded in the 10 year history of the UW weather station.
The previous record was 16.2 mm on June 27, 1999.
We also set an hourly record with 34.4 mm coming down between 7:15-8:15 pm.
That just surpassed the 33.9 mm on May 2, 2000.
By the way, I don't know how far back these records go, as they don't keep 15 minute data at the Waterloo-Wellington airport and I don't have their hourly data.
Not a record, but also interesting is that the temperature dropped 6.2°C between 7:15-7:45 pm.
On a personal note I happened to be biking just as the storm hit (I really should have checked the radar before I left) so I ended up watching the record rainfall from the (partial) shelter of one of the RIM buildings.
Friday, July 18, 2008
A Warm Night
On the night between July 17th and the 18th the temperature only went down to 22.1°C making it the warmest night we have seen since August 1st, 2006.
That night (actually the night between July 31st and August 1st) in 2006 the temperature only went down to 25.3°C.
That night (actually the night between July 31st and August 1st) in 2006 the temperature only went down to 25.3°C.
Friday, July 11, 2008
Record Rainfall
On the morning of July 11th between 3 and 9 am we recorded 78.0 mm of precipitation at the University of Waterloo Weather Station. This is the highest one day total we have seen in the 10 year history of the weather station (beating the 59.2 mm on July 16th, 2005).
This is now the highest one day precipitation since July 7, 1991 when 82.0 mm was recorded at the Waterloo-Wellington Airport. The wettest day since 1970 was 89.8 mm on July 15, 1985.
The average monthly precipitation for July is only 92.9 mm and this morning we got more precipitation than we did in March, April, or May.
Looking at the GRCA gauges you can see that there was only a narrow path of really heavy precipitation with Laurel Creek getting 66.8 mm but Cambridge, Woolwich, and Conestogo only receiving around 27 mm. While Guelph only recorded 7.6 mm.
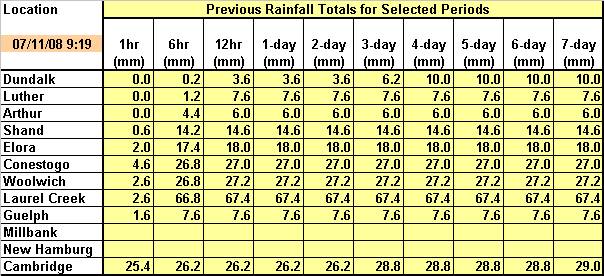
(if you can't read the numbers above, here is a clearer view)
As I biked by Silver Lake this morning the boardwalk was flooded and you could not see the weir structure at the end of the lake.
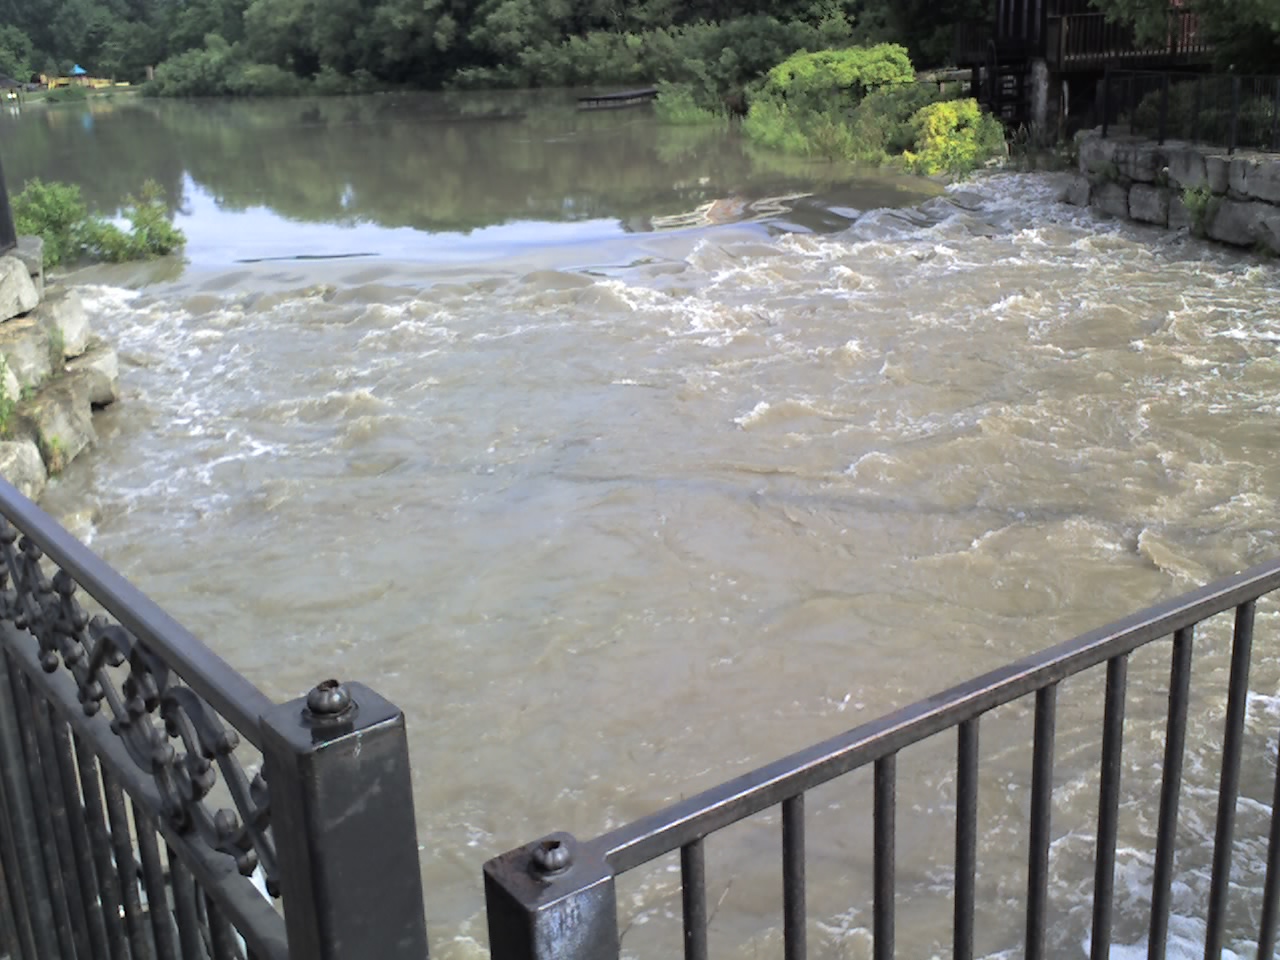
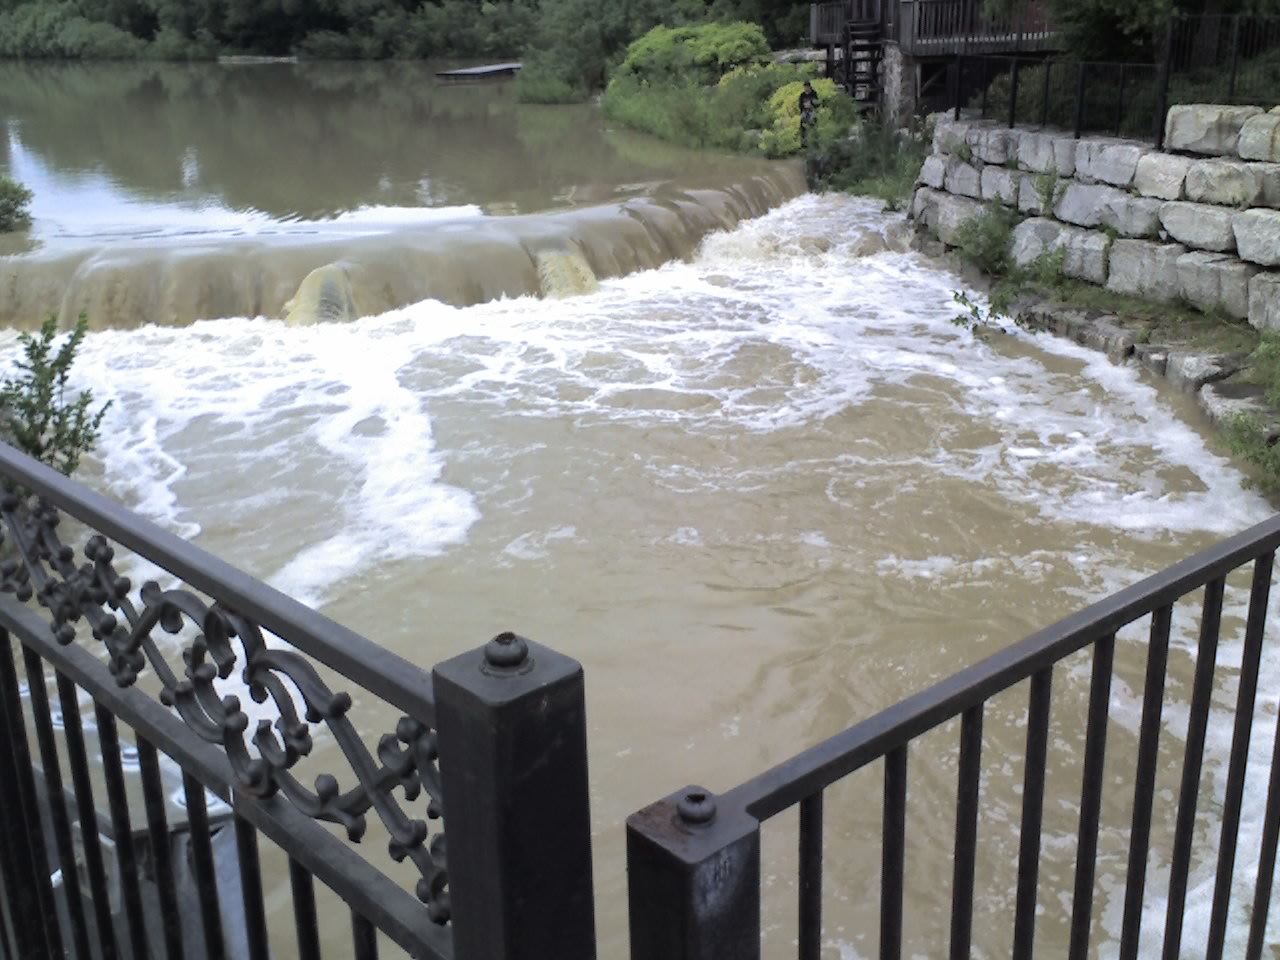
Silver Lake outlet at 12:30 pm, July 11th:
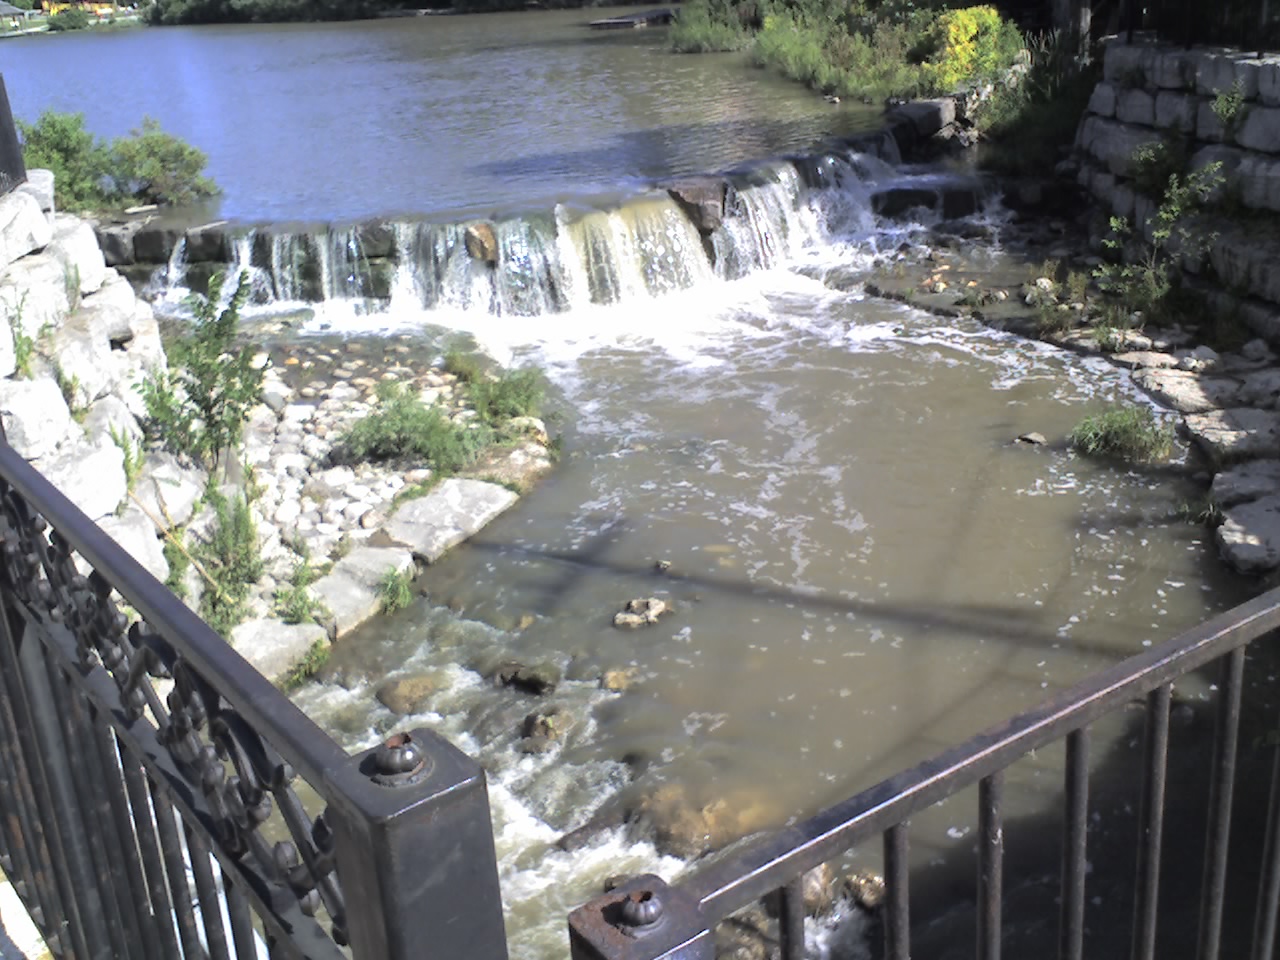
 Silver Lake outlet at 9:00 am, July 14th (just to show what it usually looks like):
This is now the highest one day precipitation since July 7, 1991 when 82.0 mm was recorded at the Waterloo-Wellington Airport. The wettest day since 1970 was 89.8 mm on July 15, 1985.
The average monthly precipitation for July is only 92.9 mm and this morning we got more precipitation than we did in March, April, or May.
Looking at the GRCA gauges you can see that there was only a narrow path of really heavy precipitation with Laurel Creek getting 66.8 mm but Cambridge, Woolwich, and Conestogo only receiving around 27 mm. While Guelph only recorded 7.6 mm.
(if you can't read the numbers above, here is a clearer view)
As I biked by Silver Lake this morning the boardwalk was flooded and you could not see the weir structure at the end of the lake.
Silver Lake outlet at 9:30 am, July 11th:
Silver Lake outlet at 12:30 pm, July 11th:
Silver Lake outlet at 9:00 am, July 14th (just to show what it usually looks like):
Thursday, July 10, 2008
Divergent forecasts
It is hard to make plans for the weekend when the two major forecasts can't agree.
As of 10 am on Thursday the temperature predictions are similar for the weekend, but the probability of precipitation has some major differences:
POP values
Saturday
EC - 60%
WN - 20%
Sunday
EC - 60%
WN - 20%
Monday
EC - 40%
WN - 10%
EC=Environment Canada
WN=The Weather Network
As of 10 am on Thursday the temperature predictions are similar for the weekend, but the probability of precipitation has some major differences:
POP values
Saturday
EC - 60%
WN - 20%
Sunday
EC - 60%
WN - 20%
Monday
EC - 40%
WN - 10%
EC=Environment Canada
WN=The Weather Network
Monday, July 7, 2008
Weather on Mars
I had a suggestion to add a link to the weather report on Mars that is being reported by the Canadian weather station on the Phoenix Mars Lander, so here it is:
http://www.space.gc.ca/asc/eng/exploration/phoenix_weather1.asp.
So far the highest temperature they have recorded is -24°C while the low is usually around -80°C.
The measured surface pressure on Mars is around 0.82 kPa, quite a bit lower than our usual reading of around 100 kPa.
But on the bright side at least it is usually sunny.
Wednesday, July 2, 2008
June 2008 Summary
A hot June with lots of rain
Before everybody scratches their heads thinking that it didn’t seem like a particularly hot June, I have to explain how we calculate the average temperature for a month: For each day we only look at the highest and the lowest temperatures, the average of those two readings is the average temperature for that day and then these numbers are averaged to get a number for the entire month.
We can then look at the average of all the high temperatures (0.3° below average in June), the average of all the low temperatures (2.9° above average in June), and the average of the average temperatures (1.3° above average in June).
Most people are probably more aware of the high temperature of the day as we are usually awake at the time and the low temperature occurs just before sunrise when most people are asleep. Thus in June the measure that most people can identify with was below average, but using the average temperature method it was an above average month for temperature.
Just one last point on this, a more exact method would be to take an average of all 2976 temperature readings for the month (1 every 15 minutes). But unfortunately we only have this kind of information at the UW weather station and thus we don’t have a long enough record to make meaningful averages.
One of the factors that makes the night time temperature warmer is the amount of cloud and as it turns out this was a cloudy month. To prove it I’ll give you the average incoming shortwave radiation comparison (something I don’t normally do, but it is relevant this time). The incoming shortwave radiation is a measure of how much of the sun’s energy gets to the sensor, a higher reading means more sun. This June the average was 221 Watts per square metre compared to the average of 242. Of course this reflects the amount of clouds in the daytime, but I’m assuming that there is a correlation between the amount of clouds during the day and the amount of clouds at night.
Up until the last few days of the month I kept telling people that although it felt like a really wet month the total precipitation was about average. I think that the fact there were 18 days when we had at least a little bit of rain made it seem wetter than it really was. However, on the 28th my theory was thrown out the window as we got an amazing 28.0 mm of rain putting us well above the average.
The 106.4 mm of rain we got this month made it the wettest June in the 10 year history of the UW weather station. Another wet month means that the total precipitation for the year (486.5 mm) is still well above the average for this time of year (416.1 mm).
Environment Canada prediction of temperature for the month: Above average
Actual Temperature: Above average
Summary for June 2008:
Maximum Temperature 30.4 °C
Minimum Temperature 8.3 °C
Average Daily High Temperature 23.2 °C (Long term average 23.5 °C)
Average Daily Low Temperature 14.1 °C (Long term average 11.2 °C)
Total Precipitation 106.4 mm (Long term average 80.0 mm)
(Long term averages based on 1970-2000 data for the Waterloo Wellington Airport)
Click on the image below to see the monthly chart:
Subscribe to:
Posts (Atom)


