Even though I wasn't able to measure even half a centimetre of snow this morning, waking up and seeing your backyard covered white still qualifies as the Fassnacht storm.
This is the name our office has for the snow storm that comes in late March or early April after all of the snow from the winter has melted. It is named after a former student who always said to watch out for that last storm.
Monday, March 30, 2009
Friday, March 27, 2009
We want more apps!
At the moment we have a UW Weather Station iGoogle gadget and the one for the MacOS one (and there is a second one for the Mac that someone wrote that I'll get out soon) but I want more.
There appears to be demand for apps on the following devices or operating systems:
Blackberry
iPhone
Yahoo widget
Vista sidebar
(If you have any suggestions for others leave a comment to this post)
So if anybody has the notion to write some of these, go crazy.
And before anybody is thinking they are going to get rich on this, be warned that we are only going to link to apps from the weather station that are free.
I don't want to have to judge any particular one to be the "official" weather station choice, so I'll try and put them all out there and let the interweb decide which one is best.
I'll make a separate blog posting for each app so that there is a place that people can leave feedback. This has worked well with the MacOS one, as it has been updated a few times based on feedback.
If you make an app, send me a description to weather (at) civmail.uwaterloo.ca and also be sure to include exactly how people can download the necessary files.
Submitted so far:
iGoogle gadget
MacOS application
MacOS application II
Friday, March 20, 2009
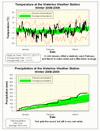
Winter 2008/09 Summary
A very wet winter with average temperatures
A very cold January was enough to offset a relatively warm February and March to put the entire winter season just a bit below average but still within the average range. It was 0.4 °C below average in the end with nothing particularly significant about the highest (16.6 °C) or lowest (-28.8 °C) temperatures seen during the season.
The trend of wet winters continued with 244.2 mm of total precipitation falling compared to an average of 184.5 mm. This makes 5 of the last 6 winters recording above average precipitation. The beginning of the season was very wet, it then levelled off, but some heavy rainstorms in the beginning of March put us well above average.
It is always awkward to just look at the snowfall during the 3 months of winter as opposed to the entire snowfall season that goes from September all the way to May. But a winter summary wouldn't be complete without it, so I will say we got 128.5 cm of snow this winter compared to the average of 106 cm, above average but not a record or anything. By the way we usually average about 13 cm for the spring.
Summary for Winter 2008/09:
Maximum Temperature 16.6 °C
Minimum Temperature -28.8 °C
Average Daily High Temperature -1.0 °C (Long term average -1.4 °C)
Average Daily Low Temperature -11.0 °C (Long term average -9.8 °C)
Total Precipitation 244.2 mm (Long term average 184.5 mm)
(Long term averages based on 1970-2000 data for the Waterloo Wellington Airport)
Follow this link to see the graph showing the temperature and precipitation:
Sign up to get the monthly weather station summary by e-mail
Wednesday, March 11, 2009
A very wet March so far
As of Wednesday morning, we have already had 60 mm of precipitation in March.
Not quite the monthly average of 70.6 mm yet, but as much as we had during the entire month last year.
Not quite the monthly average of 70.6 mm yet, but as much as we had during the entire month last year.
Friday, March 6, 2009
Warm day
The high temperature of 16.6°C on Friday, March 6th made it the warmest day since November 7th of last year.
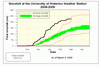
Snowfall summary - March 6, 2009
This weekend we will finally be surpassed by last year's total snowfall.
As of Friday we have had 224.0 cm and although last year at this time we only had 208.5 cm, over March 7th, 8th, and 9th of last year we had a total of 37.5 cm.
Ironically we might get the same amount of precipitation this weekend, however it will be wet rather than the white.
Although no big storms are in the forecast, we always seem to get that one big snowfall sometime in March when you think winter is over. Around here we call this the "Fassnacht" snowstorm, after the person in the office who always predicted it would come and as he is now the president of the Eastern Snow Conference maybe we should listen to him.
As we can easily get snow in April I'm not willing to call an end to the snowfall season just yet, but it looks doubtful that we will set another record this year. Right now we are 5th on the all time snowfall total.
Here are the current top 5 highest snowfall season totals for the area:
2007-08
257.5 cm
1923-1924
245.3 cm
1942-43
235.0 cm
1925-26
227.3 cm
1983-84
221.6 cm
Click on the image below to see the snowfall graph:
Wednesday, March 4, 2009
Shortwave radiation dip
I added a new question on the FAQ page that I thought I should put here as well:
Q: Why does the graph of incoming radiation sometimes have a dip in the readings around noon even when it seems like it is a perfectly sunny day?
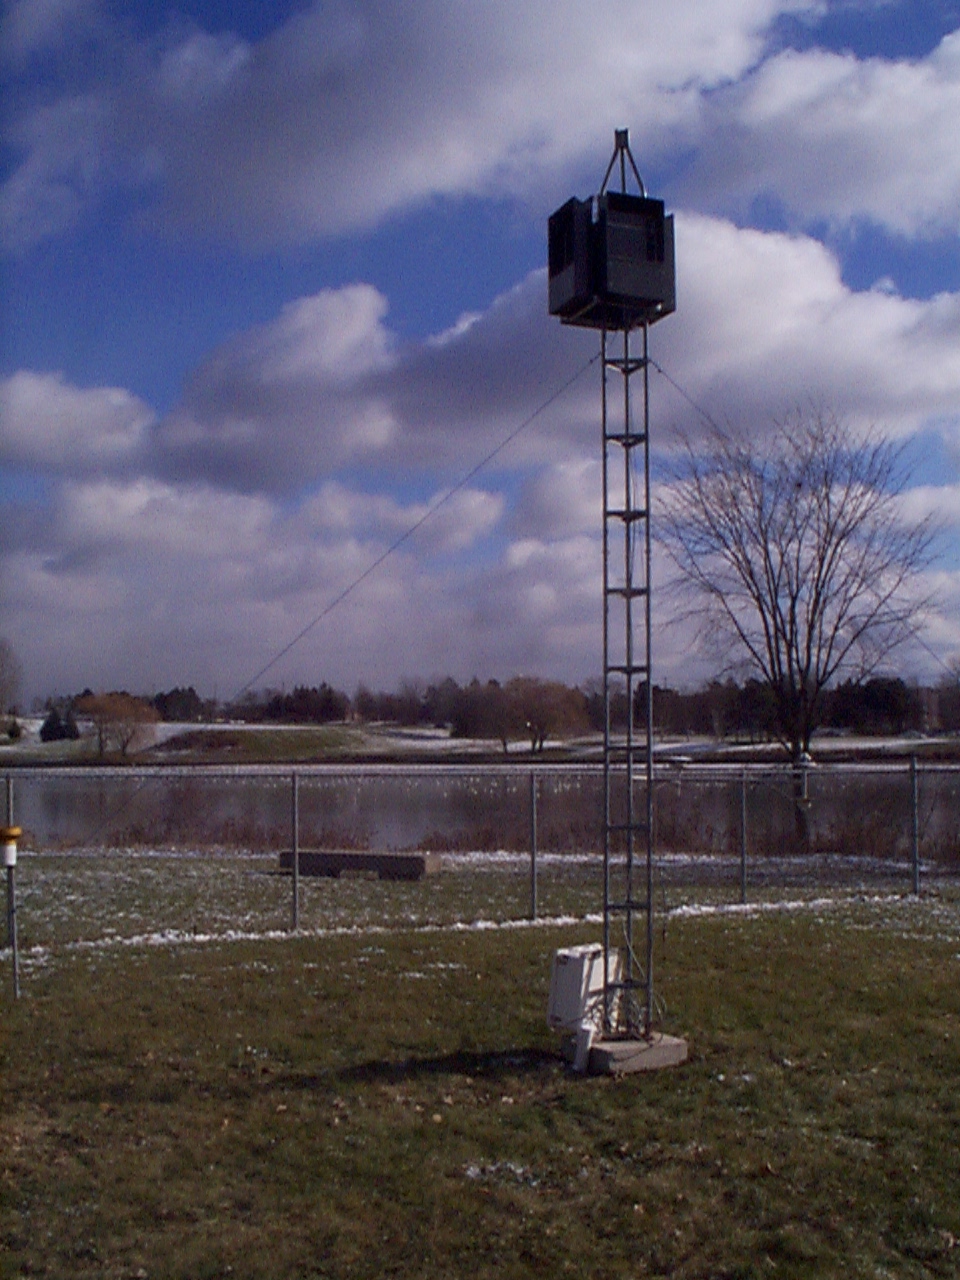
In the fall of 2002 we installed a device on top of the Micrometeorology tower south of the main station to measure the incoming precipitation from different directions.
See a picture of the installation here
Unfortunately, as the tower is south of the main station and the device is rather large there are times of the year when it will cast a shadow on the incoming solar radiation gauge. That is the reason for the dip in the solar radiation readings.
This effect is seen from about January 9th to March 7th and then again from October 5th to November 21st.
At the moment we have no solution to this problem, however we are examining whether or not the device will be kept at the station.
Q: Why does the graph of incoming radiation sometimes have a dip in the readings around noon even when it seems like it is a perfectly sunny day?
In the fall of 2002 we installed a device on top of the Micrometeorology tower south of the main station to measure the incoming precipitation from different directions.
See a picture of the installation here
Unfortunately, as the tower is south of the main station and the device is rather large there are times of the year when it will cast a shadow on the incoming solar radiation gauge. That is the reason for the dip in the solar radiation readings.
This effect is seen from about January 9th to March 7th and then again from October 5th to November 21st.
At the moment we have no solution to this problem, however we are examining whether or not the device will be kept at the station.
Sunday, March 1, 2009
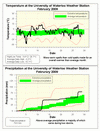
February 2009 summary
A warm month with above average precipitation
For the first time since September we had a warmer than average month. Although there were a couple of short cold spells, they were offset by longer warm periods making the overall temperature a full degree higher than average. This also made it the warmest February since 2002.
Historically, February is the driest month of the year with only 51.3 mm of precipitation, but this year we had 79.6 mm, making it an above average month. Most of that came during two rain events, the 42.7 mm on the 11th and 12th and the 22.6 mm on the 27th. Considering we only average 25.6 mm of rain during February, this year's rain total is about 2 and half times the average.
After seeing a lot of snow in the first half of the season, we only had 25 cm in February putting it below the average of 31 cm.
We have now had 128.8 mm of precipitation this year compared to the average of 115.7 mm for the end of February.
Environment Canada prediction of temperature for the month: Average
Actual Temperature: Above average
Summary for February 2009:
Maximum Temperature 8.4 °C
Minimum Temperature -28.7 °C
Average Daily High Temperature -0.2 °C (Long term average -1.9 °C)
Average Daily Low Temperature -10.1 °C (Long term average -10.5 °C)
Total Precipitation 79.6 mm (Long term average 51.3 mm)
(Long term averages based on 1971-2000 data for the Waterloo Wellington Airport)
Sign up to get the monthly weather station summary by e-mail
Subscribe to:
Posts (Atom)


