Wednesday, June 30, 2010

June 2010 Summary

A warm June that was the wettest in over 40 years

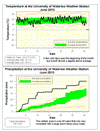
Apart from a 5 day cold stretch at the beginning of the month, the rest of June was pretty warm. Overall it was a full degree warmer than average, despite the fact that the highest temperature was only 28.3 °C, the lowest June high since 1993.

But the real story was the precipitation, at 130.3 mm it was the wettest June since 1967 and the wettest of any month since December 2008. The rain was consistent with a large storm (over 10 mm) occurring at least once a week and 17 days with some precipitation compared to 12 days on average.

But even with this really wet month the precipitation for the first half of the year is still a bit below average. We have had 372.3 mm so far in 2010 and the average at this point in the year is 415.0 mm.

Summary for June 2010:

Maximum Temperature 28.3 °C
Minimum Temperature 5.4 °C
Average Daily High Temperature 23.1 °C (Long term average 23.6 °C)
Average Daily Low Temperature 13.6 °C (Long term average 11.3 °C)
Total Precipitation 130.3 mm (Long term average 80.0 mm)

(Long term averages based on 1971-2000 data for the Waterloo Wellington Airport)


Sign up to get the monthly weather station summary by e-mail

Monday, June 28, 2010

1 step forward, 2 steps back

The updates and rewiring weren't 100% successful, sorry but I am going to have to take off the pressure again until we figure out what is happening with it.

Monday, June 21, 2010

Isolated rain on Saturday

Looking at the precipitation report from the GRCA you can see that Cambridge was the only location in the area that got any rain this past Saturday. Crazy to see one location get almost 25 mm and Ayr getting 1 mm was the only other station that reported any.


Spring 2010 Summary

Warmest Spring since 1998 with average precipitation

It was a full 2 degrees above average this Spring, making it the warmest since 1998. The warmth was pretty consistent with only a week of colder temperatures in May and a few in June that were significantly below average.

Although we got around 25 mm more than the average precipitation for the season, this is still within the average range (albeit on the high side). It was also a feast or famine situation with the precipitation, as for most of it we would go a week or two without anything and then have a few very wet days in a row.

Summary for Spring 2010:
Maximum Temperature 31.3 °C
Minimum Temperature -7.1 °C
Average Daily High Temperature 17.9 °C (Long term average 15.9 °C)
Average Daily Low Temperature 6.2 °C (Long term average 4.4 °C)
Total Precipitation 243.5 mm (Long term average 219.5 mm)

(Long term averages based on 1971-2000 data for the Waterloo Wellington Airport)

Sign up to get the monthly weather station summary by e-mail

Tuesday, June 15, 2010

A wet June already

After a dry first five months of year (none had more than average precipitation), June has come back with a vengeance.

As of the halfway point of the month we have already had more precipitation (81.6 mm) than the average for the entire month (80.0 mm).

Monday, June 7, 2010

Higher than the maximum incoming solar radiation

These days near the summer solstice and when there are big puffy clouds in the sky are typically when we get the highest values of incoming solar radiation all year.

In fact the readings are sometimes higher than the maximum incoming solar radiation which confuses some people. One has to remember that the maximum values are the maximum "direct" incoming solar radiation while the instruments we have at the UW weather station measure both "direct" and "reflected" solar radiation.

So on days like today not only is the sun producing a lot of direct solar radiation but those big puffy (and white) clouds are also reflecting a lot of that solar radiation towards the sensor.

Of course you also see really low readings as well when the direct solar radiation is blocked by one of those clouds.

Semi back to normal

I have taken the "beta" tag off of the website as we now think that the station is somewhat stable.

You may notice that we are using the precipitation gauge that only gives us the 1 hour readings and there are no pressure readings.

I should been better at only putting readings on the station that came from stable instruments, for example, the lack of updated precipitation although it was on the website.

I apologize for the confusion this created last week when it was raining and nothing was showing.

In the future I will do my best to only display readings from instruments that we have confidence in.

But note that the archive will contain all the readings as that's just the way we roll here at the UW weather station.

Thursday, June 3, 2010

May 2010 Summary

We had problems with the equipment at the UW weather station during the month of May. As a result this summary is based on readings from the Environment Canada weather station at the Waterloo-Wellington Airport.


University of Waterloo Weather Station Summary - May 2010

A warm May with average precipitation

It was the warmest May since 1999 with an overall temperature about one and half degrees above average. A cold snap from May 6th to 13th was offset by a very warm end to month where we saw temperature that were more summer-like.

This makes 7 months in a row that the temperature was above average.

The 67 mm of precipitation was a little less than the 75.7 mm average, but this is still within the average range. About 25 mm came down on the very wet May 7th.


Summary for May 2010:
Maximum Temperature 31,8 °C
Minimum Temperature -1.2 °C
Average Daily High Temperature 20.5 °C (Long term average 18.9 °C)
Average Daily Low Temperature 7.8 °C (Long term average 6.6 °C)
Total Precipitation 67.3 mm (Long term average 75.7 mm)

(Long term averages based on 1971-2000 data for the Waterloo Wellington Airport)