The second hottest September we have seen in 100 years
With only 3 colder than average days and the very warm start to the month, it isn’t surprising that this was the second hottest September we have seen in the 100 years of measurements in the region (only 1961 was warmer). Overall it was 4 degrees above the average which is the most above average month since that crazy March of 2012.
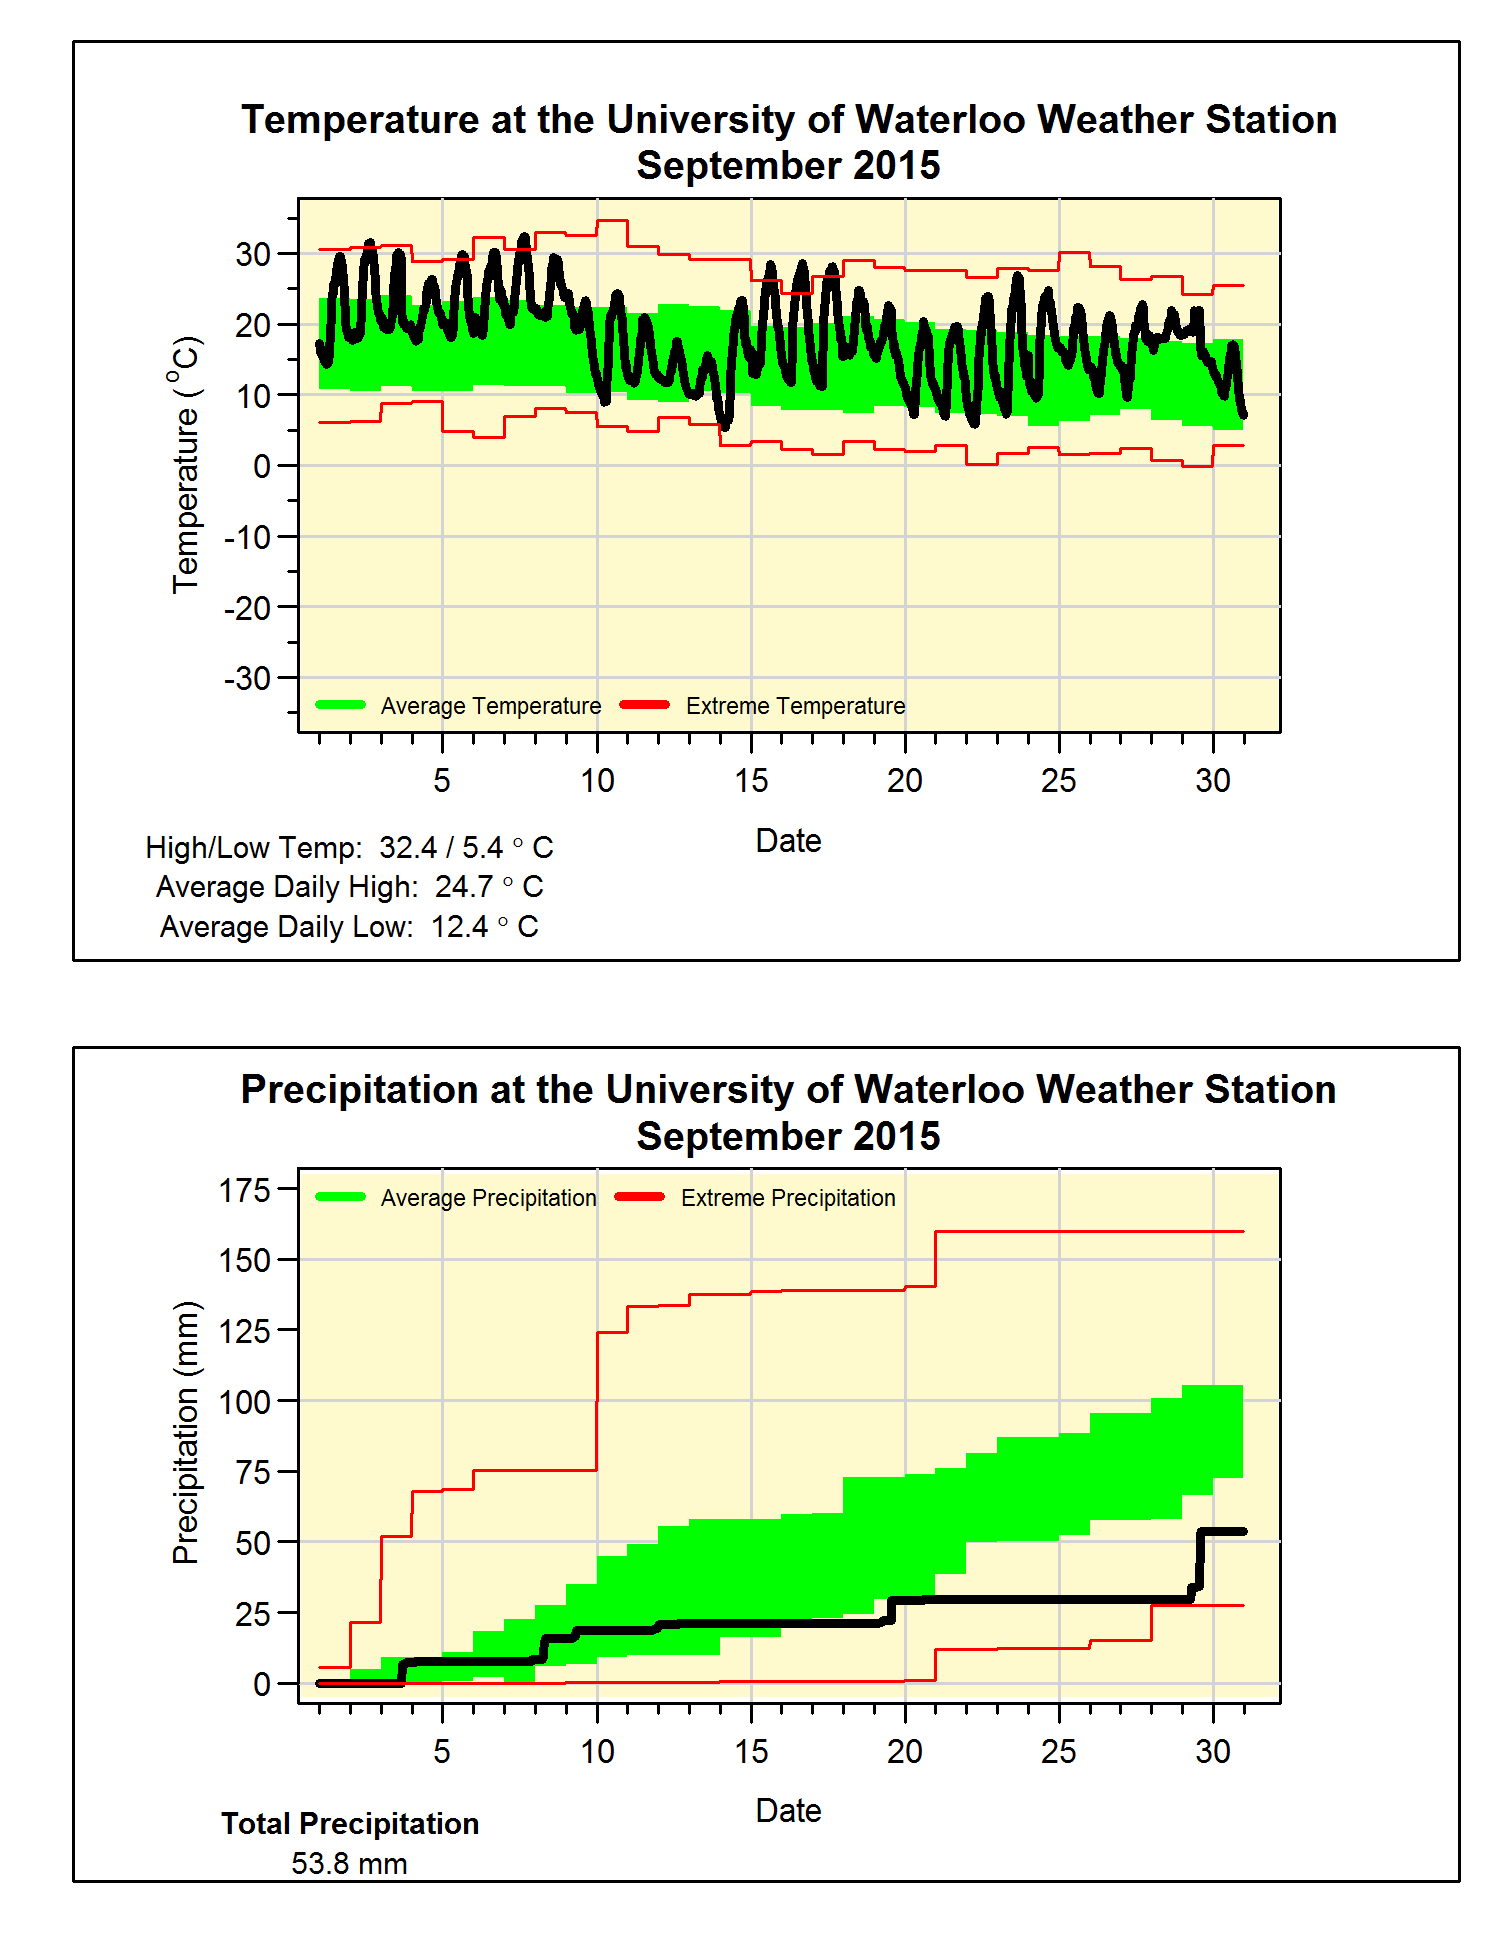
What really set the month apart was the summer-like weather at the beginning with a string of temperatures near 30, this resulted in the average daily high temperature for September only a fraction of a degree below those of August.
We saw some, but not a lot of precipitation in September, in fact it would have been amongst the lowest if not for 24 mm on the 29th. The total of only 53.8 mm was well below the average of 87.8 mm and puts the total for the year (570.2 mm) a little further away from what we would expect at this time of year (683.5 mm).
Summary for September 2015:
Maximum Temperature 32.4°C
Minimum Temperature 5.4°C
Average Daily High Temperature 24.7°C (Long term average 20.4°C)
Average Daily Low Temperature 12.4°C (Long term average 8.6°C)
Total Precipitation 53.8 mm (Long term average 87.8 mm)
(Long term averages based on 1981-2010 data for the Waterloo Wellington Airport)
With only 3 colder than average days and the very warm start to the month, it isn’t surprising that this was the second hottest September we have seen in the 100 years of measurements in the region (only 1961 was warmer). Overall it was 4 degrees above the average which is the most above average month since that crazy March of 2012.
What really set the month apart was the summer-like weather at the beginning with a string of temperatures near 30, this resulted in the average daily high temperature for September only a fraction of a degree below those of August.
We saw some, but not a lot of precipitation in September, in fact it would have been amongst the lowest if not for 24 mm on the 29th. The total of only 53.8 mm was well below the average of 87.8 mm and puts the total for the year (570.2 mm) a little further away from what we would expect at this time of year (683.5 mm).
Summary for September 2015:
Maximum Temperature 32.4°C
Minimum Temperature 5.4°C
Average Daily High Temperature 24.7°C (Long term average 20.4°C)
Average Daily Low Temperature 12.4°C (Long term average 8.6°C)
Total Precipitation 53.8 mm (Long term average 87.8 mm)
(Long term averages based on 1981-2010 data for the Waterloo Wellington Airport)