The UW weather station got a mention in Environment Canada's regional weather highlights for 2008.
We are mentioned under the "Soaker Storms in Kitchener-Waterloo" story.
Canada's Top Ten Weather Stories for 2008 - Regional Weather Highlights 2008
Tuesday, December 30, 2008
Could be the wettest December ever!
Another record we are going for in these last days of 2008:
The highest ever December precipitation was 1949 with 139.7 mm.
As of 9:30 am on Monday, December 29 we have had 132.5 mm.
We are expected to get about 5 cm of snow on Tuesday night, as that usually translates into about 5 mm of precipitation we will probably be very close to the record.
The highest ever December precipitation was 1949 with 139.7 mm.
As of 9:30 am on Monday, December 29 we have had 132.5 mm.
We are expected to get about 5 cm of snow on Tuesday night, as that usually translates into about 5 mm of precipitation we will probably be very close to the record.
Saturday, December 27, 2008
Annual precipitation total
A few weeks back I said that it would be very hard for us to move up from third spot on the list of the highest annual precipitation totals in the area.
But then we got all this rain.
The current highest precipitation we have had in the area was 1186.4 mm in 1985 and the second highest was 1174.9 mm in 1940.
As of 4:00 pm on Saturday, December 27 we have had 1152.2 mm in 2008.
But then we got all this rain.
The current highest precipitation we have had in the area was 1186.4 mm in 1985 and the second highest was 1174.9 mm in 1940.
As of 4:00 pm on Saturday, December 27 we have had 1152.2 mm in 2008.
Monday, December 22, 2008
Fall 2008 Summary
The snowiest fall since 1951 (3rd snowiest ever) with below average temperatures
(Long term averages based on 1971-2000 data for the Waterloo Wellington Airport)
Follow this link to see the graph showing the temperature and precipitation:

With 96 cm of snow, the fall of 2008 ranks as the third snowiest fall since records in the area began back in 1915 (the two snowiest were 1950 with 114.5 cm and 1951 with 105.5 cm). However what we got as snow we didn't get as rain, so the total precipitation of 250.4 mm puts it just barely above the average range.
Looking at the temperature, there were a couple of warmer than average periods during late September and early October. But after reaching 20 °C in early November the temperature was consistently lower than average for the rest of the season. Even though overall it was only 0.7 °C colder than the average, it still ranks as the coldest fall in the 10 year history of the UW weather station.
Summary for Fall 2008:
Maximum Temperature 26.2 °C
Minimum Temperature -18.8 °C
Average Daily High Temperature 7.9 °C (Long term average 8.5 °C)
Average Daily Low Temperature -1.1 °C (Long term average -0.3 °C)
Total Precipitation 250.4 mm (Long term average 222.5 mm)
(Long term averages based on 1971-2000 data for the Waterloo Wellington Airport)
Follow this link to see the graph showing the temperature and precipitation:
Sign up to get the monthly weather station summary by e-mail
Friday, December 19, 2008
Snow-maggeddon - December 19th version
Unofficial "snow-maggeddon" totals for December 19th.
7:00 am - 0.0 cm
8:00 am - 0.5 cm
9:00 am - 2.0 cm
10:00 am - 5.5 cm
11:00 am - 10.0 cm
12:00 pm - 11.5 cm
1:00 pm - 13.0 cm
2:00 pm - 15.0 cm
3:00 pm - 16.5 cm
4:00 pm - 18.0 cm
5:00 pm - 18.5 cm
This will be final update as the snow stopped around 5 pm.
Here is graph showing the intensity of the storm.
As you can see from the graph the storm had a very consistent intensity for most of the day, with a bit of break around 1 pm.
Listen to my chat about today's storm with Carlos and Gayle from DaveFM.
Download the chat here.
Wednesday, December 17, 2008
Very snowy fall
Depending on how much of the forecasted snow we get this Friday, this fall could make it into the top three snowiest fall seasons since record keeping began back in 1915.
As of Wednesday morning we have had 75.5 cm of snow this fall.
Right now the top three are:
1950 - 114.5 cm
1951 - 105.5 cm
1921 - 81.0 cm
As of Wednesday morning we have had 75.5 cm of snow this fall.
Right now the top three are:
1950 - 114.5 cm
1951 - 105.5 cm
1921 - 81.0 cm
Monday, December 15, 2008
Cold temperatures are a coming.
With a cold front coming across southern Ontario today, I thought it might be interesting to watch the contrast in temperatures across the region as the day progresses.
As of 9:30 am:
Flint -2°C
Sarnia 5°C
London 8°C
Waterloo 7°C
Burlington 10°C
Toronto 10°C
St. Catharines 13°C
As of 10:30 am:
Flint -3°C
Sarnia 4°C
London 8°C
Waterloo 7°C
Burlington 11°C
Toronto 11°C
St. Catharines 11°C
As of 11:30 am:
Flint -5°C
Sarnia 1°C
London 7°C
Waterloo 5°C
Burlington 10°C
Toronto 9°C
St. Catharines 11°C
As of 12:30 am:
Flint -6°C
Sarnia -1°C
London 5°C
Waterloo 2°C
Burlington 8°C
Toronto 8°C
St. Catharines 10°C
As of 1:30 pm:
Flint -7°C
Sarnia -2°C
London 2°C
Waterloo 0°C
Burlington 7°C
Toronto 7°C
St. Catharines 8°C
As of 2:30 pm:
Flint -8°C
Sarnia -3°C
London 1°C
Waterloo -2°C
Burlington 5°C
Toronto 3°C
St. Catharines 6°C
As of 3:30 pm:
Flint -8°C
Sarnia -4°C
London -1°C
Waterloo -3°C
Burlington 3°C
Toronto 1°C
St. Catharines 5°C
As of 4:30 pm:
Flint -8°C
Sarnia -5°C
London -2°C
Waterloo -5°C
Burlington 2°C
Toronto -1°C
St. Catharines 4°C
As of 5:30 pm:
Flint -8°C
Sarnia -6°C
London -4°C
Waterloo -6°C
Burlington 0°C
Toronto -1°C
St. Catharines 2°C
Friday, December 12, 2008
December 12th snowfall update
I'm going to try and put out a snowfall update for the season each week.
As of December 12th:
2008-09 season - 69 cm
2007-08 season - 30 cm
Long term average - 35 cm
Still more than twice last year's amount and the official start to winter is over a week away.
As of December 12th:
2008-09 season - 69 cm
2007-08 season - 30 cm
Long term average - 35 cm
Still more than twice last year's amount and the official start to winter is over a week away.
Wednesday, December 10, 2008
Third wettest year of all time
With the mixed bag of precipitation we saw on December 9th, the total precipitation for this year passed the 1064.6 mm recorded during 1986.
That means 2008 is now officially the third wettest year for this region since records began back in 1915.
But it will be a challenge to move up any higher as the second spot is currently held by 1940 with 1174.9 mm and the wettest year was in 1985 when 1186.4 mm was recorded.
As we would need another 100 mm in the three remaining weeks of the year to get to the top, we will probably have to happy with third place.
Friday, December 5, 2008
December 5th snowfall update
It seems that people are interested in how this snow season is comparing to last year's record setting one.
Well last year on December 5th our snowfall total was 27.5 cm, while this year we have already had 52 cm.
That is almost twice as much as last year, but we still have a long way to go to beat last year's record of 257.5 cm.
Well last year on December 5th our snowfall total was 27.5 cm, while this year we have already had 52 cm.
That is almost twice as much as last year, but we still have a long way to go to beat last year's record of 257.5 cm.
Monday, December 1, 2008
November 2008 Summary
Another wet month with cold temperatures
It isn’t very hard to see when the weather changed this November, after a few days that were close to 20 °C in the first week and a high of 8 °C on the 15th, the temperature went south and never again got above 2.5 °C. The contrast between the two halves of the month can clearly be seen in the temperature graph (see the link below); as well you can see the period near the end of the month when the temperature hovered around 0 for almost 4 days.
Overall the month was 0.8 degrees below average, this is a bit warmer than last year’s November when it was 0.9 degrees below average. However, the daily highs were actually colder this year than they were last year, but the daily lows were warmer making the overall average temperature a bit warmer.
Another month of above average precipitation with 115.0 mm coming down compared to the average of 82.3 mm. Most of this occurred between the 14th and 16th (48.8 mm), during the transition between the warm and cold parts of the month.
A total of 1023.2 mm of precipitation has been recorded so far this year, which is of course well above the average of 835.6 mm. We have now had the 3rd highest precipitation for the first 11 months of any year since records in the area began back in 1915.
It will however be difficult to end up with the wettest year on record, to do this we would need 163 mm in December to overtake 1985 and 151 mm to come in second just ahead of 1940. To put this into perspective the highest total precipitation for the month of December was 139.7 mm in 1949.
Summary for November 2008:
Maximum Temperature 20.4 °C
Minimum Temperature -12.8 °C
Average Daily High Temperature 5.2 °C (Long term average 6.1 °C)
Average Daily Low Temperature -2.0 °C (Long term average -1.4 °C)
Total Precipitation 115.0 mm (Long term average 82.3 mm)
(Long term averages based on 1971-2000 data for the Waterloo Wellington Airport)
Follow this link to see the graph showing the temperature and precipitation:
Sign up to get the monthly weather station summary by e-mail
Friday, November 28, 2008
Flat line temperature 2
The temperature went above +1°C on the morning of November 28th, breaking a streak of 88 hours when the temperature stayed been between +1°C and -1°C.
The longest previous streak of a 2 degree temperature range I found in the history of the UW weather station was back in 1998 between March 17th and 20th when we had 59 hours in that range.
As it turns out, when I looked in the data archives any time we had over 2 days of steady temperatures, it was always very close to 0.
Unfortunately, this isn't something that's very easy to get from the other data archives available so it I don't know if I'll have the time to see if this is an all-time record.
Wednesday, November 26, 2008
Flat line temperature
I can't remember a week like this one, since Monday afternoon the temperature has been between +1°C and -1°C.
The temperature graph is pretty much just a flat line.
And looking at the forecast we might not break out of this cycle till Saturday.
The temperature graph is pretty much just a flat line.
And looking at the forecast we might not break out of this cycle till Saturday.
Saturday, November 22, 2008
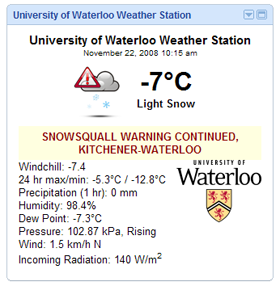
iGoogle gadget
For those of you who use the iGoogle homepage, a gadget has been created that puts the latest readings from the UW weather station right on your homepage.
As well as the latest readings the gadget also displays the current weather conditions (at the moment it comes from weather underground, but we are working on making current condition statements from the UW weather station data) and any current Environment Canada weather advisories. You can also set it up so see the latest postings from this blog.
Thanks goes to Wayne Jenkinson for creating the gadget.
Here is a sample screenshot:

You can just search for "UW weather station" in the add a gadget page of iGoogle or here is the direct link:
http://www.google.ca/ig/directory?hl=en&url=praxistech.ca/uwweather/uw-weather-gadget.xml
Please try it out and leave some feedback.
Also if there is any other way that you would like the weather station data to be delivered please leave a comment to this post.
As well as the latest readings the gadget also displays the current weather conditions (at the moment it comes from weather underground, but we are working on making current condition statements from the UW weather station data) and any current Environment Canada weather advisories. You can also set it up so see the latest postings from this blog.
Thanks goes to Wayne Jenkinson for creating the gadget.
Here is a sample screenshot:
You can just search for "UW weather station" in the add a gadget page of iGoogle or here is the direct link:
http://www.google.ca/ig/directory?hl=en&url=praxistech.ca/uwweather/uw-weather-gadget.xml
Please try it out and leave some feedback.
Also if there is any other way that you would like the weather station data to be delivered please leave a comment to this post.
Monday, November 17, 2008
Weekend snow
We recorded about 18 cm of snow over the weekend at the UW weather station.
I hope everybody was able to find their shovels this morning.
I hope everybody was able to find their shovels this morning.
Wednesday, November 5, 2008
A couple of very warm November days
Although we don't like to talk about "daily record temperatures" at the UW weather station (see here for an explanation why), this is a noteworthy spell of high temperatures.
Seeing a temperature over 20°C in November isn't that unusual, on average it happens about once every 5 years.
However, getting two days in a row in November above 19°C hasn't happened since 1990 and it is only the third time since 1970.
By the way, the highest all-time November temperature I was able to find was back on November 1st, 1950 when it was 25.0°C (followed by a 20 cm snowfall 3 days later).
Saturday, November 1, 2008
October 2008 Summary
A dry month with average temperatures
It must be fall with the battles between cold air from the north and warm air from the south, this showed up in the temperature record with lots of days that were either well above or well below average. But as often happens in this case, they cancelled each other out and we are left with an overall temperature within the average range (0.3 degrees below average for the month).
For the first time since April, we had a below average month for precipitation. Only 45.0 mm fell during October in lots of small storms throughout the month with only 1 day having double digit precipitation (11.2 mm on the 8th).
We have now had 907.9 mm of precipitation this year compared to the average of 754.9 mm for the end of October. So even if we don't get anything in November and December, we have now surpassed the average annual precipitation for the area (904.1 mm). However, we have slipped down to being the 8th wettest first 10 months of the year from the 5th wettest first 9 months of the year.
Environment Canada prediction of temperature for the month: Average
Actual Temperature: Average
Summary for October 2008:
Maximum Temperature 26.2 °C
Minimum Temperature -4.8 °C
Average Daily High Temperature 13.4 °C (Long term average 13.5 °C)
Average Daily Low Temperature 2.5 °C (Long term average 3.0 °C)
Total Precipitation 45.0 mm (Long term average 67.1 mm)
(Long term averages based on 1971-2000 data for the Waterloo Wellington Airport)
Follow this link to see the graph showing the temperature and precipitation:
Sign up to get the monthly weather station summary by e-mail
Wednesday, October 29, 2008
First snow of the season
Well no doubt about that one.
We got 2 cm last night to make October 29th the first official day with measurable snow at the UW weather station for the 2008-09 snowfall season.
Only 256 cm more and we break the all time record!
We got 2 cm last night to make October 29th the first official day with measurable snow at the UW weather station for the 2008-09 snowfall season.
Only 256 cm more and we break the all time record!
Friday, October 24, 2008
Perhaps the first snow of the season?
With snow in the forecast I always get the question about how to tell when we get the first snow of the season at the UW weather station.
This question (along with many other) are answered on the Frequently Asked Questions(FAQ) page.
Here were the first occurrences of measurable snow on the ground for the past few years:
2001 - Nov 20
2002 - Nov 2
2003 - Nov 29
2004 - Nov 7
2005 - Nov 17
2006 - Oct 13
2007 - Nov 16
This question (along with many other) are answered on the Frequently Asked Questions(FAQ) page.
Here were the first occurrences of measurable snow on the ground for the past few years:
2001 - Nov 20
2002 - Nov 2
2003 - Nov 29
2004 - Nov 7
2005 - Nov 17
2006 - Oct 13
2007 - Nov 16
Tuesday, October 21, 2008
The return of windchill
Although the official high temperature for Tuesday, October 21st was 8.2°C, that happened at midnight.
So the "daytime" high was only around 4°C, which makes it a very cold day.
It was also the first time I can remember seeing the Windchill graph appear on the Weather Graphs page since the spring.
But we didn't see any of the snow that was predicted by some of the long range forecasts from last week.
OK maybe some of the precipitation I saw today looked kind of solid, but I didn't see anything that could be actually be classified as snow.
Friday, October 17, 2008
Fall Colours
Looks like it will be a fine weekend to enjoy the fall colours.
Here are some sites that give you the current status of the trees around Ontario:
Ontario Parks
Ministry of Tourism
Here are some sites that give you the current status of the trees around Ontario:
Ontario Parks
Ministry of Tourism
Friday, October 10, 2008
Thanksgiving weekend 2008
Pre-weekend post:
It doesn't look like this Thanksgiving weekend is going to be as nice as last year's when the average temperature was around 27°C and we got to 30°C on the Monday.
However, if we get to the mid-twenties it will still be 10 degrees warmer than the average for this time of year and there is no rain in the forecast, so that's not too bad.
After-weekend post:
I don't think there can be any complaints about the Thanksgiving weekend, the average temperature was around 24°C and no rain to be seen.
Tuesday, October 7, 2008
First Frost Day
At 5:00 am on the morning of Tuesday, October 7th the temperature when below zero for the first time since the spring, making it the first frost day of the fall.
The last time we had a frost day was back on May 1st. This made for 158 frost free days during the summer, which is exactly the average over the last 10 years.
The last time we had a frost day was back on May 1st. This made for 158 frost free days during the summer, which is exactly the average over the last 10 years.
Monday, October 6, 2008
Possible first frost day
There is a forecast low of -1°C for Monday night/Tuesday morning.
This would be the first frost of the season.
In the 10 years of the UW weather station the first frost day has ranged between October 2nd and October 28th, with the average coming in around the 11th.
But no matter if it does actually go below zero at the station, depending on your particular location there is a good chance that you will get frost and you should make appropriate arrangements for your delicate plants.
Cold Day
On Thursday, October 2nd the high only reached 10.3°C.
This is the coldest daytime high temperature since May 21st.
This is the coldest daytime high temperature since May 21st.
Wednesday, October 1, 2008
September 2008 Summary
A hot month with above average precipitation
In the 10 year history of the UW weather station, the temperature in September has been the most above the average of any month and this year is no different. In total, 8 of the last 11 Septembers have been above average and the other 3 have been average with none below average (looking back the Environment Canada archive, 1993 was the last time we had a cold September). This year it was 1.6 degrees warmer than the standard average period of 1971-2000.
We were on a torrid pace during the first half of the month with 107.6 mm of precipitation by the 15th, however since then we have only had another 8.6 mm. This still puts us far above the average of 87.5 mm, but if we had doubled the first half total it would have been something to see.
With 862.9 mm of precipitation at the end of September, this is now the 5th wettest first 9 months of the year since record keeping began back in 1915.
Environment Canada prediction of temperature for the month: Average
Actual Temperature: Above average
Summary for September 2008:
Maximum Temperature 29.9 °C
Minimum Temperature 4.8 °C
Average Daily High Temperature 21.7 °C (Long term average 20.2 °C)
Average Daily Low Temperature 10.3 °C (Long term average 8.5 °C)
Total Precipitation 116.2 mm (Long term average 87.5 mm)
(Long term averages based on 1971-2000 data for the Waterloo Wellington Airport)Follow this link to see the graph showing the temperature and precipitation:
Sign up to get the monthly weather station summary by e-mail
Sunday, September 28, 2008
Summer of 2008 poll results
Here are the final results of the summer of 2008 poll:
51% (108 Votes) It was a great summer, not too hot and the air was mostly clean, wouldn't have changed a thing.
26% (56 Votes) It was good, but I would have liked a few over 30 days and a little less rain.
7% (16 Votes) It was OK, some good days, some bad days, felt like an average summer.
8% (18 Votes) It was bad, the rain got me down.
5% (12 Votes) It was a total washout, too much rain and it never felt like beach weather.
So overall, 75% of you thought it was either a great or good summer. There was certainly a few people who voiced their opinion to me that they didn't like the summer, but obviously they were in the minority.
Monday, September 22, 2008
Summer 2008 Summary
A very, very wet summer (5th wettest ever) with slightly above average temperatures
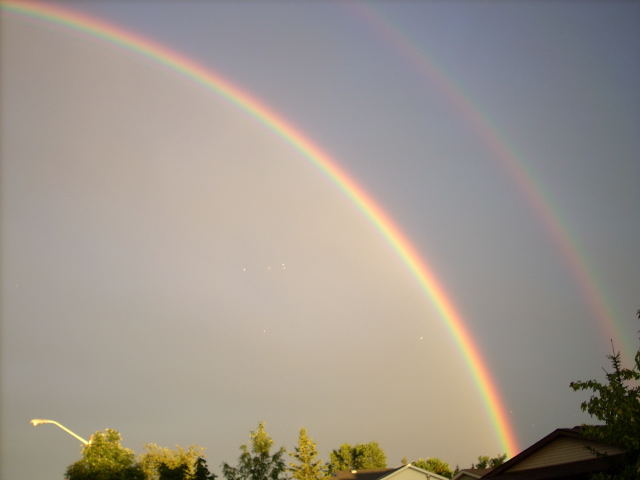
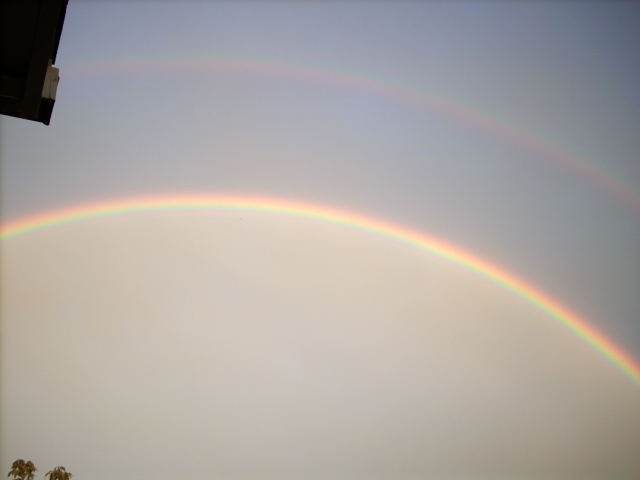
Although we had 46 days with some precipitation compared to an average of about 33 days for a typical summer, most of these storms were intense, short storms that quickly made way to sunny skies. That's why one could call it the "Summer of Rainbows" as there seemed to be a lot of them this year as evidenced by lots of people sending me their pictures. I don't have any number to back it up, but it seemed that there were very few "dreary" days where it rained or was cloudy the entire day.
As this summer contained the greatest single day precipitation in the 10 year history of the UW Weather Station (78.0 mm on July 11) and 4 more days with over 20 mm, it is not surprising that the total for the season (416.2 mm) was well above the average (272.1 mm).
This was the 5th wettest summer since records began way back in 1915. Here are the totals from the summers that beat us: 557.0 mm (1915), 452.2 mm (1987), 430.9 mm (1940), and 423.7 (1988).
**Special note on the 1915 total, a lot of that came from the single wettest day on record in the area, August 4th, 1915, when a spectacular 175.3 mm is reported to have fallen. I am a bit sceptical about that number, however although only 42 mm was reported in Guelph, there is a reading of 126 mm that day in Toronto. If anybody has the time to check out local newspaper reports from around that time I would love to know what they said about that storm as it would have been an incredible amount of rain.**
For only the second time in UW Weather Station history, we did not see a single temperature above 30 degrees during the entire summer (the only other time this happened was in 2004). However, that didn't mean it was a cold summer as the overall average was 0.5 °C warmer than average for the season. The temperature was pretty consistent as there were only 2 days that were more than 5 degrees colder than average and 4 days that were 5 degrees warmer.
The air was pretty clean throughout the summer with only one day that actually registered "poor" air quality (July 18th) according to the Ontario Ministry of the Environment website.
Summary for Summer 2008:
Maximum Temperature 29.9 °C
Minimum Temperature 4.8 °C
Average Daily High Temperature 24.3 °C (Long term average 24.3 °C)
Average Daily Low Temperature 13.4 °C (Long term average 12.3 °C)
Total Precipitation 416.2 mm (Long term average 272.1 mm)
(Long term averages based on 1970-2000 data for the Waterloo Wellington Airport)
Follow this link to see the graph showing the temperature and precipitation:
Sign up to get the monthly weather station summary by e-mail
Friday, September 19, 2008
What did you think about this summer?
Perhaps you thought there was too much rain this summer, maybe you wanted some really hot temperatures?
Or are you on the other side and think it was a perfect summer with moderate temperatures and clean air?
Have your say, vote in the poll and then see how your opinion compares with everybody else.
Or are you on the other side and think it was a perfect summer with moderate temperatures and clean air?
Have your say, vote in the poll and then see how your opinion compares with everybody else.
Saturday, September 13, 2008
A Wet Weekend
In the end, most of the rain from the remnants of hurricane Ike went to the north of Waterloo.
As evidenced by the GRCA rain gauge at Dundalk which measured almost 90 mm for the weekend.
But for us, Saturday was when we saw most of the weekend's rain.
Here were the 6 hour totals:
Sat Noon-6 pm: 8.6 mm
Sat 6pm-Midnight: 19.4 mm
Sun Midnight-6am: 6.2 mm
Sun 6am-Noon: 0.4 mm
Sun Noon-6pm: 1.6 mm
Sun 6pm-Midnight: 9.4 mm
Mon Midnight-6am: 0.4 mm
Total since noon on Saturday: 46.0 mm
Wednesday, September 10, 2008
Some cold mornings
We got down to 5.6°C on the morning of September 10th at 7:15 am and 4.8°C at 6:00 am on September 11th.
These are the coldest temperatures we have seen since May 29th.
These are the coldest temperatures we have seen since May 29th.
Tuesday, September 2, 2008
August 2008 Summary
An average month all around
The August daytime highs were about half a degree below average while the early morning lows were about half a degree above average. Not surprisingly this means the month was average overall with only a few days that were more than 5 degrees off of the average. We certainly haven't seen any extended hot weather streaks this year with only two days above 30°C so far in 2008 and they were both way back in early June.
After two very extreme months of precipitation, August was only average. The 79.2 mm was below the average of 87.0 mm, but still within the average range. However, 62 mm of that fell during the first half of the month leaving the second half dare I say dry? I don't want to say we are in a drought, but it was the driest 15 day period since late May - early June.
We have had 746.7 mm of precipitation so far in 2008 compared to the average for this time of year of 596.0 mm. This is the second highest total at this point of the year since 1970. We are chasing 1985 which had 803.8 mm at the end of August and did end up having the recent record for wettest year. Going back to the 1915, where missing data periods becomes an issue, there are 4 more years with higher values as of August 31st. So we can say that so far it is the 6th wettest year since record keeping began back in 1915.
Environment Canada prediction of temperature for the month: Average
Actual Temperature: Average
Summary for August 2008:
Maximum Temperature 28.6 °C
Minimum Temperature 6.9 °C
Average Daily High Temperature 24.1 °C (Long term average 24.8 °C)
Average Daily Low Temperature 13.1 °C (Long term average 12.7 °C)
Total Precipitation 79.2 mm (Long term average 87.0 mm)
(Long term averages based on 1970-2000 data for the Waterloo Wellington Airport)
Follow this link to see the graph showing the temperature and precipitation:
Sign up to get the monthly weather station summary by e-mail
Friday, August 29, 2008
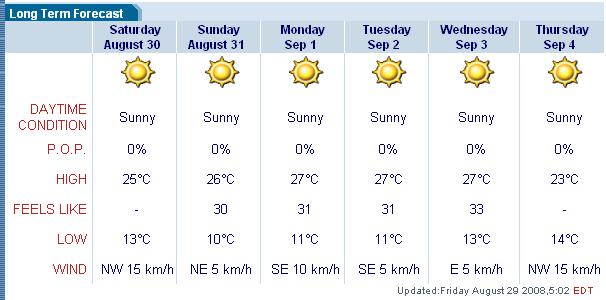
Enjoy the weekend!
I don't know the last time I have seen a 7 day forecast like this:

Not only sunny each and every day but a 0% chance of precipitation as well.
Ironically, it looks like summer weather might finally be here, just in time for school to start.
Not only sunny each and every day but a 0% chance of precipitation as well.
Ironically, it looks like summer weather might finally be here, just in time for school to start.
Friday, August 22, 2008
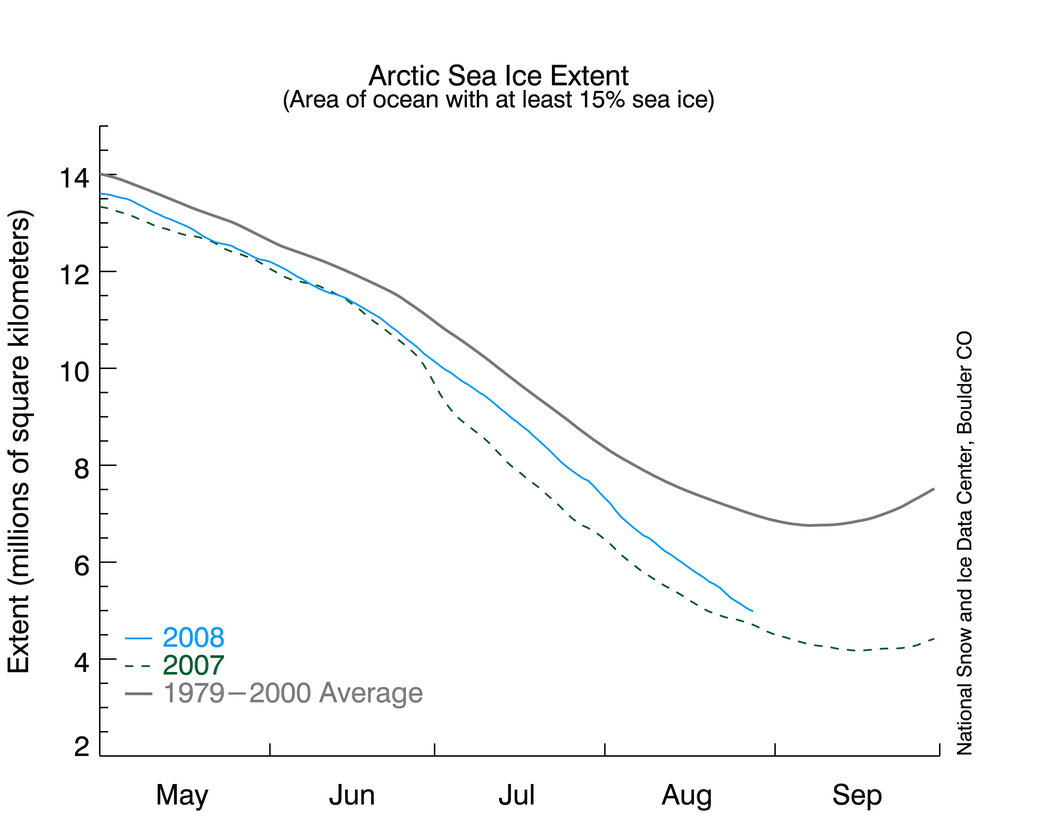
Arctic Ice still melting
It is still possible that this summer will see even less arctic ice than last year's minimum, but it is going to depend how these next few weeks play out.
Historically the arctic ice minimum occurs during September.
Right now the amount of ice is well below average and is close to last year:

The solid gray line is the historical average ice extent, the dashed green line is last year's, and the solid blue line is for this year.
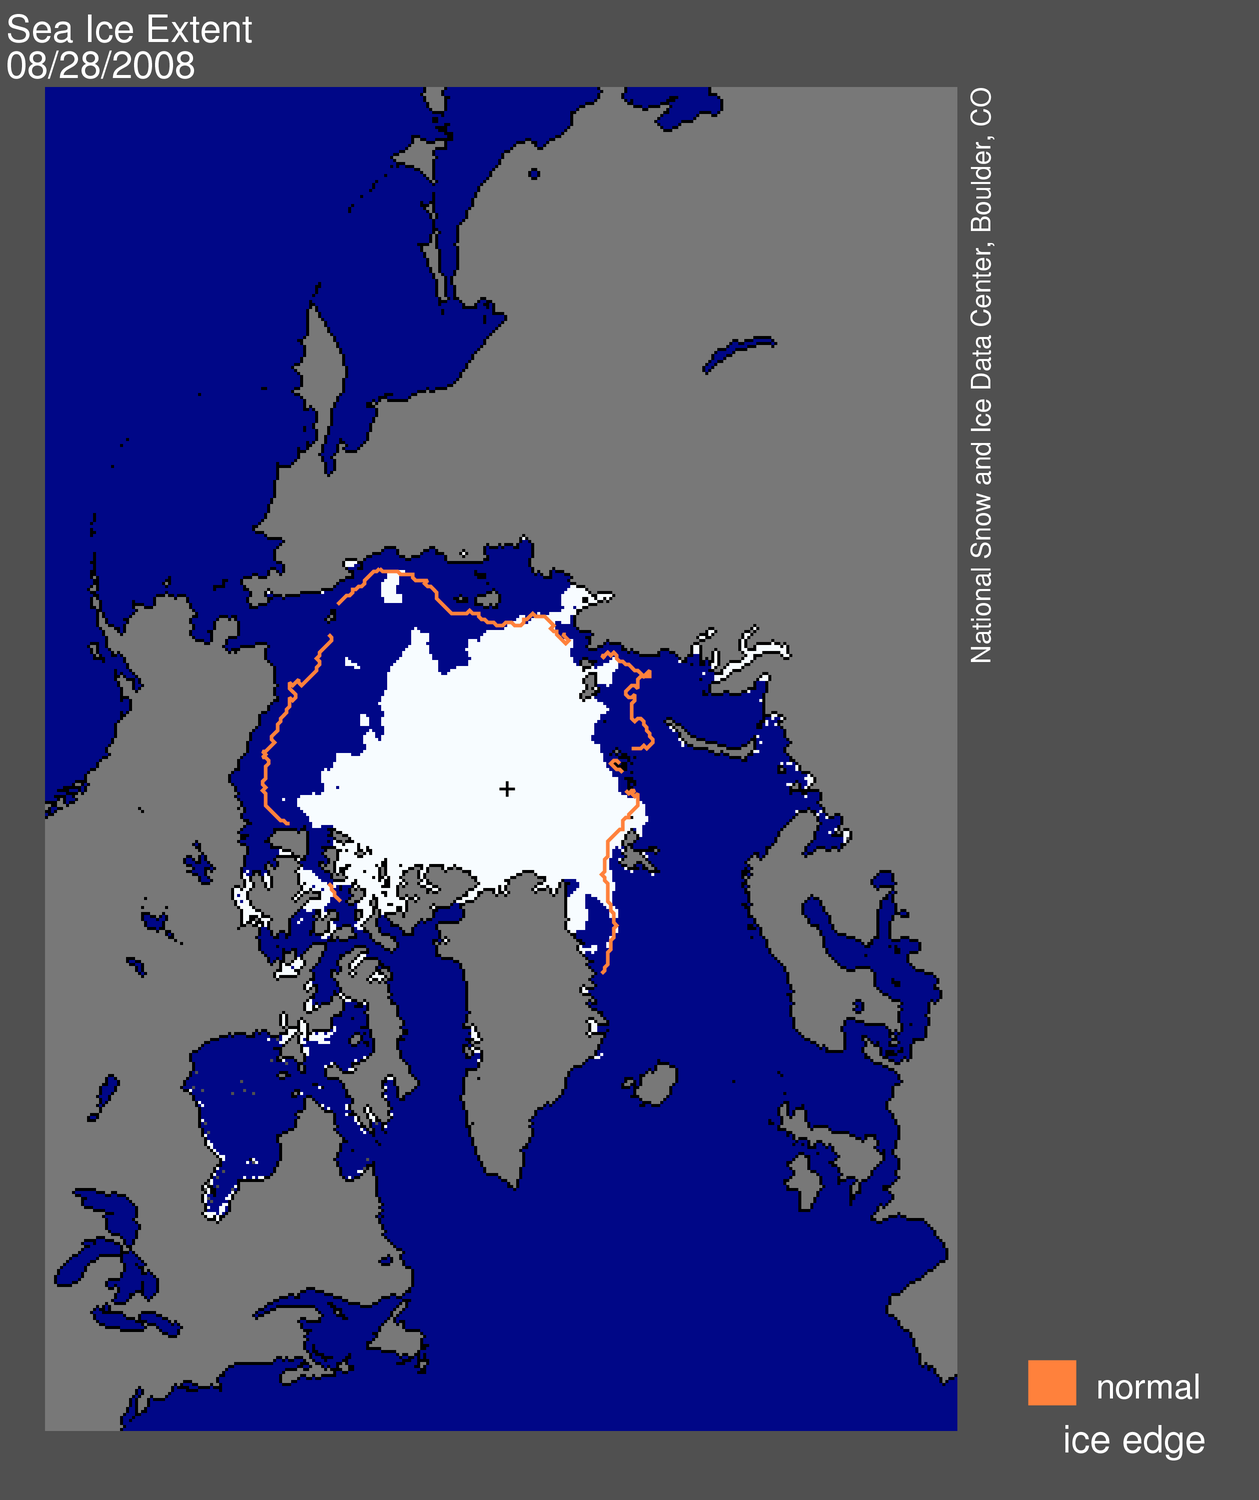
They also have a daily update of the aerial extent of the ice along with the location of the average ice edge (orange line):

You can get the latest graphs and pictures as well as analysis of this year's melt here:
NSICD Arctic Sea Ice News
Historically the arctic ice minimum occurs during September.
Right now the amount of ice is well below average and is close to last year:
The solid gray line is the historical average ice extent, the dashed green line is last year's, and the solid blue line is for this year.
They also have a daily update of the aerial extent of the ice along with the location of the average ice edge (orange line):
You can get the latest graphs and pictures as well as analysis of this year's melt here:
NSICD Arctic Sea Ice News
Wednesday, August 13, 2008
I'm calling it the summer of rainbows
Just looking out my office window and once again I see a rainbow.
I think the number of days this summer where we have seen both rain and sun has made this the summer of rainbows.
I can't remember ever seeing as many as I have this year, but I don't think I will be able to prove this as "number of rainbows" is not commonly reported at weather stations.
Here are some photos sent in by Mike from August 11th:

Monday, August 11, 2008
Cool August day
On Sunday, August 10th the high temperature was only 18.8°C, making it the lowest daytime high since June 19th.
That night (so actually the morning of August 11th) the temperature got down to 10.6°C our coldest temperature since July 5th.
That night (so actually the morning of August 11th) the temperature got down to 10.6°C our coldest temperature since July 5th.
Sunday, August 10, 2008
Yet another intense rainfall
On August 9th, 14.4 mm of rain fell between 5:15-5:30 pm.
Before last month that would have been the highest 15 minute amount since 2000, but now it is only the highest for a few weeks.
Before last month that would have been the highest 15 minute amount since 2000, but now it is only the highest for a few weeks.
Friday, August 1, 2008
July 2008 Summary
The wettest month in 17 years with above average temperatures
We had 2 very significant rainfall events during the month, the first occurred on the morning of July 11th between 3 and 9 am when 78.0 mm of rain fell. This was the highest one day total precipitation in the 10 year history of the weather station and you have to go back to July 7, 1991 to find a higher daily total (82.0 mm).
According to the Ministry of Transportation standards this is the kind of 6 hour storm that is likely to occur only once every 25 years. (see more information about this storm along with pictures here: uwweatherstation.blogspot.com/2008/07/record-rainfall.html )
The second significant rainfall event came during the evening of July 22nd between 7:30 and 7:45 pm when got 23.0 mm of rain. Again this was the highest 15 minute total in UW weather station history, but I don't know of any other local station that publishes 15 minute data, so I don't know how long since we have seen an event of that magnitude. However, using the MTO standards it would be classified as a 1 in 10 year storm, hence not quite as significant as the July 11th storm. (see more info here: uwweatherstation.blogspot.com/2008/07/another-week-another-record-rainfall.html )
Hardly surprising then that the overall precipitation for the month was the most we have seen at the station for any month (181.0 mm). We have to go back to July of 1991 at the Waterloo-Wellington airport station to find a month that had more (182.6 mm).
An intense storm on the 30th put the month into 5th place for the highest July precipitation total since records began in the region in 1915 (number one is 1988 when there was 223.2 mm).
The combined June/July precipitation (287.4 mm) was the third highest of all time, here the highest total goes back to 1947 when the combined June/July precipitation was 309.4 mm.
We have had 667.5 mm of precipitation so far in 2008, the average for this time of year is 506.0 mm. Last year at this time we only had 354.5 mm, thus this year we have had almost twice as much precipitation as 2007.
Not much to stay temperature-wise about July, it averaged out to 0.7 degrees above average which is just enough to call it an above average month. Just like June the daily low temperatures were very much above average while the daily high temperatures were actually slightly below average.
Thanks to Prof. Bryan Tolson for getting me the MTO data.
Environment Canada prediction of temperature for the month: Below average
Actual Temperature: Above Average
Summary for July 2008:
Maximum Temperature 29.6 °C
Minimum Temperature 8.3 °C
Average Daily High Temperature 25.7 °C (Long term average 25.9 °C)
Average Daily Low Temperature 15.3 °C (Long term average 13.7 °C)
Total Precipitation 181.0 mm (Long term average 92.9 mm)
(Long term averages based on 1970-2000 data for the Waterloo Wellington Airport)
Click on the image below to see the monthly chart:

Sign up to get the monthly weather station summary by e-mail
Monday, July 28, 2008
Rainfall records
There has been some talk about rainfall records being set in Toronto this summer.
I thought I should address this for Waterloo.
Here are the top 5 July precipitation totals:
1988 - 223.2 mm
1987 - 195.4 mm
1951 - 191.8 mm
1991 - 182.6 mm
1950 - 180.6 mm
Right now we are in 6th place for the July rainfall.
As of 10 am on July 28th we have had 164 mm.
We might be getting a few showers before the end of the month, but it is hard to imagine that we will get the 17 mm to catch up to 1950.
Here are the top 6 June/July precipitation totals:
1947 - 309.4 mm
1927 - 296.7 mm
1967 - 286.3 mm
1987 - 285.6 mm
1953 - 279.4 mm
1951 - 276.6 mm
Here we are only in 7th place with 270.4 mm.
However, we could move up depending on just how much we get this week as we only need 6 mm more.
Tuesday, July 22, 2008
Another week, another record rainfall.
On July 22nd between 7:30-7:45 pm 23.0 mm of rain fell.
That is the highest 15 minute rainfall we have recorded in the 10 year history of the UW weather station.
The previous record was 16.2 mm on June 27, 1999.
We also set an hourly record with 34.4 mm coming down between 7:15-8:15 pm.
That just surpassed the 33.9 mm on May 2, 2000.
By the way, I don't know how far back these records go, as they don't keep 15 minute data at the Waterloo-Wellington airport and I don't have their hourly data.
Not a record, but also interesting is that the temperature dropped 6.2°C between 7:15-7:45 pm.
On a personal note I happened to be biking just as the storm hit (I really should have checked the radar before I left) so I ended up watching the record rainfall from the (partial) shelter of one of the RIM buildings.
Friday, July 18, 2008
A Warm Night
On the night between July 17th and the 18th the temperature only went down to 22.1°C making it the warmest night we have seen since August 1st, 2006.
That night (actually the night between July 31st and August 1st) in 2006 the temperature only went down to 25.3°C.
That night (actually the night between July 31st and August 1st) in 2006 the temperature only went down to 25.3°C.
Friday, July 11, 2008
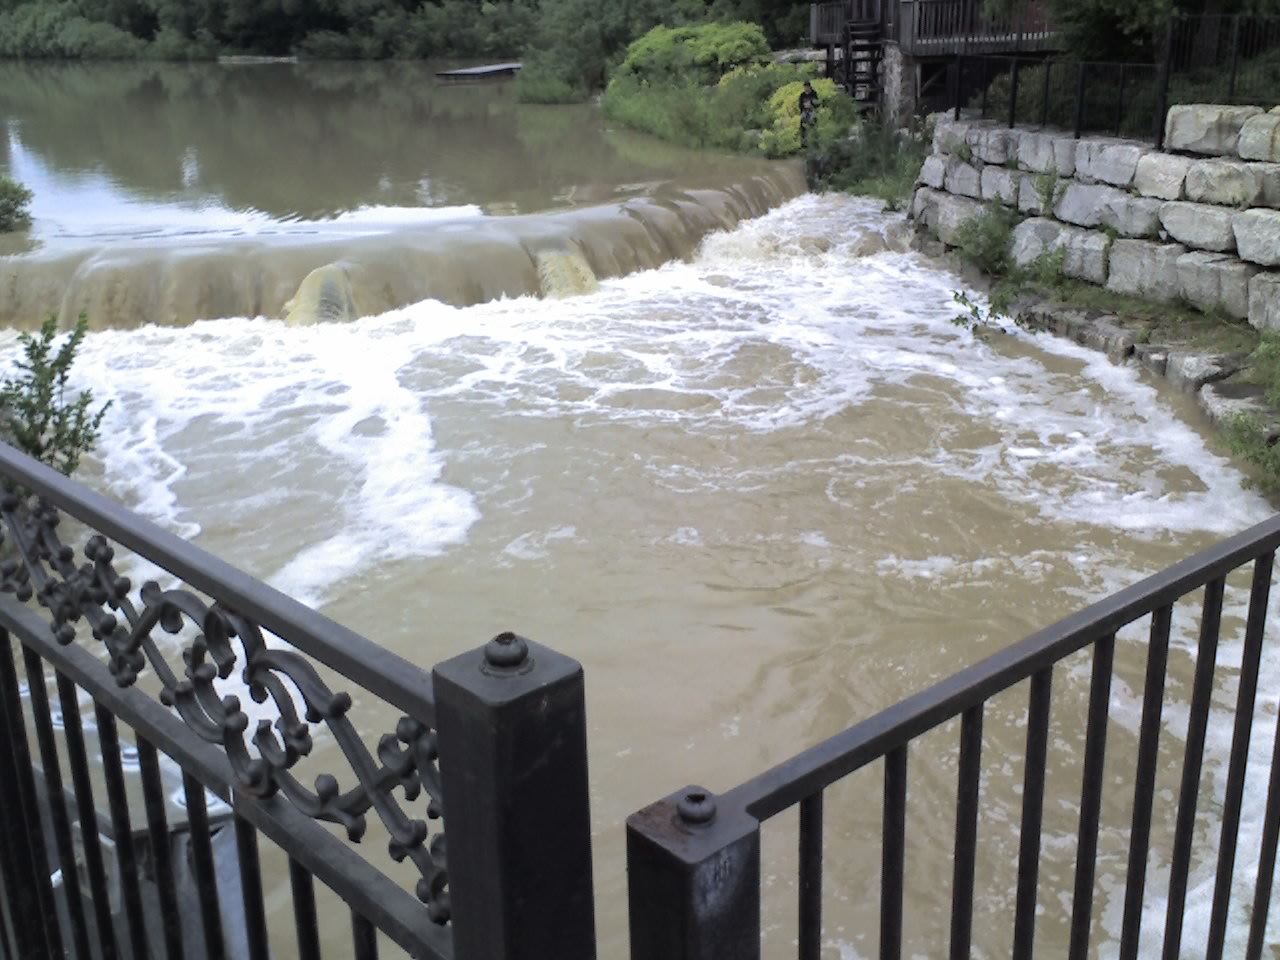
Record Rainfall
On the morning of July 11th between 3 and 9 am we recorded 78.0 mm of precipitation at the University of Waterloo Weather Station. This is the highest one day total we have seen in the 10 year history of the weather station (beating the 59.2 mm on July 16th, 2005).
This is now the highest one day precipitation since July 7, 1991 when 82.0 mm was recorded at the Waterloo-Wellington Airport. The wettest day since 1970 was 89.8 mm on July 15, 1985.
The average monthly precipitation for July is only 92.9 mm and this morning we got more precipitation than we did in March, April, or May.
Looking at the GRCA gauges you can see that there was only a narrow path of really heavy precipitation with Laurel Creek getting 66.8 mm but Cambridge, Woolwich, and Conestogo only receiving around 27 mm. While Guelph only recorded 7.6 mm.

(if you can't read the numbers above, here is a clearer view)
As I biked by Silver Lake this morning the boardwalk was flooded and you could not see the weir structure at the end of the lake.

Silver Lake outlet at 12:30 pm, July 11th:
 Silver Lake outlet at 9:00 am, July 14th (just to show what it usually looks like):

This is now the highest one day precipitation since July 7, 1991 when 82.0 mm was recorded at the Waterloo-Wellington Airport. The wettest day since 1970 was 89.8 mm on July 15, 1985.
The average monthly precipitation for July is only 92.9 mm and this morning we got more precipitation than we did in March, April, or May.
Looking at the GRCA gauges you can see that there was only a narrow path of really heavy precipitation with Laurel Creek getting 66.8 mm but Cambridge, Woolwich, and Conestogo only receiving around 27 mm. While Guelph only recorded 7.6 mm.
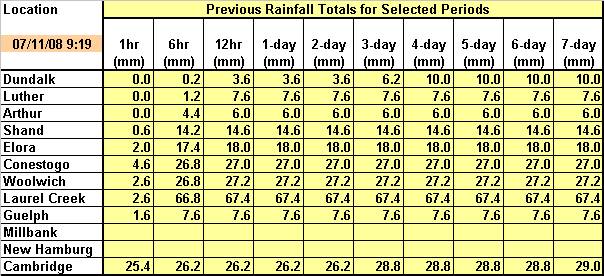
(if you can't read the numbers above, here is a clearer view)
As I biked by Silver Lake this morning the boardwalk was flooded and you could not see the weir structure at the end of the lake.
Silver Lake outlet at 9:30 am, July 11th:
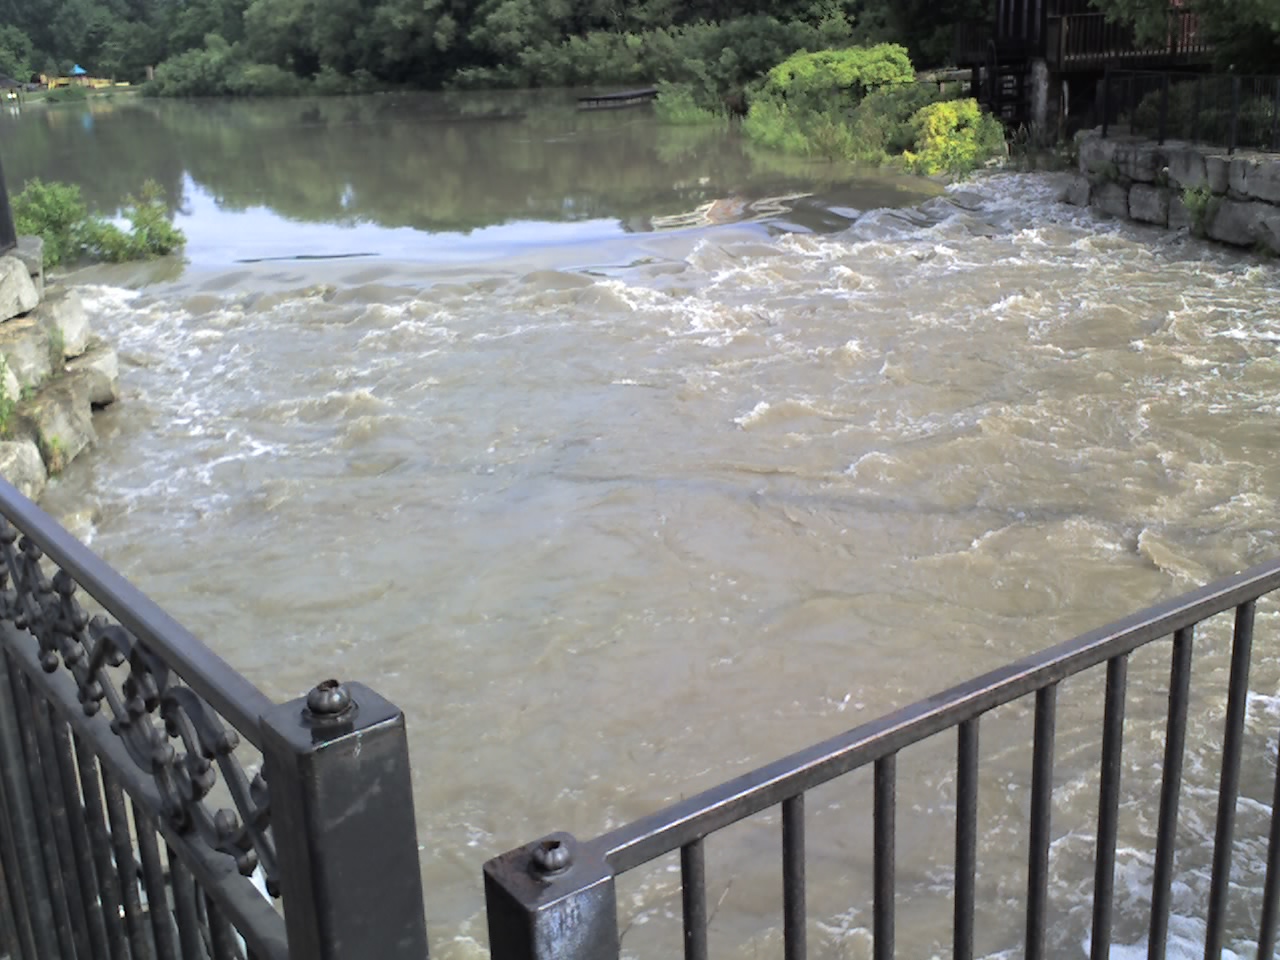
Silver Lake outlet at 12:30 pm, July 11th:
 Silver Lake outlet at 9:00 am, July 14th (just to show what it usually looks like):
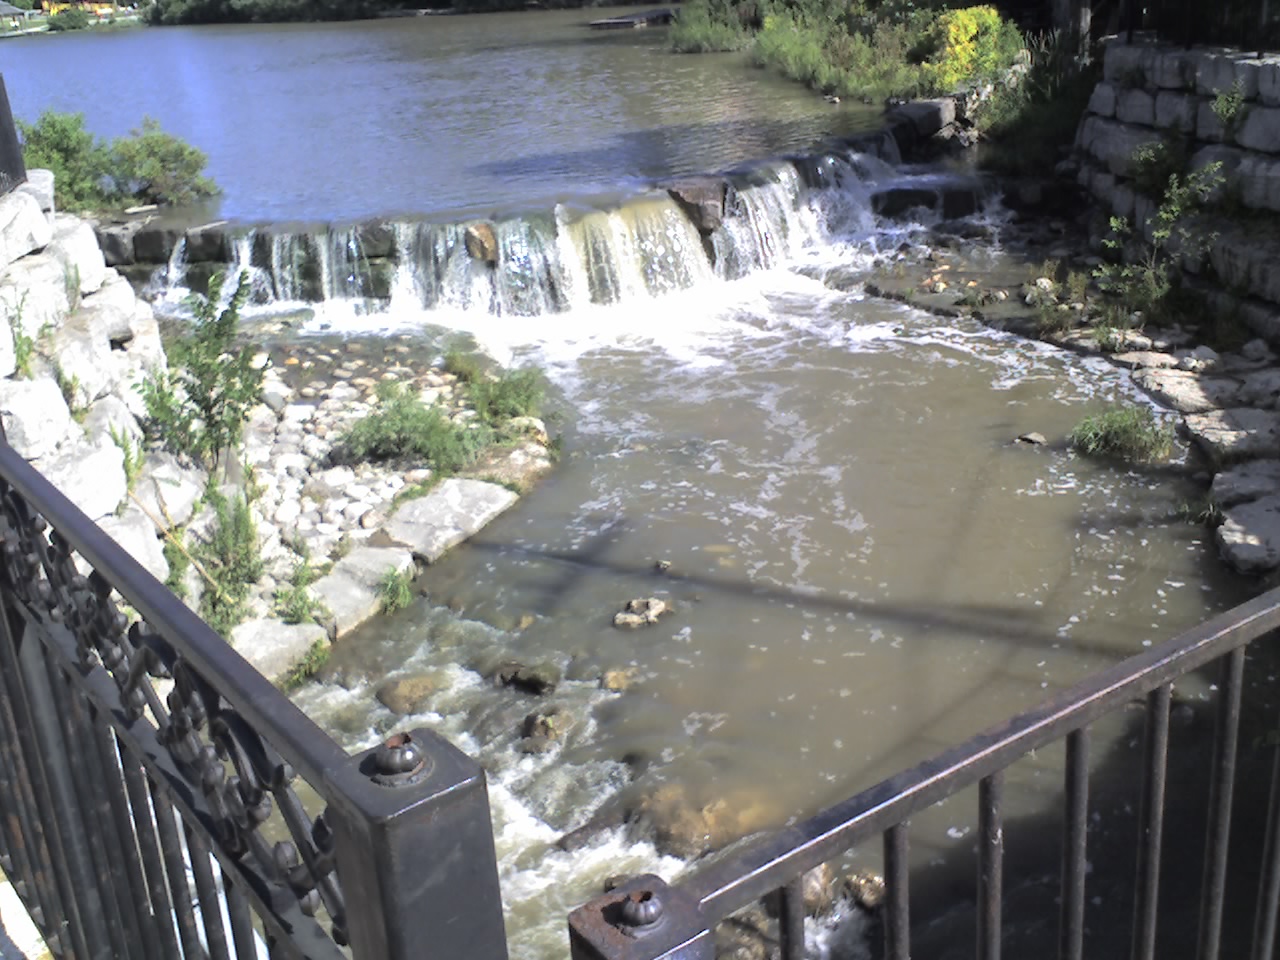
Thursday, July 10, 2008
Divergent forecasts
It is hard to make plans for the weekend when the two major forecasts can't agree.
As of 10 am on Thursday the temperature predictions are similar for the weekend, but the probability of precipitation has some major differences:
POP values
Saturday
EC - 60%
WN - 20%
Sunday
EC - 60%
WN - 20%
Monday
EC - 40%
WN - 10%
EC=Environment Canada
WN=The Weather Network
As of 10 am on Thursday the temperature predictions are similar for the weekend, but the probability of precipitation has some major differences:
POP values
Saturday
EC - 60%
WN - 20%
Sunday
EC - 60%
WN - 20%
Monday
EC - 40%
WN - 10%
EC=Environment Canada
WN=The Weather Network
Monday, July 7, 2008
Weather on Mars
I had a suggestion to add a link to the weather report on Mars that is being reported by the Canadian weather station on the Phoenix Mars Lander, so here it is:
http://www.space.gc.ca/asc/eng/exploration/phoenix_weather1.asp.
So far the highest temperature they have recorded is -24°C while the low is usually around -80°C.
The measured surface pressure on Mars is around 0.82 kPa, quite a bit lower than our usual reading of around 100 kPa.
But on the bright side at least it is usually sunny.
Wednesday, July 2, 2008
June 2008 Summary
A hot June with lots of rain
Before everybody scratches their heads thinking that it didn’t seem like a particularly hot June, I have to explain how we calculate the average temperature for a month: For each day we only look at the highest and the lowest temperatures, the average of those two readings is the average temperature for that day and then these numbers are averaged to get a number for the entire month.
We can then look at the average of all the high temperatures (0.3° below average in June), the average of all the low temperatures (2.9° above average in June), and the average of the average temperatures (1.3° above average in June).
Most people are probably more aware of the high temperature of the day as we are usually awake at the time and the low temperature occurs just before sunrise when most people are asleep. Thus in June the measure that most people can identify with was below average, but using the average temperature method it was an above average month for temperature.
Just one last point on this, a more exact method would be to take an average of all 2976 temperature readings for the month (1 every 15 minutes). But unfortunately we only have this kind of information at the UW weather station and thus we don’t have a long enough record to make meaningful averages.
One of the factors that makes the night time temperature warmer is the amount of cloud and as it turns out this was a cloudy month. To prove it I’ll give you the average incoming shortwave radiation comparison (something I don’t normally do, but it is relevant this time). The incoming shortwave radiation is a measure of how much of the sun’s energy gets to the sensor, a higher reading means more sun. This June the average was 221 Watts per square metre compared to the average of 242. Of course this reflects the amount of clouds in the daytime, but I’m assuming that there is a correlation between the amount of clouds during the day and the amount of clouds at night.
Up until the last few days of the month I kept telling people that although it felt like a really wet month the total precipitation was about average. I think that the fact there were 18 days when we had at least a little bit of rain made it seem wetter than it really was. However, on the 28th my theory was thrown out the window as we got an amazing 28.0 mm of rain putting us well above the average.
The 106.4 mm of rain we got this month made it the wettest June in the 10 year history of the UW weather station. Another wet month means that the total precipitation for the year (486.5 mm) is still well above the average for this time of year (416.1 mm).
Environment Canada prediction of temperature for the month: Above average
Actual Temperature: Above average
Summary for June 2008:
Maximum Temperature 30.4 °C
Minimum Temperature 8.3 °C
Average Daily High Temperature 23.2 °C (Long term average 23.5 °C)
Average Daily Low Temperature 14.1 °C (Long term average 11.2 °C)
Total Precipitation 106.4 mm (Long term average 80.0 mm)
(Long term averages based on 1970-2000 data for the Waterloo Wellington Airport)
Click on the image below to see the monthly chart:

Saturday, June 28, 2008
Early morning thunder
Was anybody else in Uptown Waterloo woken up at 4:30 am on Saturday morning by a particularly loud crack of thunder?
Saturday, June 21, 2008
Spring 2008 Summary
A very average spring
Although we had a good stretch of warm temperatures at the end of April and some more at the beginning of June, these were offset by generally cooler temperatures during the rest of the spring. In the end the daily high temperatures were about 0.5 degrees lower than average and the daily low temperatures were about 0.5 degrees higher than average, thus overall it was bang on the average.
After the very wet winter, the spring was on the low side of average coming in at 182.8 mm compared to an average of 220.9 mm. There was an 11 day stretch in April and a 7 day period in May without any precipitation, but apart from those the rest of the spring was pretty consistent.
Summary for Spring 2008:
Maximum Temperature 30.4 °C
Minimum Temperature -14.0 °C
Average Daily High Temperature 15.2 °C (Long term average 15.6 °C)
Average Daily Low Temperature 4.6 °C (Long term average 4.2 °C)
Total Precipitation 182.8 mm (Long term average 220.9 mm)
(Long term averages based on 1970-2000 data for the Waterloo Wellington Airport)
Click on the image below to see the monthly chart:
Wednesday, June 18, 2008
Talking about the weather June 18, 2008
Listen to Carlos Benevides and myself talk on DAVE-FM about the wet weather so far in June and what's ahead in both the short and long term.
Listen to the interview
See Carlos' blog and his countdown to the first day of summer
Listen to the interview
See Carlos' blog and his countdown to the first day of summer
Many days with rain so far in June
The good news is that we haven't had to do much watering in the garden lately.
The bad news is that is has rained on 13 of the first 18 days of June, while typically we only get about 12 days of rain for the entire month.
However the actual total amount of rain so far is running at about average.
The bad news is that is has rained on 13 of the first 18 days of June, while typically we only get about 12 days of rain for the entire month.
However the actual total amount of rain so far is running at about average.
Sunday, June 15, 2008
Big temperature drop
In the 15 minutes between 5:30 pm and 5:45 pm on Sunday the temperature went down by 4.5°C.
That is a pretty big drop, but it doesn't match the UW weather station record which is 5.7°C on June 8th, 2007.
That is a pretty big drop, but it doesn't match the UW weather station record which is 5.7°C on June 8th, 2007.
Sunday, June 1, 2008
May 2008 Summary
A cold May with just barely average precipitation
It was a cold month, almost 2 degrees below average, with only 7 of the days warmer than average. However, apart from a stretch between the 18th and the 23rd where we had significantly below average temperatures the rest of the month wasn't that far off the average.
We also went for a month without a day over 20 degrees after that great week at the end of April, this combined with the amount of snow we had linger into the spring makes me think that people are desperate to see some more warmer temperatures.
The last recorded below zero temperature occurred at 7:15 am on the morning of May 1st, this is early as the frost free date is typically about a week later. However even in the 10 year history of UW weather station it has happened in late April so it isn't a record or anything.
Thus far this year has been a real mixed bag for temperature: 2 months significantly above average (January, April), 2 significantly below average (March, May), and one in the average range (February).
It started out as a wet month with 47 mm falling in the first half, however it didn't keep up that pace as we only saw 12 mm in the second half. In the end our total precipitation for the month was just barely enough to get into the average range.
We have had pretty consistent precipitation the last few months, while the total for the year (388.9 mm) is still above average for this time of year (340.2 mm).
Environment Canada prediction of temperature for the month: Average
Actual Temperature: Below average
Summary for May 2008:
Maximum Temperature 26.2 °C
Minimum Temperature -2.0 °C
Average Daily High Temperature 16.1 °C (Long term average 18.7 °C)
Average Daily Low Temperature 5.1 °C (Long term average 6.4 °C)
Total Precipitation 59.8 mm (Long term average 75.7 mm)
(Long term averages based on 1970-2000 data for the Waterloo Wellington Airport)
Click on the image below to see the monthly chart:
Wednesday, May 28, 2008
Not quite below zero
Our low temperature on the morning of Wednesday, May 28th was 0.014°C at 6:00 am, thus we just managed to stay above freezing.
However, remember that the temperature at the UW weather station is measured at 2 m above the ground (this is the worldwide standard). So your plants, that are most likely closer to the ground, may have some frost damage.
If you did inspect you annuals this morning and can report on the frost damage please leave a comment below.
At the Environment Canada weather station at the Waterloo-Wellington airport they reported a temperature of -1°C at 6:00 am meaning that there is going to be a 3 week difference in our calculations of the last frost day this year.
Monday, May 26, 2008
Warmest day of the year (so far)
Monday, May 26th was the warmest day of the year topping out at 26.2 °C.
Here are some of the other weather extremes we have seen so far in 2008:
The coldest day was -23.4°C on March 10th.
Largest one day temperature range was 23.3° on February 17th.
Smallest one day temperature range was 1.7° on March 19th.
The wettest day was 33.2 mm on January 9th.
Here are some of the other weather extremes we have seen so far in 2008:
The coldest day was -23.4°C on March 10th.
Largest one day temperature range was 23.3° on February 17th.
Smallest one day temperature range was 1.7° on March 19th.
The wettest day was 33.2 mm on January 9th.
Friday, May 23, 2008
Cold May so far.
So far May has been a pretty cold month with only 4 days warmer than average.
We also haven't seen a temperature above 20°C since April 25th, although we will probably get there this weekend.
We also haven't seen a temperature above 20°C since April 25th, although we will probably get there this weekend.
Wednesday, May 21, 2008
What does Queen Victoria have against us?
After another cold Victoria Day weekend people are wondering if there is any historical pattern that suggests the holiday is abnormally cold.
Well in the past 11 years the Victoria Day weekend has been the coldest weekend of the month 3 times, the warmest 4 times and somewhere in the middle the others. So that is pretty much what you would expect on average.
Something that does support the theory is that the past 10 months of May have been a 50/50 mix of above and below average temperatures for the month overall. However, only once has the average temperature over the Victoria Day long weekend been above the average temperature for that time of the month.
In the end I think that people just remember the really cold long weekends, for instance when it went below zero during 2002 and 2005. The temperature is probably also more memorable when you are directly experiencing it around a campfire or in a tent.
Wednesday, May 7, 2008
You can monitor the Arctic sea ice
Last year there was a lot of attention on the amount of sea ice in the Arctic, as it hit an all time low this past September.
You can see how this year's melt is progressing by checking out the National Snow and Ice Data Center's website that now gives daily updates to the ice conditions:
NSIDC website
(and a personal confession, maybe I'm a bit obsessed, but I do check the site at least once a day)
As a result of last year's melt, a lot of the ice that is present this year was only formed this past winter. This ice is called first-year ice and typically only about 30% of it makes through the next summer.
If the same melt rate occurs this year then the minimum ice pack will be below last year's record and may even lead to an ice-free north pole!
Thursday, May 1, 2008
April 2008 Summary
The warmest April since 1991 with below average precipitation
April was over 2 degrees warmer than average making it the warmest April we have seen in the 10 year history of the UW weather station. Going back even further, I could find one year (1991) that was tied with this year and had to go back even further (1968) before I found one that was warmer.
After a very cold March that left lots of snow on the ground at the beginning of April, the switch really turned on the 17th with 9 of the next 10 days reaching a high above 20 degrees.
When the temperature went above 20 on April 17th at 4:00 pm we could declare Kimi Noguchi the winner of this year's UW weather station contest, I also liked his reason for choosing that date: "Based on my statistical knowledge, among all the available choices, I chose this date and time". Congratulations also go out to Stephen Drew and Carrie Warner, the second and third place winners.
April was the first below average month for precipitation since October of last year. We only had 53.8 mm compared to the average of 76.9 mm and only 10 mm fell during the last half on the month.
Even with this dry month, the wet start of the year means that we are still above average for 2008 with 320.3 mm so far, compared to the 264.4 mm we would expect.
As the conditions don't seem to be there for any snow in the short or long term forecast let's call an end to the 2007-2008 snowfall season. Thus we ended up with 257.5 cm breaking the previous record snowfall season of 245.3 cm in 1923-1924.
Environment Canada prediction of temperature for the month: Below average
Actual Temperature: Above average
Summary for April 2008:
Maximum Temperature 24.0 °C
Minimum Temperature -6.6 °C
Average Daily High Temperature 14.1 °C
(Long term average 11.2 °C)
Average Daily Low Temperature 2.1 °C
(Long term average 0.4 °C)
Total Precipitation 53.8 mm
(Long term average 76.9 mm)
(Long term averages based on 1970-2000 data for the Waterloo Wellington Airport)

Sign up to get the monthly weather station summary by e-mail
Tuesday, April 29, 2008
Not summer yet
The temperatures these last couple of days show why you have to have patience and not plant those annuals when it goes over 20 in April.
In the last 10 years (I can say that now that the station is over 10 years old), the date of the last frost has varied between April 29th and May 21st.
Typically it happens during the first week of May.
In the last 10 years (I can say that now that the station is over 10 years old), the date of the last frost has varied between April 29th and May 21st.
Typically it happens during the first week of May.
UW Weather station blog
This blog was started as an offshoot of the observations about the weather that I regularly put on the UW weather station homepage. I wanted to have an archive of them as well as have a place where people can leave their comments on the things I write.
It would have been nice to set up a blog directly on the UW weather station website, but it would have been a lot of work and this site took about 10 minutes to set up.
Another bonus is that it has a built in XML feed so you can get updates directly to your RSS reader if you are interested in being notified when there is new post. See below for the XML feed.
We will see how it goes, hopefully it won't be too much of a burden to maintain.
For anyone who is not coming to this blog from the website, you can find out all about the UW weather station here: weather.uwaterloo.ca
Friday, March 7, 2008
Kitchener Waterloo all time record snowfall
Kitchener Waterloo all time record snowfall
What is the record snowfall in KW?
You would think that this would be an easy question, unfortunately there are three official Envrionment Canada measurement stations within in KW and they all give different results.
Here are the stations, along with when their years of operation, the season of maximum snowfall, and the amount of the maximum snowfall:
Waterloo-Wellington Airport
(1970-today)
1983-1984
221.6 cm
Waterloo WPCP
(1962-2000)
1983-1984
275.8 cm
Kitchener
(1915-1977)
1923-1924
245.3 cm
So on the surface it would seem that 275.8 cm is the record. However, I was a bit suspicious of the two Waterloo stations being so different and I did a bit of digging into the numbers.
If there had consistently been more snow at the WPCP station I could have lived with it. But the total winter snowfall from both of these stations is very close for 25 years except for that particular winter season. See the comparison here.
I then looked at the 83-84 season in detail and again the daily snowfall amounts at the two stations match very well throughout the entire winter except for the last two weeks of December when the WPCP station reports 87.6 cm compared to the Waterloo-Wellington airport that had 41.2 cm.
Here are the other nearby stations during December of 1983 showing the amount of snow in the final two weeks of December and in brackets the amount for all of December:
Waterloo-Wellington Airport - 41.2 (74.4)
Waterloo WPCP - 87.6 (122.9)
CAMBRIDGE GALT MOE - 71.0 (91.0)
CAMBRIDGE-STEWART - 74.0 (82.0)
Elmira - 46.0 (113.0)
Elora Research Station - 26.6 (52.8)
Preston - 36.6 (67.6)
PRESTON WPCP - 24.2 (51.8)
Roseville - 42.0 (77.0)
Based on all of this, we are officially rejecting the 275.8 cm reading from the Waterloo WPCP station and calling the record snowfall for Kitchener-Waterloo as the winter of 1923-1924 when we had 245.3 cm.
Subscribe to:
Posts (Atom)


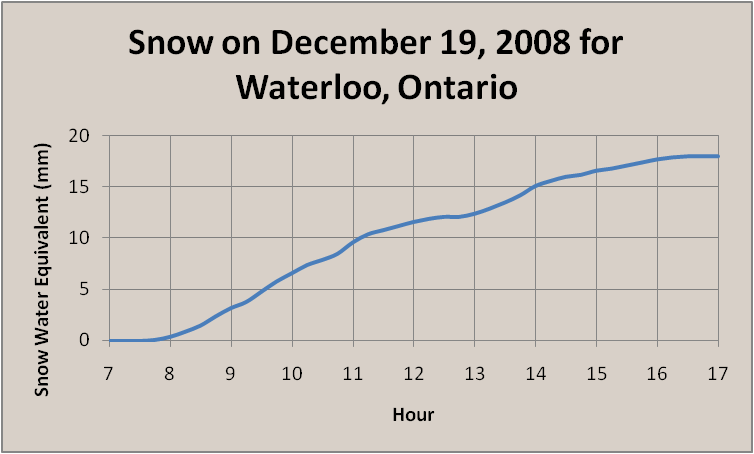