An average October for both temperature and precipitation
Although this was the coldest October in over 10 years, it was still only 0.1 degrees below the average, putting it well within the average range. This is because October has been one of the most above average months in the past decade, after both September and August.
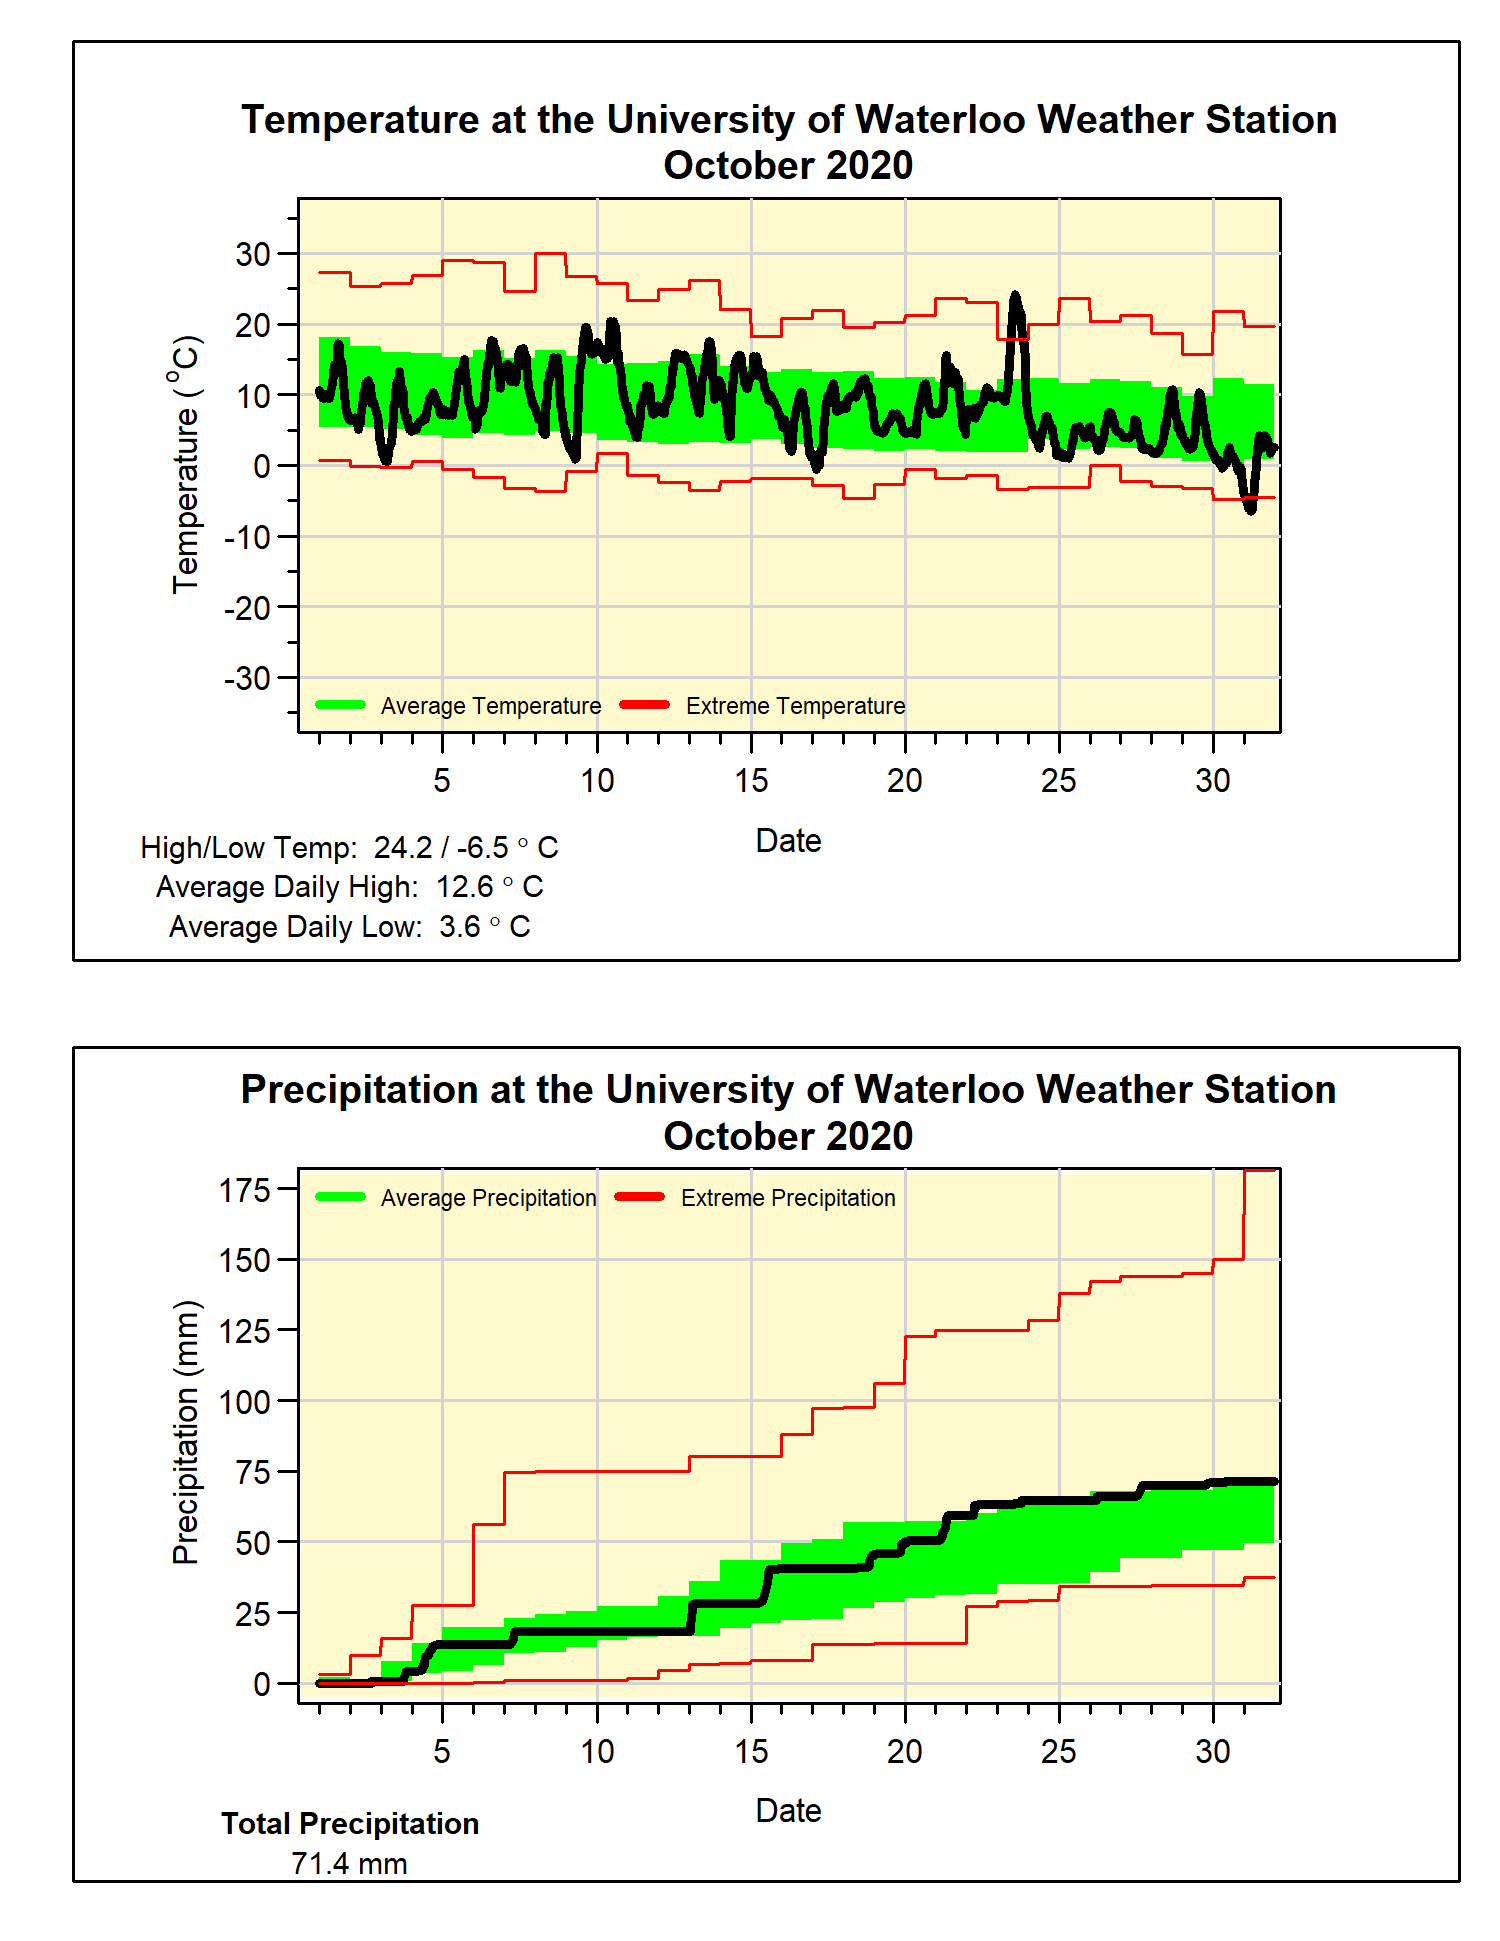
Looking at the graph, you can see just how much the high of 24.2°C on the 23rd was a blip compared to the rest of the month. As the average temperature goes down a lot between the beginning and end of the month, it is rare that the highest temperature would occur that late. In fact, that was the warmest day in the second half of October since 1968 when it was 24.4°C on the 17th.
The month started off with pretty average precipitation, got a bit wetter in the middle an ended off dry. The total was 71.4 mm, a bit above the average of 67.4 mm and just within the average range for the month.
Random fact: we have only had one October that was drier than average in the past 10 years.
This slightly above average month resulted in the total precipitation since January (825.1 mm) staying above the average for this time of year (750.6 mm).
Summary for October 2020:
Maximum Temperature 24.2°C
Minimum Temperature -6.5°C
Average Daily High Temperature 12.6°C (Long term average 13.5°C)
Average Daily Low Temperature 3.6°C (Long term average 2.9°C)
Total Precipitation 71.4 mm (Long term average 67.4 mm)
(Long term averages based on 1981-2010 data for the Waterloo-Wellington Airport)