A very warm fall that was also the wettest on record
The fall was over 2.5 degrees warmer than average, the heat was very consistent throughout the entire season except for a relatively cool week at the end of October. But even for that week it was only 3 or 4 degrees colder than average compared too many days that were more than 5 degrees warmer throughout the fall. However, as we have seen many warm falls in the recent past, we only have to go back to 2001 to find one that was hotter.
It was a very wet fall with 349.2 mm of total precipitation compared to the average of only 218.1 mm. This was the highest fall precipitation I could find, just beating out 1955 which had 339.5 mm.
There was only 5 cm of snow recorded this fall which is much less than the average of 30 cm. The fall of 1998 was the last time we have seen anything like this, as that year we only had 2 cm.
Summary for Fall 2011:
Maximum Temperature 26.7 °C
Minimum Temperature -9.7 °C
Average Daily High Temperature 10.7 °C (Long term average 8.3 °C)
Average Daily Low Temperature 2.5 °C (Long term average -0.5 °C)
Total Precipitation 349.2 mm (Long term average 218.1 mm)
(Long term averages based on 1970-2000 data for the Waterloo Wellington Airport)
Sign up to get the monthly weather station summary by e-mail
Friday, December 23, 2011
Tuesday, December 6, 2011
November 2011 Summary
The 5th warmest November on record that was also wetter than average
It was another warm month at an incredible 3.6 degrees higher than average. You have to go back to October of 2007 to find a month that was this much above average. As well, it was the warmest November since 2001 and the 5th warmest since records began in the region (the warmest was 1931 at 4.3 degrees above average).
Up until the last couple of days of the month it was looking like a dry month, however an amazing 51 mm on the 29th put us in the above average range. The final total was 106.6 mm compared to an average of 82.3 mm.
There has now been 1047.6 mm of precipitation this year, well over the average of 932.9 mm and the third most ever recorded for the end of November. However, we will have to get over 140 mm in December to beat the all time annual record.
Summary for November 2011:
Maximum Temperature 17.7°C
Minimum Temperature -4.6°C
Average Daily High Temperature 9.8°C (Long term average 5.6°C)
Average Daily Low Temperature 1.6°C (Long term average -1.6°C)
Total Precipitation 106.6 mm (Long term average 82.3 mm)
(Long term averages based on 1971-2000 data for the Waterloo Wellington Airport)
Monday, October 24, 2011
Longest frost free season ever seen
On the morning of October 23rd at 4:45 am the temperature went below zero for the first time since the spring. It stayed below zero for almost 4 hours with the lowest temperature being -0.9°C.
The bigger news is that by my calculations the frost free season went from May 1st to October 22nd this year which is a total of 175 days. This is the longest frost free season I have been able to find since records began in the region in 1915. This year just beat out 1941 when they had a stretch of 174 days above zero.
For full disclosure I just want to mention that there isn't enough data for 1937 and 1938 to be included in the analysis.
Thursday, October 20, 2011
Wettest day in over a year
The 51.6 mm of rain in the 24 hours between 8 am on the 19th and 20th was the single wettest day we have had since July 23rd, 2010 when we had 62.5 mm.
Thursday, October 6, 2011
September 2011 Summary
Another hot month with average precipitation
With an average temperature that was 1.8 degrees above average, September was the third hotter than average month in a row. But it certainly wasn't consistent warm as the month was a battle between the cold arctic air masses and hotter air from the south. As a result we saw some drastic temperature changes such as a high of 30.5 C on the third and then a high of only 15.5 C two days later.
The precipitation for September was within the average range (95.3 mm compared to an average of 87.5 mm) even though there were 17 days with some measured precipitation, which is more than the average of 12. There were a couple of days with over 20 mm (the 19th and 27th) while the rest of it was was spread over many days with a bit of precipitation here and there.
The total precipitation at the end of September is 799.3 mm, which is still above the average of 680.7 mm for the end of the month.
Summary for September 2011:
Maximum Temperature 30.5°C
Minimum Temperature 3.5°C
Average Daily High Temperature 20.8°C (Long term average 20.0°C)
Average Daily Low Temperature 11.1°C (Long term average 8.3°C)
Total Precipitation 95.3 mm (Long term average 87.5 mm)
(Long term averages based on 1971-2000 data for the Waterloo Wellington Airport)
Tuesday, September 27, 2011
Summer 2011 Summary
A dry and hot Summer
The hottest July in over 50 years followed by a warm August and September resulted in a summer that was one and half degrees higher than average. The 35.7°C on July 21st was the highest temperature we had seen in over 10 years.
Although the last half the summer was more or less average for precipitation it didn't make up for the very dry start to the summer that included the 7th driest July seen in the region. The total precipitation was 208.9 mm compared to an average of 274.0 mm.
This year's summer poll ended with 49% in the great catergory, 25% good, 14% OK, 5% bad, 4% total washout. Although this summer was different than the last ones the results always seem to be same no matter what the weather.
Summary for Summer 2011:
Maximum Temperature 35.7°C
Minimum Temperature 3.5°C
Average Daily High Temperature 25.5°C (Long term average 24.2°C)
Average Daily Low Temperature 14.1°C (Long term average 12.2°C)
Total Precipitation 208.9 mm (Long term average 274.0 mm)
(Long term averages based on 1971-2000 data for the Waterloo Wellington Airport)
Tuesday, September 20, 2011
Summer 2011 poll
Let's see what everybody thought of this year's warm and dry summer.
The poll is located at the top of the UW weather station blog.
The poll is located at the top of the UW weather station blog.
Saturday, September 17, 2011
August 2011 Summary
Another hot month with average precipitation
Another hot month coming in at 1.5 degrees warmer than average (the last time we had a colder than average one was back in March). The warmth was pretty consistent with lots of days where the highs were over 24°C but it never got over 30°C.
It was a pretty typical August in terms of precipitation, we got 79.7 mm which is within the average range for the month. There were a couple of big days when we were hit by typical August convective storms like the 31.4 mm on the 9th or the 17.9 mm on the 14th. After two dry months I think everyone's lawns and gardens will agree that this month made it a lot easier to survive.
The total precipitation for the year of 704.0 mm is still above the average for the end of August (596.0 mm).
Summary for August 2011:
Maximum Temperature 29.3°C
Minimum Temperature 11.3°C
Average Daily High Temperature 25.8°C (Long term average 24.7°C)
Average Daily Low Temperature 14.6°C (Long term average 12.6°C)
Total Precipitation 79.7 mm (Long term average 87.5 mm)
(Long term averages based on 1971-2000 data for the Waterloo Wellington Airport)
Thursday, September 15, 2011
Cold tonight
With a forecast low of 1, we might see the lowest temperature since early May overnight.
PS Hopefully the August summary will be available soon, it is being worked on.
PS Hopefully the August summary will be available soon, it is being worked on.
Monday, August 1, 2011
July 2011 Summary
**Note that as a result of an incident of vandalism at the UW weather station this month, the temperature used for this summary is based on data from the Waterloo-Wellington Airport**
The hottest July in over 50 years that was also very dry
Do I really have to tell anyone that it was hot this month? I guess the question was how hot it was historically. First off, it was over 2 degrees above average overall for the month with 11 days above 30 and an average daytime high of 29.4°C. I had to go back to 1955 to find a hotter July (which had a scorching daily average high of 32.2°C) and overall the month was tied for the 6th warmest that has ever been recorded in the area.
The 35.7°C on the 21st was the highest temperature we have seen since August 8th, 2001 when it was 36.5°C.
Going along with the hot weather was the lack of rain, up until the last couple of days of the month it looked like it might be the second driest ever recorded (it would have been hard to beat the paltry 1.8 mm recorded in 1916). However, a couple of storms right at the end of July got us up to 22.3 mm and as there will a lot of months around with around 20 mm, this year ended up as the 7th driest in the region since records began in 1914.
This dry month means that the total for the year (624.3 mm) is creeping slowly closer to the average (509.0 mm). It was the second wettest first 6 months of the year, but now it is only the 9th wettest first 7 months of the year.
Summary for July 2011:
Maximum Temperature 35.7°C
Minimum Temperature 6.9°C
Average Daily High Temperature 29.4°C (Long term average 26.0°C)
Average Daily Low Temperature 14.9°C (Long term average 13.8°C)
Total Precipitation 23.2 mm (Long term average 92.9 mm)
(Long term averages based on 1971-2000 data for the Waterloo Wellington Airport)
Wednesday, July 27, 2011
Very dry July
Although we are scheduled to get some rain tonight and over the next few days it still looks like it may be one of the driest July every recorded in the area.
As of the 27th we have only had about 3.5 mm for the month, this is more than the incredibly dry July of 1916 when we only had 1.8 mm. To get second we have to have less than the 19.8 mm seen in 1919.
As of the 27th we have only had about 3.5 mm for the month, this is more than the incredibly dry July of 1916 when we only had 1.8 mm. To get second we have to have less than the 19.8 mm seen in 1919.
Tuesday, July 26, 2011
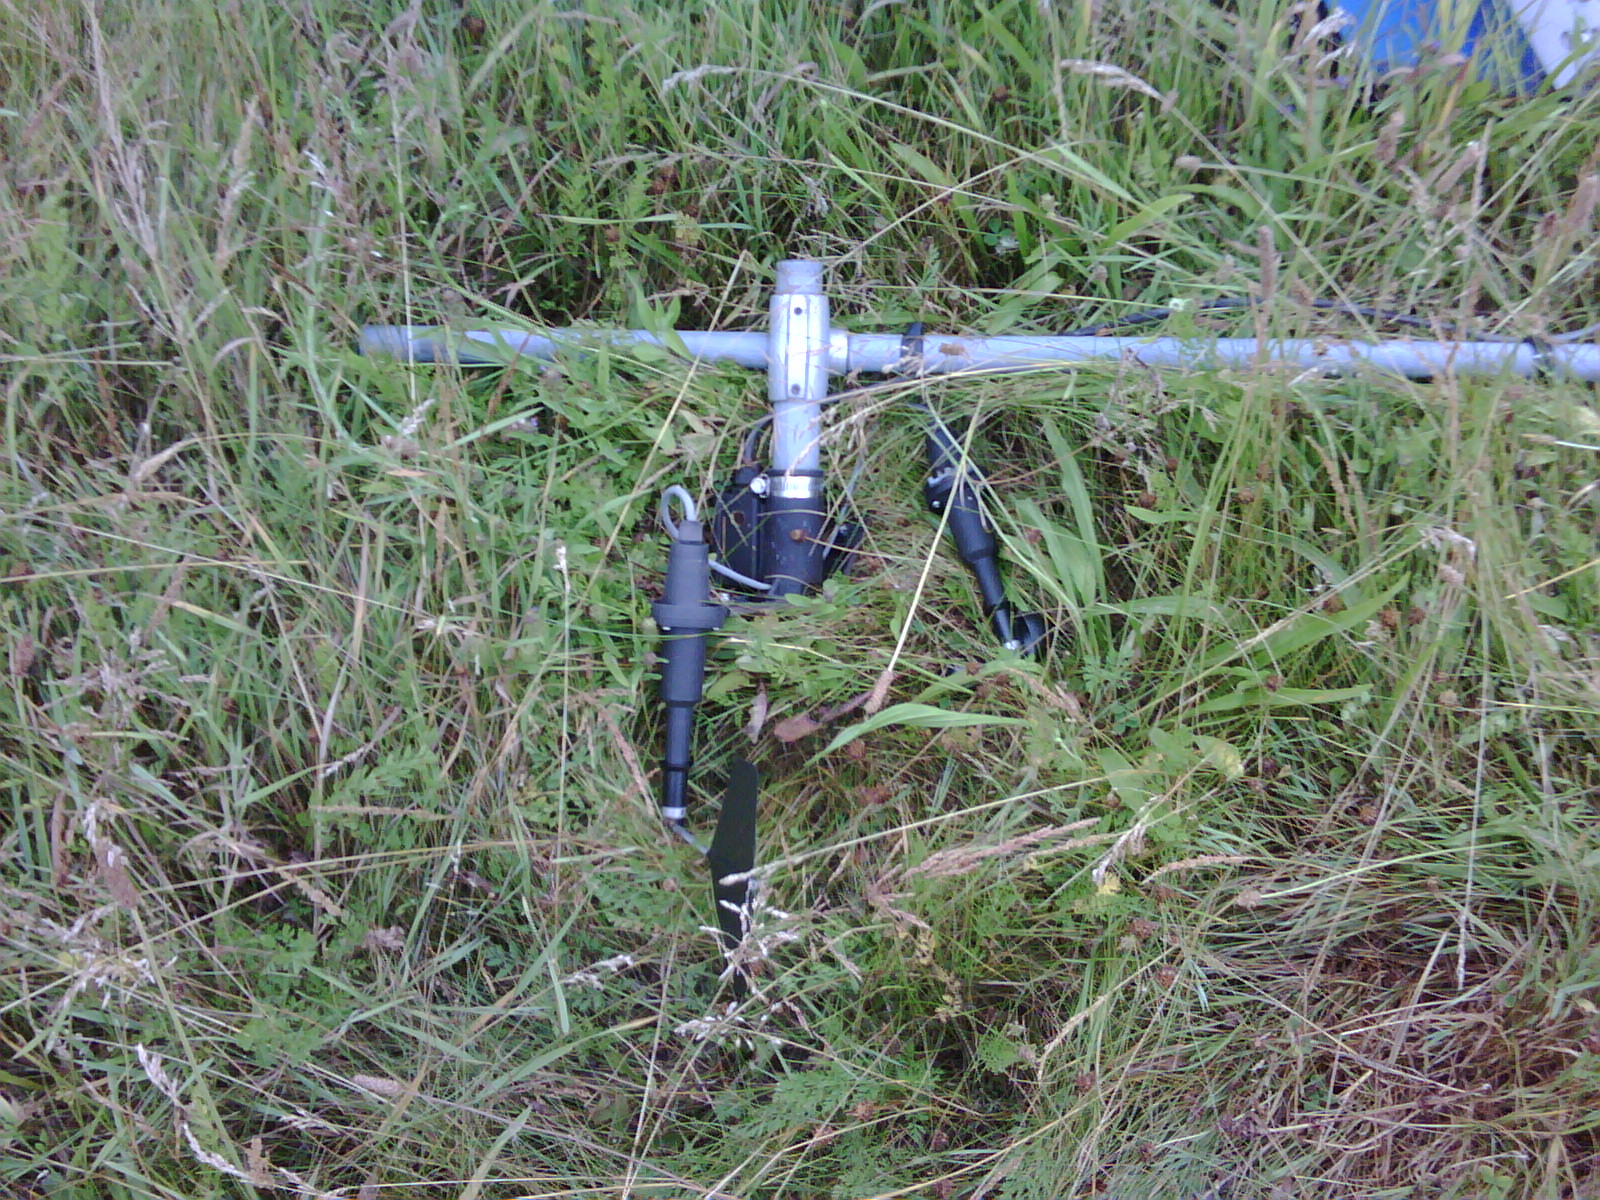
Weather Station Damaged
Now that all the reports have been filed I can reveal that the reason the weather station has been giving us strange readings is that the station was vandalized during the evening of July 16th. The fenced off area containing the station was entered and main tower was pulled down:

We were lucky that the battery had enough power to keep the station going for the days when the solar panel was facing the ground and not charging.
It was very bad timing as during the week when we had the hottest temperatures in the past many years we were not able to get an accurate reading. This was because the temperature sensor was on its side and thus was getting hit with direct solar radiation after about noon. This caused the temperature to spike up much higher than it would have been "in the shade".
Here is the reason that the wind speed was zero:

The good news is that the station is pretty much back up, except for some quick fixes to the anemometers which will have to be replaced eventually.
Let's hope this is the one and only time I'll have to deliver news like this.

We were lucky that the battery had enough power to keep the station going for the days when the solar panel was facing the ground and not charging.
It was very bad timing as during the week when we had the hottest temperatures in the past many years we were not able to get an accurate reading. This was because the temperature sensor was on its side and thus was getting hit with direct solar radiation after about noon. This caused the temperature to spike up much higher than it would have been "in the shade".
Here is the reason that the wind speed was zero:
The good news is that the station is pretty much back up, except for some quick fixes to the anemometers which will have to be replaced eventually.
Let's hope this is the one and only time I'll have to deliver news like this.
Tuesday, July 19, 2011
Equipment Problems
As many people have noticed the temperature sensor is giving unrealistic readings during these days of very high temperatures.
We are working at trying to fix the problem.
We are working at trying to fix the problem.
Sunday, July 3, 2011
June 2011 Summary
Average temperatures for June and the first dry month of the year
Nothing too spectacular about the temperature in June, a few hot days at the beginning and a few cool days after that made for overall temperature that was just 0.3 degrees warmer than what we would expect putting it within the average range.
For the first time this year it was a drier than average month. Although it wasn’t drier by much as we had 60.4 mm and the average range starts at 64 mm. There was only one really wet day of the month, the 22nd when 28.2 mm fell, and there was a dry stretch from the 9th to the 20th.
Even with the relatively dry month, we still had 602.0 mm for the first half of the year which is well above the average of 415.0 mm. This is the second wettest first half of the year in the area since records began back in 1914. Only in 1947 was it wetter when 624.8 mm was recorded from January to June.
Summary for June 2011:
Maximum Temperature 32.0°C
Minimum Temperature 5.6°C
Average Daily High Temperature 23.2°C (Long term average 23.6°C)
Average Daily Low Temperature 12.2°C (Long term average 11.3°C)
Total Precipitation 60.4 mm (Long term average 80.0 mm)
(Long term averages based on 1971-2000 data for the Waterloo Wellington Airport)

Sign up to get the monthly weather station summary by e-mail
Saturday, June 25, 2011
Spring 2011 Summary
A very wet Spring with average temperatures
Apart from a cold start to the Spring it was actually pretty close to average for most of the season. The overall temperature was only slightly (0.2 degrees) lower than average. However, just looking at the daytime highs it was about a full degree less than average which is the coldest since 2003.
It was a very wet Spring with 338.2 mm of precipitation compared to the average of 219.5 mm. But this is not a record as we had 342.2 mm back in 1997 (that year saw over 100 mm during the first three weeks of June).
Summary for Spring 2011:
Maximum Temperature 32.0 °C
Minimum Temperature -17.5 °C
Average Daily High Temperature 14.9 °C (Long term average 15.9 °C)
Average Daily Low Temperature 5.0 °C (Long term average 4.4 °C)
Total Precipitation 338.2 mm (Long term average 219.5 mm)
(Long term averages based on 1971-2000 data for the Waterloo Wellington Airport)

Sign up to get the monthly weather station summary by e-mail
Wednesday, June 22, 2011
Quite an hour
Between 9:15 and 10:15 pm on Wednesday, June 22 the temperature dropped 6.5 degrees and we got 21 mm of precipitation.
Saturday, June 18, 2011
We are number one!
From my friend Rob Kuhn:
At 3 pm on Saturday, June 18th, Kitchener-Waterloo was the warmest place in Canada at 28.0°C
At 3 pm on Saturday, June 18th, Kitchener-Waterloo was the warmest place in Canada at 28.0°C
Wednesday, June 1, 2011
May 2011 Summary
The fifth wettest May on record, above average overall temperature, and the wettest ever start to the year
First off, how about that warm May! Hard to believe I know, but the daily low temperatures were a whopping 2.9 degrees above average for the month, this more than offset the daily highs that were 0.7 degrees below average. This means it was a little more than 1 degree above average overall for the month.
But of course people are going to remember the 4th when the high was only 7.0°C (the coldest daytime high in May since May 3rd, 2005) and the 16th when it only got up to 8.3°C.
One reason for the warmer than average nights was the amount of cloud cover we had during the month and the 17 days with some precipitation compared to an average of only 12, leading to...
The fifth wettest May since records began in the area at 150.3 mm, this actually ties us with May of 2000, but not close to the record back in 1956 when we had 202.2 mm. Just like April the first half of the month was very dry and it was the second half that put us well above average.
With the total precipitation for the year at 541.6 mm, not only is it well above the average (337.7) but it also way above the record which was 488.5 mm back in 1943.
Looking back now, it looks like April 30th will be the last frost day of the spring which is the earliest last frost date since 1999 when it was April 29th.
Summary for May 2011:
Maximum Temperature 31.1°C
Minimum Temperature 1.6°C
Average Daily High Temperature 18.2°C (Long term average 18.9°C)
Average Daily Low Temperature 9.4°C (Long term average 6.6°C)
Total Precipitation 150.3 mm (Long term average 75.7 mm)
(Long term averages based on 1971-2000 data for the Waterloo Wellington Airport)

Sign up to get the monthly weather station summary by e-mail
Wednesday, May 25, 2011
Shot of rain on Victoria Day
On the Monday of the Victoria Day weekend between 6:30 and 6:45 pm we got 14.5 mm of rain.
It is not a record for 15 minute precipitation at the University of Waterloo Weather Station (that was last year on July 23rd with 18.1 mm), but it very well could be the highest for this year.
It is not a record for 15 minute precipitation at the University of Waterloo Weather Station (that was last year on July 23rd with 18.1 mm), but it very well could be the highest for this year.
Friday, May 20, 2011
Victoria Day Weekends
It seems that a lot of people think that Victoria Day weekend is always a particularly bad weather weekend. I have even written a blog entry on the subject here:
http://uwweatherstation.blogspot.com/2008/05/what-does-queen-victoria-have-against.html
This time let's look at precipitation, first off on average it rains about 1/3 of the days of May. So we would expect that on average it should rain one of the days of a 3 day long weekend. Over the past 12 years the breakdown of days with rain is as follows: 0 - 15%, 1 - 55%, 2-15%, 3-15%. I'm not sure of the actual probability distribution of such a series, but it seems pretty well what we would expect. It is also hard to make many conclusions with such a small sample.
Also interesting is that compared to other weekends (Sat, Sun, Mon) in May there is actually a better chance for 1 day or less of rain during the Victoria Day weekend. Or put another way there has been a greater chance for 2 or more days of rain during the other weekends of the month in the past 12 years.
And an update on temperatures during the Victoria Day holiday weekend, looking back at the last 12 of them (ie. the time the UW weather station has been around), it is true that about two-thirds have been colder than average. Random chance suggests we should be closer to 50/50. The forecast for this weekend looks like it might be the warmest in quite some time.
As I said in the last post about this topic, it is always the Victoria Day weekends that are really cold or wet that people seem to remember. Hopefully everyone can enjoy this weekend no matter what the weather.
Friday, May 13, 2011
Hottest day so far this year
When it got up to 26.4°C on Friday it was the hottest it has been so far this year. But that looks to be the last of the warm temperatures until the middle of next week.
Sunday, May 1, 2011
April 2011 Summary
The wettest April ever recorded
It may be surprising to some, but it worked out to be an average month for temperature. Overall it was actually 0.1 degrees above average, however as often happens the daytime highs were half a degree below average while the night time lows were about half a degree above. As people will naturally tend to notice the high temperature of the day, the feedback I got from people was that they were expecting it to be a colder than average month.
Although we had a stretch of 8 days where it didn’t go above 10°C, this was offset by a couple of warm days at the beginning of the month (including the 10th when the UW weather station contest was decided – congratulations to Janie Simpson on winning) and a few more warm days near the end.
Another thing that might have put people in a bad mood about the weather was the amount of precipitation. It turns out that the month of April was the wettest since records began in the area in 1914 with 136.5 mm coming down, this just barely beat 1921 when there was 135.9 mm.
Even more shocking is that on the 15th the total for the month was actually a bit below average at only 29.2 mm. But then storm after storm seemed to hit us with four days in the last half of April that recorded more than 15 mm, propelling us to the record breaking total.
Another wet month means that the amount of precipitation that we have seen for the year (391.4 mm) is very much above average for the end of April (264.4 mm). This is now the second wettest first 4 months of the year, just barely behind 1954 when we had 401.3 mm at this point.
The final total for the snowfall season of 2010/2011 was 177 cm compared to the average of 159.5 cm, it came down to the wire with the last real storm of the season on March 23/24 putting us above the average.
Summary for April 2011:
Maximum Temperature 22.3°C
Minimum Temperature -3.6°C
Average Daily High Temperature 10.9°C (Long term average 11.4°C)
Average Daily Low Temperature 1.3°C (Long term average 0.6°C)
Total Precipitation 136.5 mm (Long term average 76.9 mm)
(Long term averages based on 1971-2000 data for the Waterloo Wellington Airport)

Sign up to get the monthly weather station summary by e-mail
Monday, April 25, 2011
Final numbers on the 2010-2011 snowfall season
Well I don't want to jinx it, but I think we can finally call an end to the 2010-2011 snowfall season.
The final total was 177 cm compared to the average of 159.5 cm, it came down to the wire as the last real storm of the season on March 23/24 was what put us above the average.
From the graph (see below) you can see why I called it a "back end loaded" snowfall season. We were well below average until late January and then the switch got turned and we got storm after storm until mid-March.
The reason for this was that a zone of high pressure set up over Quebec during the fall and stayed around until late January. This meant that the jet stream was pushed further south and thus most of the storms were also deflected south of the Great Lakes. This pattern broke down in February and we returned to a more typical La Nina winter pattern with the jet stream coming over the Great Lakes. As storms are often carried along the jet stream it meant a lot more precipitation for us.
This pattern has continued on with what has been a pretty wet spring so far (and more rain in the forecast).
I also want to give a big thanks to my snow measurement volunteers: Melinda, Eric, and Jayson who helped gather the data during this year's snowfall season!
Sunday, April 10, 2011
2011 UW weather station contest ends!
Wow! I don't know if it has ever gone over 20 that fast before, it was only 11C out 2 hours before it went over 20C.
This year's winner is:
Janie Simpson
who correctly chose a time of 3:30 pm on April 10th as the first time the temperature at the UW weather station would go above 20C.
In second place we have:
Annarita Superina
Thanks to all 907 people who entered the contest, we hope you had fun with it and will enter again next year.
As well as taking home some cool prizes, the winners will also become members of the Waterloo Weather Station Contest Hall of Fame.
Thursday, April 7, 2011
Could the 2011 contest end this weekend?
The first above 20 degree temperatures are forecasted for this weekend.
Sunday, April 3, 2011
March 2011 summary
A cold March that was the wettest in almost 35 years
It was looking like an average month for temperature, but a very cold and clear last week put us 1.3 degrees below average. On some of these very cold days, the high temperature did not go above the average low temperature for the day.
The big story of the month was the 136.6 mm of total precipitation, this was almost twice the average of 70.6 mm and the wettest March since 1976 when we had 148.3 mm. There were two days with over 25 mm and three days in a row with over 15 mm. What
made it an even more astonishing total was that the last week of the month was dry.
With the biggest one day snowfall (26 cm) in three years happening on the 24th, it is not surprising that the month’s total snowfall of 50 cm was twice as much as the average of 24 cm.
This wet month put the amount of precipitation that we have seen for the year (254.8
mm), very much above average for the end of March (187.6 mm).
Summary for March 2011:
Maximum Temperature 13.6°C
Minimum Temperature -17.5°C
Average Daily High Temperature 2.4°C (Long term average 3.5°C)
Average Daily Low Temperature -7.1°C (Long term average -5.6°C)
Total Precipitation 136.6 mm (Long term average 70.6 mm)
(Long term averages based on 1971-2000 data for the Waterloo Wellington Airport)

Sign up to get the monthly weather station summary by e-mail
Wednesday, March 23, 2011
Spring 2011 snowstorm
We had a total of 26 cm from the storm on March 23rd.
This is the highest single day snowfall since March 9, 2007.
The total snowfall this season of 175 cm is now above the average of 160 cm.
If you are seeing this on Wednesday night you might want to get to shoveling as there is a very wet layer under the snow. Once that layer freezes it looks like it won't melt until late next week.
Monday, March 21, 2011
Winter 2010/2011 summary
A winter that was a bit colder and wetter than average
Overall the temperature was 0.6 degrees colder than average this winter, making it the coldest since 2005, but still within the average range. I think one reason it didn’t feel like a very cold winter was that it was never really cold for more than a few days in a row and the rest of the time it was just a few degrees below average. We also didn’t really see a mid-winter thaw, as between January 1st and February 13th it only went above zero for a single day.
For most of the winter the precipitation was very low, it wasn’t until late February that some very wet days put us back into the average range. The total precipitation was 220.4 mm compared to the average of 184.5 mm. This is almost double last year’s total of 113.2 mm, but not as much as the two years before that.
As always, it is hard to separate the snow during just the winter as opposed to the entire snowfall season. But, for just the winter we saw about 116 cm of snow compared to the average of 103 cm. However, it was really the 74 cm that came down in February that put us over the top.
Summary for Winter 2010/2011:
Maximum Temperature 13.6°C
Minimum Temperature -28.8°C
Average Daily High Temperature -1.8°C (Long term average -1.4°C)
Average Daily Low Temperature -10.6°C (Long term average -9.8°C)
Total Precipitation 220.4 mm (Long term average 184.5 mm)
(Long term averages based on 1971-2000 data for the Waterloo Wellington Airport)
Sign up to get the monthly weather station summary by e-mail
Sunday, March 6, 2011
February 2011 summary
A month where both the temperature and precipitation were just within the average range
There were lots of dramatic temperature swings during the month with 20+ degree differences between the high and lows for a day commonplace. Although the temperature danced above and below average, overall the month was 0.7 degrees colder. However it is still considered an average month for temperature as it was within the average range.
The first week of the month had lots of precipitation and then it was then pretty dry until some rain on the last day. However, even though the total precipitation was 63.4 mm compared to the average of 51.3 mm, it was still (just barely) within the average range.
For the year so far, the amount of precipitation that we have seen (118.3 mm) is very close to the average at this time (115.7 mm).
It really has been a back-end loaded winter this year for snow as between October 1st and January 31st we had 71 cm of snow, but in February alone we had 56 cm. This is close to double to average snow in February of 30.6 cm.
Summary for February 2011:
Maximum Temperature 9.3°C
Minimum Temperature -23.4°C
Average Daily High Temperature -2.1°C (Long term average -1.9°C)
Average Daily Low Temperature -11.7°C (Long term average -10.5°C)
Total Precipitation 63.4 mm (Long term average 51.3 mm)
(Long term averages based on 1971-2000 data for the Waterloo Wellington Airport)
Sign up to get the monthly weather station summary by e-mail
Thursday, February 24, 2011
The 2011 Weather Station contest has started!
It is that time of year again, time to put in your guess as to when the temperature will first go above 20.
Get all the details and enter the contest here.
Get all the details and enter the contest here.
Friday, February 18, 2011
Finally above zero
When the temperature when above zero on February 13th it broke a streak of 42 days of below zero temperatures.
Thursday, February 17, 2011
Warmest day since the new year
If the forecasted high of 8°C comes to pass today, it would be the warmest day since January 1st.
Friday, February 11, 2011
Last cold day for a while?
There is definitely a change coming, after Friday where the low dipped to -23.4°C in the morning, it looks like the temperature is going to slowly going to go up and up. It might not go down again till sometime on Sunday (maybe even Sunday evening).
And it's not just the short term that sees higher temperatures, with some forecasted highs of 6 in middle of next week.
After that, the medium range forecasts have it staying either at or a bit above average into mid-March. Thus I'll be bold and predict that today is going to be the coldest day we see until the fall.
Thursday, February 3, 2011
January 2011 Summary
The second colder than average month in a row with average precipitation
Unlike December, where we didn’t see any really cold temperatures, we had four days where it went below -20°C at night. This combined with many days that were a few degrees colder than average, put us as a little more than 2 degrees below average for the month. This was the first time since mid-2009 when we have had 2 below average months in a row.
On the 23rd, the high temperature during the day of -16.6°C was the coldest daytime high since January 15th of 2004 when it only got up to -17.8°C.
The month started out wet with lots of rain on the first, but it calmed down after that and the 54.8 mm of total precipitation was within the average range for the month.
The 42 cm of snow that came down during January was very close to the long term average of 43.5 cm. The largest single day was the 9.5 cm that fell during the 11th.
Summary for January 2011:
Maximum Temperature 10.1°C
Minimum Temperature -28.8 °C
Average Daily High Temperature -4.8 °C (Long term average -3.1 °C)
Average Daily Low Temperature -13.6°C (Long term average -11.1 °C)
Total Precipitation 54.8 mm (Long term average 64.4 mm)
(Long term averages based on 1971-2000 data for the Waterloo Wellington Airport)
Sign up to get the monthly weather station summary by e-mail
Groundhog Day storm final total
In the end we got 16.5 cm of snow at the UW weather station in total over the two days of the Groundhog Day storm. Not quite as much as forecasted as it seemed that most of the heavy snow went to the south hitting the Hamilton region.
As forecasted the storm also lost a lot of its power after hitting Chicago and didn't produce the snow amounts here as it did there.
As forecasted the storm also lost a lot of its power after hitting Chicago and didn't produce the snow amounts here as it did there.
Tuesday, February 1, 2011
Stories from the storm
I'm interested in hearing your stories about this storm, leave a comment with your experiences so far.
Groundhog Day storm of 2011
So once the snow starts on Tuesday night it doesn't look like it will stop until very late Wednesday or even Thursday. Although the heaviest part will probably be around sunrise, it now looks like we might get hit by a wrap around arm of the storm during the afternoon which might add another 10 cm to whatever already have at that point.
I'm interested in hearing about people's predictions and stories about the storm.
So on this post I encourage you to leave a comment saying how much total snow we will recieve between Tuesday night and Wednesday evening, ie. what will be the sum of the readings from Wednesday and Thursday morning at the UW weather station website.
I'll have another post where you can post any stories about the storm.
Friday, January 28, 2011
Temperature Change
At 7:45 am on Monday, January 24th it was -28.2°C and 24 hours later at 7:45 am on Tuesday, January 25th it was -3.1°C.
In some places in the world they don't see that kind of temperature difference during the year.
In some places in the world they don't see that kind of temperature difference during the year.
Friday, January 21, 2011
A very cold day forecasted on Sunday
Environment Canada is forecasting a high of only -17 C on Sunday. If this were to happen it would be the coldest high temperature for any day since January 19th, 1994 when the high was a very frigid -21.3 C.
Thursday, January 20, 2011
Cold start to the year
So far the first 20 days of the year have been about a degree colder than average, continuing the trend we saw in December.
This could mean will see the first two colder than average months in a row since the middle of 2009.
This could mean will see the first two colder than average months in a row since the middle of 2009.
Wednesday, January 12, 2011
Storm snow total
We had about 12 cm of snow from Tuesday afternoon until Wednesday morning during the big storm that came across our area.
Monday, January 3, 2011
2010 Summary
The big weather story for the year in the region were the consistent warm temperatures that lead to 2010 coming in as the 5th warmest year ever at 1.4 degrees above average. Eleven of the 12 months were higher than average with December being the only colder than average month.
The year didn’t start out spectacularly warm with both January and February being just slightly above average. However March was the warmest since 2000 and the 6th warmest since records began and April was the warmest since 1955 and the 4th warmest in the region. Only 11 of the 61 days of those months were colder than average.
After a cold streak to start the month of May, it wasn’t until late October that there was another extended period of cold temperatures. But what was interesting was that that apart from a warm week early in July and one late in August the rest of the summer was consistently just a few degrees above average. November again was above average and it wasn’t until December that we had the only below average month of the year.
There were 11 days over 30 degrees during the year, higher than the average of 7 and much higher than the single day over 30 in 2009 and the 2 days in 2008. Even with the vast difference in the last 3 summers, the “end of summer” polls in all those years have resulted in a similar number of people that considered the summer to be great or good: 74% in 2010, 66% in 2009, and 77% in 2008.
For precipitation, the year started off very dry with January being the driest since 1981 and fourth driest in the region since records began in 1914. The months that followed were also dry and by the end of May we only had about two thirds of the average precipitation. This was quickly offset by a very wet June (wettest in over 40 years) and July (wettest in over 15 years) that put us back into the average range.
August saw only a few days of rain, but before an extended drought could start September came in as the wettest single month since 1996 with three days having 30 or more mm of precipitation. Both October and November were average for precipitation while December only had about half of the average.
The final total was 879.3 mm which is close enough the average of 904.0 mm to say that for the second year in the row we had an average year of precipitation.
The most precipitation we saw on a single day was the 62.5 mm on July 23rd which was more than what fell during the entire months of January, February, March, August, or December. The 35 mm that we received that day between 7:45 am and 8:15 am was a 1 in 10 year precipitation event that caused some short term flooding in the area.
The 77.5 cm of snow we saw during the calendar year of 2010 was about half of the average of 159.5 cm. We didn’t get any measureable snow during March at the UW weather station and you have to back to 1946 to find another March like that.
Notable weather days of 2009:
January 27: The high temperature was only -4.1 °C breaking a streak of 14 days of above average temperatures.
March 26: The UW Weather Station blog predicts that the high temperature that day will be the lowest for at least the next 6 months. As it turns out it took until November 28th to see a colder day so it was actually over 8 months before a lower high was seen.
April 1: Thaigo Barolomei wins the UW Weather Station Contest with his guess of 1:00 pm.
May 3: Not really a weather event, but on this day at 5:15 am the UW Weather Station equipment experienced a major failure in the main logger unit. It would take until May 26th before the station was back in operation, resulting in by far the longest period of downtime for the station since operation began in February of 1998. We thank everybody for their patience during that difficult time.
July 5: The high temperature of 33.1 °C was the warmest temperature of the year and the highest since August 1, 2007. While the low temperature that evening was only 21.9°C, the warmest night since August 1, 2006.
July 15: As a big storm came through the area, the temperature dropped 4.3 degrees between 8:15 and 8:30 pm, the largest 15 minute temperature drop of the year.
July 23: A 1 in 10 year event between 7:45 am and 8:15 am saw 35.4 mm of precipitation fall and the day’s total of 62.5 mm was the single wettest day since July 11, 2008.
August 23: The high temperature was 2.4 degrees below average, breaking a streak of 2 weeks of above average temperatures.
September 2: More rain fell during a 24 hour period between the 2nd and the 3rd (51.9 mm) then during the entire month of August (36.2 mm).
October 13: The temperature dipped below zero for the first time since May 11, resulting in 155 frost free days for 2010. This was very close to the average number frost free days in the region which is 154.
Click on the image below to see the temperature chart:

Click on the image below to see the precipitation chart:

The year didn’t start out spectacularly warm with both January and February being just slightly above average. However March was the warmest since 2000 and the 6th warmest since records began and April was the warmest since 1955 and the 4th warmest in the region. Only 11 of the 61 days of those months were colder than average.
After a cold streak to start the month of May, it wasn’t until late October that there was another extended period of cold temperatures. But what was interesting was that that apart from a warm week early in July and one late in August the rest of the summer was consistently just a few degrees above average. November again was above average and it wasn’t until December that we had the only below average month of the year.
There were 11 days over 30 degrees during the year, higher than the average of 7 and much higher than the single day over 30 in 2009 and the 2 days in 2008. Even with the vast difference in the last 3 summers, the “end of summer” polls in all those years have resulted in a similar number of people that considered the summer to be great or good: 74% in 2010, 66% in 2009, and 77% in 2008.
For precipitation, the year started off very dry with January being the driest since 1981 and fourth driest in the region since records began in 1914. The months that followed were also dry and by the end of May we only had about two thirds of the average precipitation. This was quickly offset by a very wet June (wettest in over 40 years) and July (wettest in over 15 years) that put us back into the average range.
August saw only a few days of rain, but before an extended drought could start September came in as the wettest single month since 1996 with three days having 30 or more mm of precipitation. Both October and November were average for precipitation while December only had about half of the average.
The final total was 879.3 mm which is close enough the average of 904.0 mm to say that for the second year in the row we had an average year of precipitation.
The most precipitation we saw on a single day was the 62.5 mm on July 23rd which was more than what fell during the entire months of January, February, March, August, or December. The 35 mm that we received that day between 7:45 am and 8:15 am was a 1 in 10 year precipitation event that caused some short term flooding in the area.
The 77.5 cm of snow we saw during the calendar year of 2010 was about half of the average of 159.5 cm. We didn’t get any measureable snow during March at the UW weather station and you have to back to 1946 to find another March like that.
Notable weather days of 2009:
January 27: The high temperature was only -4.1 °C breaking a streak of 14 days of above average temperatures.
March 26: The UW Weather Station blog predicts that the high temperature that day will be the lowest for at least the next 6 months. As it turns out it took until November 28th to see a colder day so it was actually over 8 months before a lower high was seen.
April 1: Thaigo Barolomei wins the UW Weather Station Contest with his guess of 1:00 pm.
May 3: Not really a weather event, but on this day at 5:15 am the UW Weather Station equipment experienced a major failure in the main logger unit. It would take until May 26th before the station was back in operation, resulting in by far the longest period of downtime for the station since operation began in February of 1998. We thank everybody for their patience during that difficult time.
July 5: The high temperature of 33.1 °C was the warmest temperature of the year and the highest since August 1, 2007. While the low temperature that evening was only 21.9°C, the warmest night since August 1, 2006.
July 15: As a big storm came through the area, the temperature dropped 4.3 degrees between 8:15 and 8:30 pm, the largest 15 minute temperature drop of the year.
July 23: A 1 in 10 year event between 7:45 am and 8:15 am saw 35.4 mm of precipitation fall and the day’s total of 62.5 mm was the single wettest day since July 11, 2008.
August 23: The high temperature was 2.4 degrees below average, breaking a streak of 2 weeks of above average temperatures.
September 2: More rain fell during a 24 hour period between the 2nd and the 3rd (51.9 mm) then during the entire month of August (36.2 mm).
October 13: The temperature dipped below zero for the first time since May 11, resulting in 155 frost free days for 2010. This was very close to the average number frost free days in the region which is 154.
Click on the image below to see the temperature chart:
Click on the image below to see the precipitation chart:
Sunday, January 2, 2011
December 2010 Summary
Coldest December in 10 years and the driest one in over 15
Although we didn’t see any extremely cold temperatures in December, it was colder than average for 25 days of the month, including a 20 day streak, while the only significantly warmer than average days came right at the end.
Overall it was 1.5 degrees lower than average, making it the only colder than average month the year and the coldest December since 2000.
With only 36.4 mm of precipitation it was a very dry month with just over half the average of 71.1 mm. This ties 1993 when we also had 36.4 mm and you have to go back to 1969 to a find a December with less.
Most of the precipitation came on the 12th with 15.3 mm in the form of wet snow and as far as total snowfall, we had 28 cm of the average 38.5 cm.
Summary for December 2010:
Maximum Temperature 8.5 °C
Minimum Temperature -17.4 °C
Average Daily High Temperature -2.6 °C (Long term average -0.4 °C)
Average Daily Low Temperature -8.3°C (Long term average -7.5 °C)
Total Precipitation 36.4 mm (Long term average 71.1 mm)
(Long term averages based on 1971-2000 data for the Waterloo Wellington Airport)
Sign up to get the monthly weather station summary by e-mail
Subscribe to:
Posts (Atom)


