Just a bit on the logistics, I stayed in a small town called Glasgow, Kentucky the night before the eclipse and woke up early to drive to Bledsoe Creek State Park in Tennessee which is east of Nashville. I was worried there might be some traffic, but it was open roads all the way. I got there about an hour and half before the park opened and was car number 120 in line. The park was mostly forested, but there was a hydro cut where most people set up their camps as there was a pretty good open view of the sky.
It was nice being somewhere that wasn't wall to wall people, but enough people to have a good group experience. There were also a few people with very large telescopes, including one guy who had his connected to a computer screen so everyone could see a close up of the sun.
The day was really hot and sunny, with high temperatures of around 35C. A few clouds appeared in the early afternoon, but just one covered the sun about an hour before totality, after that it was clear.
About 10 or 15 minutes before totality is when it started to get noticeably less bright, note I didn't say darker, but it started to feel not quite so hot and I could take off my sunglasses. I think this was made all the more noticeable because it was so hot that day.
Once the moon's shadow actually passed over it of course became dark almost instantly, it wasn't pitch black but maybe about as dark as it is 15 minutes after a regular sunset. Also interesting was the horizon which looked like sunset or sunrise, but instead of just in one part of the horizon it was all around. Then everything went in reverse once the sun came back out.
Here is a video that I made just by putting a phone on the ground, it starts about a minute before totality and goes till about a minute after. You can see how quickly it got dark and how the sky changed during the event (note the I'm standing out of the camera's view, I don't know the people who are actually seen in the video):
Something I didn't notice until I watched the videos was just how loud the cicadas got during the eclipse. If you watch this "time-lapse" I made you can see both the reduction in the light as well as the background noise. This one starts about 5 minutes before totality and each segment is about 1 minute apart:
Here is the graph of temperature during the eclipse in Tennessee, I kept one of the sensors in the sun (not the usual way to measure temperature I know) and one in the shade. You can see that the sensor in the sun went down about 7C and the one in the shade got down to about the same temperature but started about a degree lower (the variation in temperature before 14:00 is probably just me setting everything up getting the sensor out of my car, as well the temperature looks like it was still going up when I left the park so I didn't get the entire rising limb of the temperature graph):

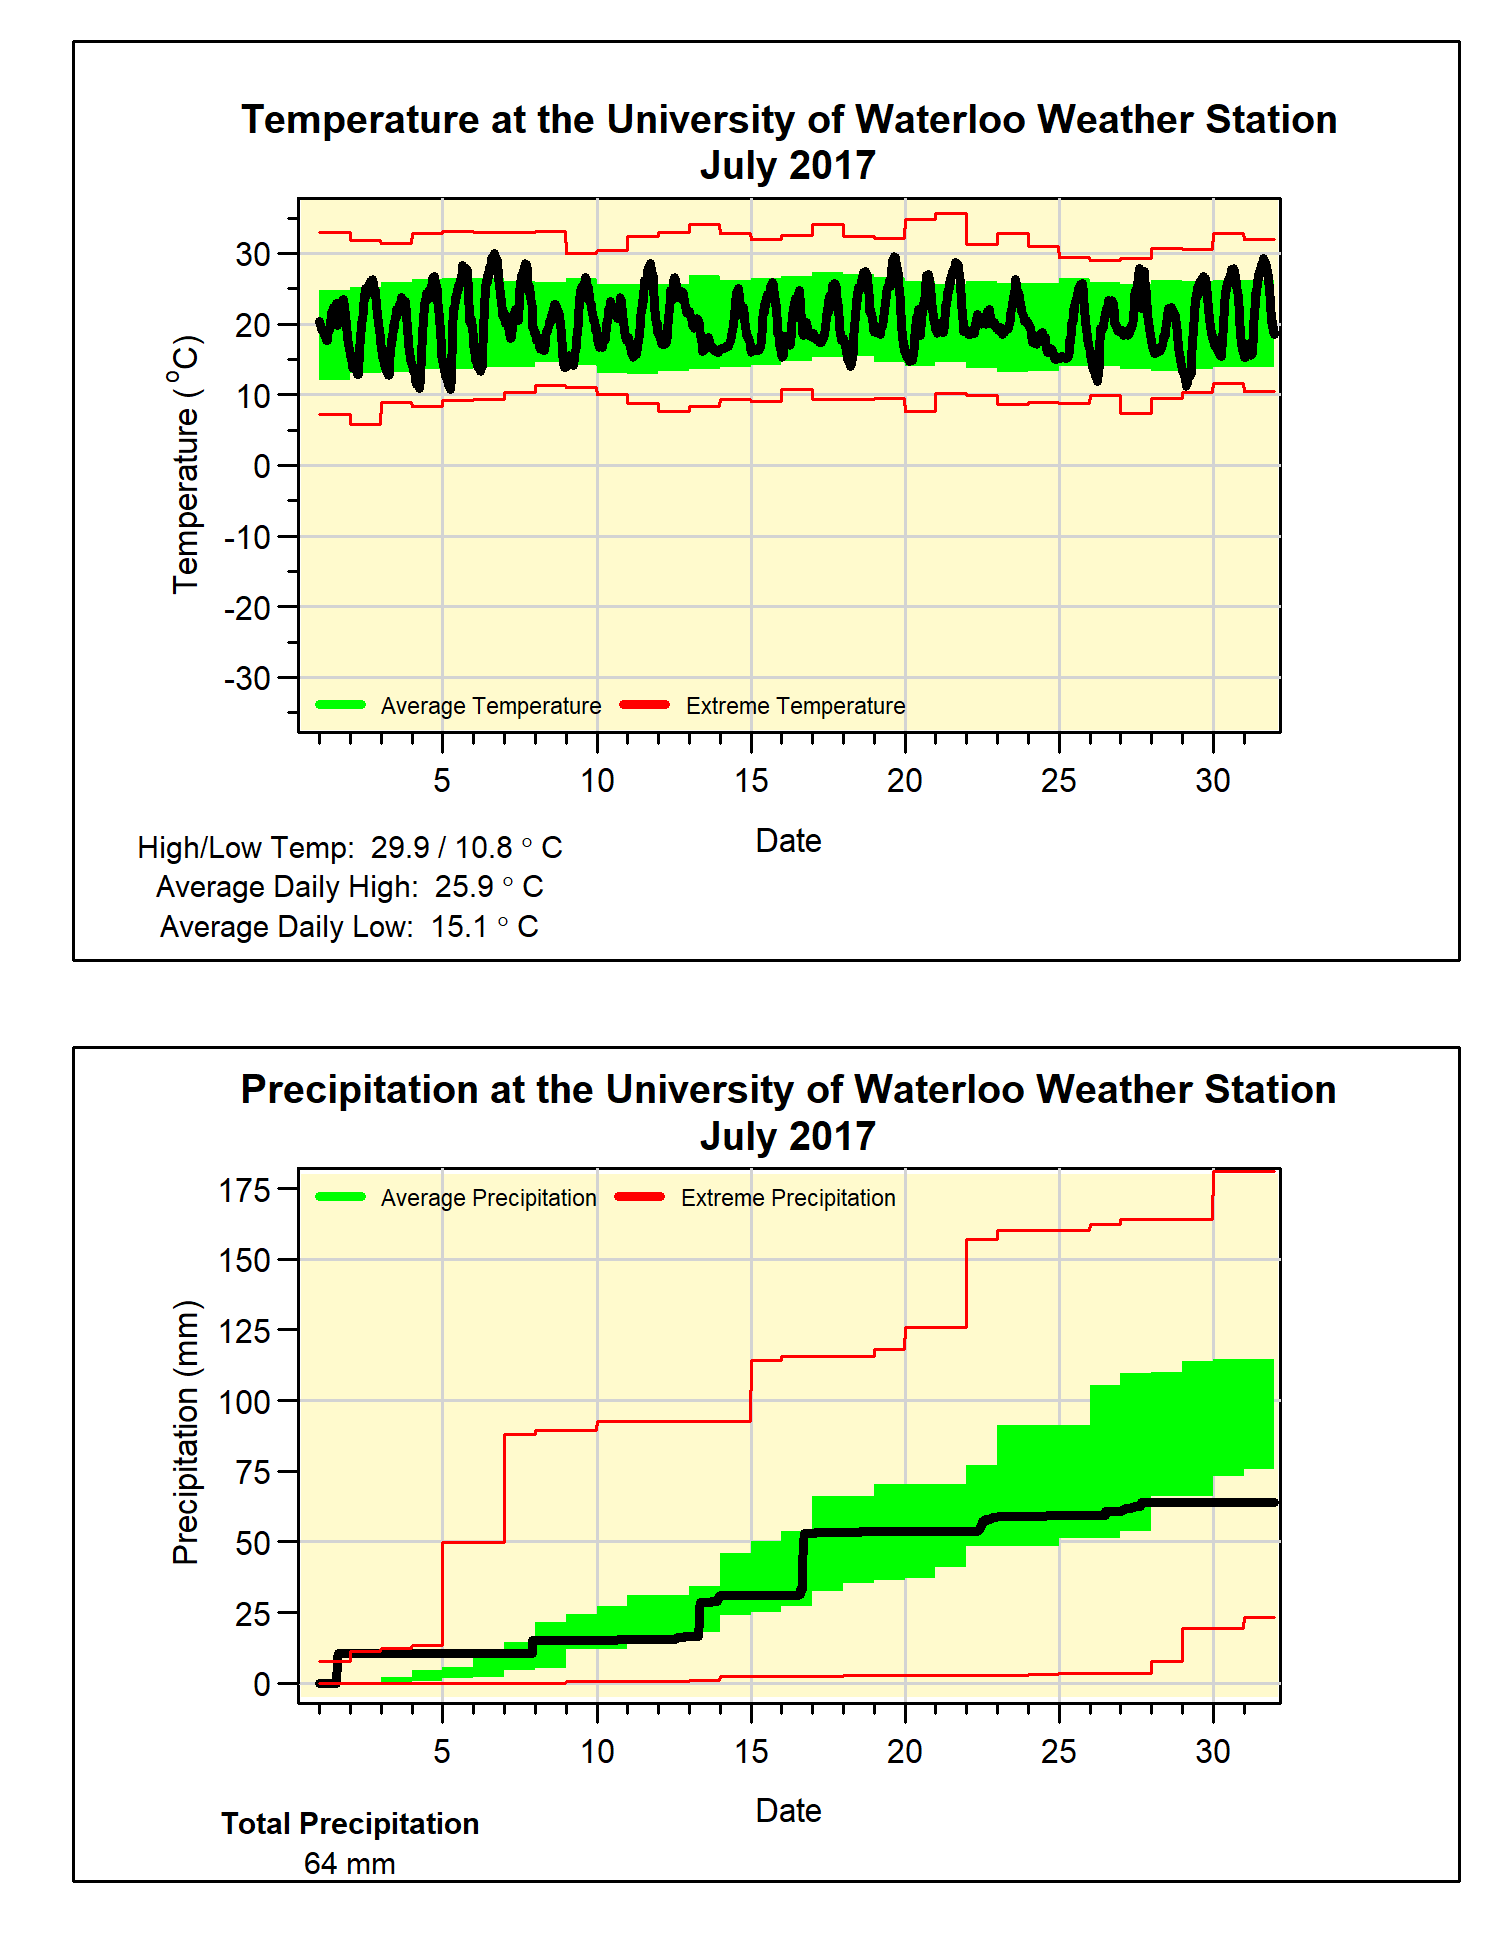
And closer to home, at the UW weather station there was understandably a lessor effect on the air temperature:

With the eclipse being 75% or so in the region, there was a large effect on the incoming solar radiation and the wind speed, as shown in the graphs below:


Overall it was a great experience and I recommend trying to get into the path of totality if you can make it. The only downside was that after getting out of the park there was about 5 hours of bumper to bumper, stop and go traffic to get away from the totality line. So my biggest advice for the eclipse in 2024 is that wherever you are, stay somewhere close and spend the night so you don't have to deal with the traffic.