Thursday, December 2, 2021

November 2021 Summary

A dry November with average temperature

Not really that much to say about the temperature during the month of November.   Although there were a few warm days, these were offset by many days that were a few degrees cooler than average.  Put all that together and you get an overall temperature 0.4 degrees above average, but still within the average range.

The precipitation didn’t really start until almost 2 weeks into the month, and even after that there were no days with over 10 mm of precipitation.  This resulted in the total precipitation of 51.6 mm being well below the average of 87.1 mm, and the direst November in the last 8 years.

Even with this dry month, the total precipitation of 950.5 mm remains well above the average for this time of year of 832.9 mm.  While the total snowfall of 17.5 cm was a bit more than the average of 13 cm for November.

Summary for November 2021:
Maximum Temperature 18.8°C
Minimum Temperature -9.3°C
Average Daily High Temperature 7.0°C (Long term average 6.3°C)
Average Daily Low Temperature -1.4°C (Long term average -1.4°C)
Total Precipitation 51.6 mm (Long term average 87.1 mm)

(Long term averages based on 1981-2010 data for the Waterloo-Wellington Airport)


Tuesday, November 2, 2021

October 2021 Summary

The fourth warmest October in the region with above average precipitation

The first half of the month was very warm, with some days having a low temperature above the average high for those days.  Even when it cooled down in the second half of the month, the temperatures just went down to the average.  There were 10 days with a temperature over 20°C where typically there are only 3.5 days like that.

The overall temperature was 4.8 degrees above average, making it the warmest October since 2007 and tied for the fourth warmest since records began in the region in 1914.  At 8 am on October 24th the temperature went below zero for the first time since the spring, which is about 7-10 days later than the average.

October started off wet in the first few days of the month, it continued to be wet throughout the month with storms every few days.  The final total of 110.6 mm was well above the average of 67.4 mm.

This wetter than average month resulted in the total precipitation since January (898.9 mm) getting even more above the average for this time of year (750.6 mm).

Summary for October 2021:

Maximum Temperature 25.8°C
Minimum Temperature -0.5°C
Average Daily High Temperature 16.7°C (Long term average 13.5°C)
Average Daily Low Temperature 9.3°C (Long term average 2.9°C)
Total Precipitation 110.6 mm (Long term average 67.4 mm)

(Long term averages based on 1981-2010 data for the Waterloo-Wellington Airport)


Saturday, October 2, 2021

September 2021 Summary

September was hot and the second wettest ever in the region

The temperature was close to average for most of September, but a warm week in the middle of the month resulted in an overall temperature that was 1.8 degrees higher than average.  We still have not had a September in the 23 year history of UW Weather station that was in the below average range.

But of course the big story of the month was the precipitation and the amazing amount of rain that came down on the 21st and 22nd.  Starting from 9 pm Sept 21, 2021, we saw 93.4 mm in 24 hours, this is the now the highest 24 hour total ever recorded at the station (The previous was 91.4 mm starting Jan 11, 2020 at 3 am).  The total for the entire storm was 107.0 mm.

Incredibly, even without the rain from the 21st and 22nd, there still will would have been an above amount of precipitation for the month.  The total for September of 210.8 mm makes it the second wettest September in the over 100 years of weather records in the region (just behind the 216.6 mm in 1986).  It was also the 6th wettest for any month and the wettest month since the 223.2 mm recorded in July of 1988.

This very wet month put the total for the year of 788.3 mm well above the average of 683.5 mm.

Summary for September 2021:

Maximum Temperature 27.4°C
Minimum Temperature 4.8°C
Average Daily High Temperature 21.9°C (Long term average 20.4°C)
Average Daily Low Temperature 10.7°C (Long term average 8.6°C)
Total Precipitation 210.8 mm (Long term average 87.8 mm)

(Long term averages based on 1981-2010 data for the Waterloo-Wellington Airport)


Thursday, September 2, 2021

August 2021 Summary

 Both the second wettest and hottest August in over 20 years

The month of August had only a few cooler days compared to 8 days above 30°C, this resulted in an overall temperature that was a little more than 3 degrees above average.  Not only was this the second warmest August in the last 20 years, it was also one of the odd times when August was actually hotter than July.  

That was quite the storm that came through on the 29th!  Between the hours of 7:15 and 8:15 pm a total of 47.8 mm of rain was recorded.  This was the second highest 1 hour precipitation recorded at the UW Weather Station since it was established in 1998 (the record was 57.4 mm on August 2nd, 2014).  It also was over half of the total average precipitation for the month which is 83.9 mm.

If it wasn’t for that big storm at the end of the month, it might have actually ended up a drier than average month.  But that storm resulted in the total for August of 122.6 mm to be the second highest in close to 30 years.

After a dry start to the year, these last few wet months have brought the total precipitation we have seen so far in 2021 of 577.5 mm closer to the average of 596.0 mm.

Summary for August 2021:

Maximum Temperature 31.7°C
Minimum Temperature 8.4°C
Average Daily High Temperature 27.8°C (Long term average 24.8°C)
Average Daily Low Temperature 16.2°C (Long term average 12.9°C)
Total Precipitation 122.6 mm (Long term average 83.9 mm)

(Long term averages based on 1981-2010 data for the Waterloo-Wellington Airport)


Monday, August 2, 2021

July 2021 Summary

An average month for both temperature and precipitation

Although the month started off with a bit of a hot streak, this was followed by some cooler temperatures and the rest of the month didn’t see many extremes.  The resulted in an overall temperature that was just a bit (0.2 degrees) higher than average, but well within the average range.  This does make it the coldest July in 6 years and there has only been 1 colder than average July in the last 12 years.

There was pretty consistent precipitation throughout the month, but in the end the 113.6 mm, although more than the 98.6 mm average, was less than a millimetre from putting it into the above average range.  However, it was the wettest July in the last 7 years.

After a dry start to the year, the most recent month and half has started to make up for it, the total precipitation so far this year of 454.9 mm is now closer to the average of 509.0 mm.

Summary for July 2021:
Maximum Temperature 31.4°C
Minimum Temperature 8.1°C
Average Daily High Temperature 25.5°C (Long term average 26.0°C)
Average Daily Low Temperature 14.8°C (Long term average 14.0°C)
Total Precipitation 113.6 mm (Long term average 98.6 mm)

(Long term averages based on 1981-2010 data for the Waterloo-Wellington Airport)


Thursday, July 1, 2021

June 2021 Summary

A very hot June with above average precipitation

There were lots of really hot days during the month and only a couple of cooler ones, this resulted in an overall temperature that was 3 degrees above average.  This was the warmest June since 2005 and the 5th warmest in the weather records in the region that go back to 1914.

A lot of this heat came at the beginning of the month, with 4 days over 30°C and 3 of those on consecutive days.  Although it is not unusual to see days this hot during June, typically they occur later in the month.  The last time there were 3 days in a row above 30°C in the first half of the month was back in 2005.

It was looking like it was going to be an average month for precipitation, but that all changed in the last 7 days.  During the last week of June there was one storm that resulted in 37.8 mm and then another a few days later that dropped 25.4 mm.  The total for the month was 117.4 mm, making it the wettest month since we got 154.7 mm in January of 2020.

Even with this very wet month, because it has been so dry this year, the total precipitation we have seen in the first half of the year of 341.3 mm is well below the average total of 416.1 mm.  

Summary for June 2021:

Maximum Temperature 31.4°C
Minimum Temperature 4.0°C
Average Daily High Temperature 26.3°C (Long term average 23.6°C)
Average Daily Low Temperature 14.9°C (Long term average 11.5°C)
Total Precipitation 117.4 mm (Long term average 82.4 mm)

(Long term averages based on 1981-2010 data for the Waterloo-Wellington Airport)


Tuesday, June 1, 2021

May 2021 Summary

A very dry May with average temperatures 

As often happens with months that have periods of cold temperatures (the start of May) and hot temperatures (the middle of May), the overall temperature turns out to be close to average.  In this case very close, with the month coming in at just 0.1 degrees below average.  

Assuming we have seen the last below zero temperature until the fall, the last freezing day was May 9th, this is just a couple of days later than the average in the last 20 years.  On the other end of the scale, there were 3 days of temperatures over 30°C during the month, when we typically we only average one of those days every other year.

With a period of over 2 weeks of no measureable precipitation, it was looking like it might be the driest May in the over 100 year of weather records in the region.  However, the wettest single day (19.6 mm) since mid-April on the 28th brought the total up to 28.6 mm for the month.  It was still the driest May since 2005, but only the 9th driest in local weather data records.  

This dry month puts the total for the year so far at 223.9 mm, well below the average of 340.2 mm.

Summary for May 2021:
Maximum Temperature 30.6°C
Minimum Temperature -1.6°C
Average Daily High Temperature 19.1°C (Long term average 18.5°C)
Average Daily Low Temperature 5.7°C (Long term average 6.4°C)
Total Precipitation 28.6 mm (Long term average 82.3 mm)

(Long term averages based on 1981-2010 data for the Waterloo-Wellington Airport)


Sunday, May 2, 2021

April 2021 Summary

A warm April with just barely above average precipitation 

Even with a few cold days scattered throughout the month, the week or so of warm days at the beginning of the month was enough to put the overall temperature at 1.3 degrees above average.  This marks only the second warmer than average month of April in the last 11 years.

At 12:30 pm on April 8th, the temperature went above 20°C for the first time this year ending the UW Weather Station Contest for 2021, this was over a month earlier than last year’s date of May 13th.

Over half of the precipitation for the month came during 2 really wet days (the 11th and 12th) when 51.0 mm came down.  The total for the month was 86.0 mm, putting it just into the above average range.

The slightly above average precipitation this month brought the total of the year (195.3 mm) a bit closer to the average at this time of year (264.4 mm).


Summary for April 2021:
Maximum Temperature 23.1°C
Minimum Temperature -6.5°C
Average Daily High Temperature 12.8°C (Long term average 11.5°C)
Average Daily Low Temperature 2.1°C (Long term average 0.8°C)
Total Precipitation 86.0 mm (Long term average 74.5 mm)

(Long term averages based on 1981-2010 data for the Waterloo-Wellington Airport)


Friday, April 2, 2021

March 2021 Summary

A warm March with barely average precipitation

There were never any very cold temperatures during March and along with a few days that got close, I mean really close, to 20°C, the result was an overall temperature over 3 degrees above average.  This made it the warmest March in the last 9 years since that very memorable one back in 2012.

Over half the month’s precipitation came on one day, when we saw 28.6 mm on the 26th, while the rest of the month was very dry.  The total of 44.0 mm was just barely enough to get it into the average range, even though it was much less than the average of 61.0 mm.  This year has started out very dry with only 109.3 mm of precipitation compared to an average of 187.6 mm for this time of year.

With the combination of warm temperatures and low precipitation it shouldn’t surprise anyone that we only got 1.5 cm of snow during March.  This of course is much less than the 26.5 cm of snow that we get on average.

If we don’t get any more this year, the total for the snowfall season will stay at 129.5 cm, well below the average of 159.7 cm.  However, it may have felt like we had more snow this winter as it stayed cold enough from late December to early March not to melt all the snow we received.  We never got the typical mid-winter snow reset and thus the snow piled up into large mountains beside our driveways making it seem like a snowy winter, when really it wasn’t.

Summary for March 2021:
Maximum Temperature 19.8°C
Minimum Temperature -16.0°C
Average Daily High Temperature 8.6°C (Long term average 3.6°C)
Average Daily Low Temperature -4.3°C (Long term average -5.6°C)
Total Precipitation 44.0 mm (Long term average 61.0 mm)

(Long term averages based on 1981-2010 data for the Waterloo-Wellington Airport)


Thursday, March 4, 2021

February 2021 Summary

A cold February with just barely average precipitation

It looks like the “real” winter this year was the 2 week period in the middle of February, as the season up to that point was running well above average.  The month saw multiple days when the temperature went down to nearly -20°C and barely reached above -10°C during the day.  Even though there was a bit of a warm up the last few days, the overall temperature was still 2 degrees less than average, making it the coldest February since 2015.

Not much to say about the precipitation this month, no particularly large storms just a few systems that came through every week or so.  The total precipitation at 39.7 mm was a lot less than the average of 54.9 mm and the driest since 2014, but it was enough to put it into the average range.

Almost half of the total snowfall for the month of 38.5 cm came on the 16th when 17 cm came down, the total for February was above the average of 30.3 cm.  The total for the snowfall season of 128.0 cm is very close to the 125.6 cm we would expect at this point in the season.

Summary for February 2021:

Maximum Temperature 7.2°C
Minimum Temperature -23.6°C
Average Daily High Temperature -2.2°C (Long term average -1.2°C)
Average Daily Low Temperature -12.9°C (Long term average -9.7°C)
Total Precipitation 39.7 mm (Long term average 54.9 mm)

(Long term averages based on 1981-2010 data for the Waterloo-Wellington Airport)


Monday, February 1, 2021

January 2021 Summary

A really warm and really dry January 


Although the overall temperature was almost two and half degrees warmer than average, most of the days were just a little above average, and there were no dramatically above average days.  For instance, the warmest temperature for the month of 3.7°C whereas there is usually about a 50% chance we would see a double digit temperature during the month.

One result of this lack of really warm temperatures was that there wasn’t a major snowmelt during the month, thus most of the snow that fell around Christmas is still on the ground.

In a dramatic turnaround from last year, which was the wettest January in the over 100 years of data in the region, this January was the fifth driest.  We only saw 25.6 mm of precipitation this year, the record lowest was back in 1961 when we only had 16.0 mm.

Not surprisingly, the total snowfall of 22.5 cm was only about half of the average of 43.7 cm for the month.  But with the amount of snowfall we saw late last year, the total for the snowfall season so far is 89.5 cm, not that far below the 95.3 cm we see on average for this point in the snowfall season.


Summary for January 2021:
Maximum Temperature 3.7°C
Minimum Temperature -20.5°C
Average Daily High Temperature -0.8°C (Long term average -2.6°C)
Average Daily Low Temperature -7.3°C (Long term average -10.3°C)
Total Precipitation 25.6 mm (Long term average 65.2 mm)


(Long term averages based on 1981-2010 data for the Waterloo-Wellington Airport)


Wednesday, January 13, 2021

2020 Summary

 University of Waterloo Weather Station Annual Summary - 2020

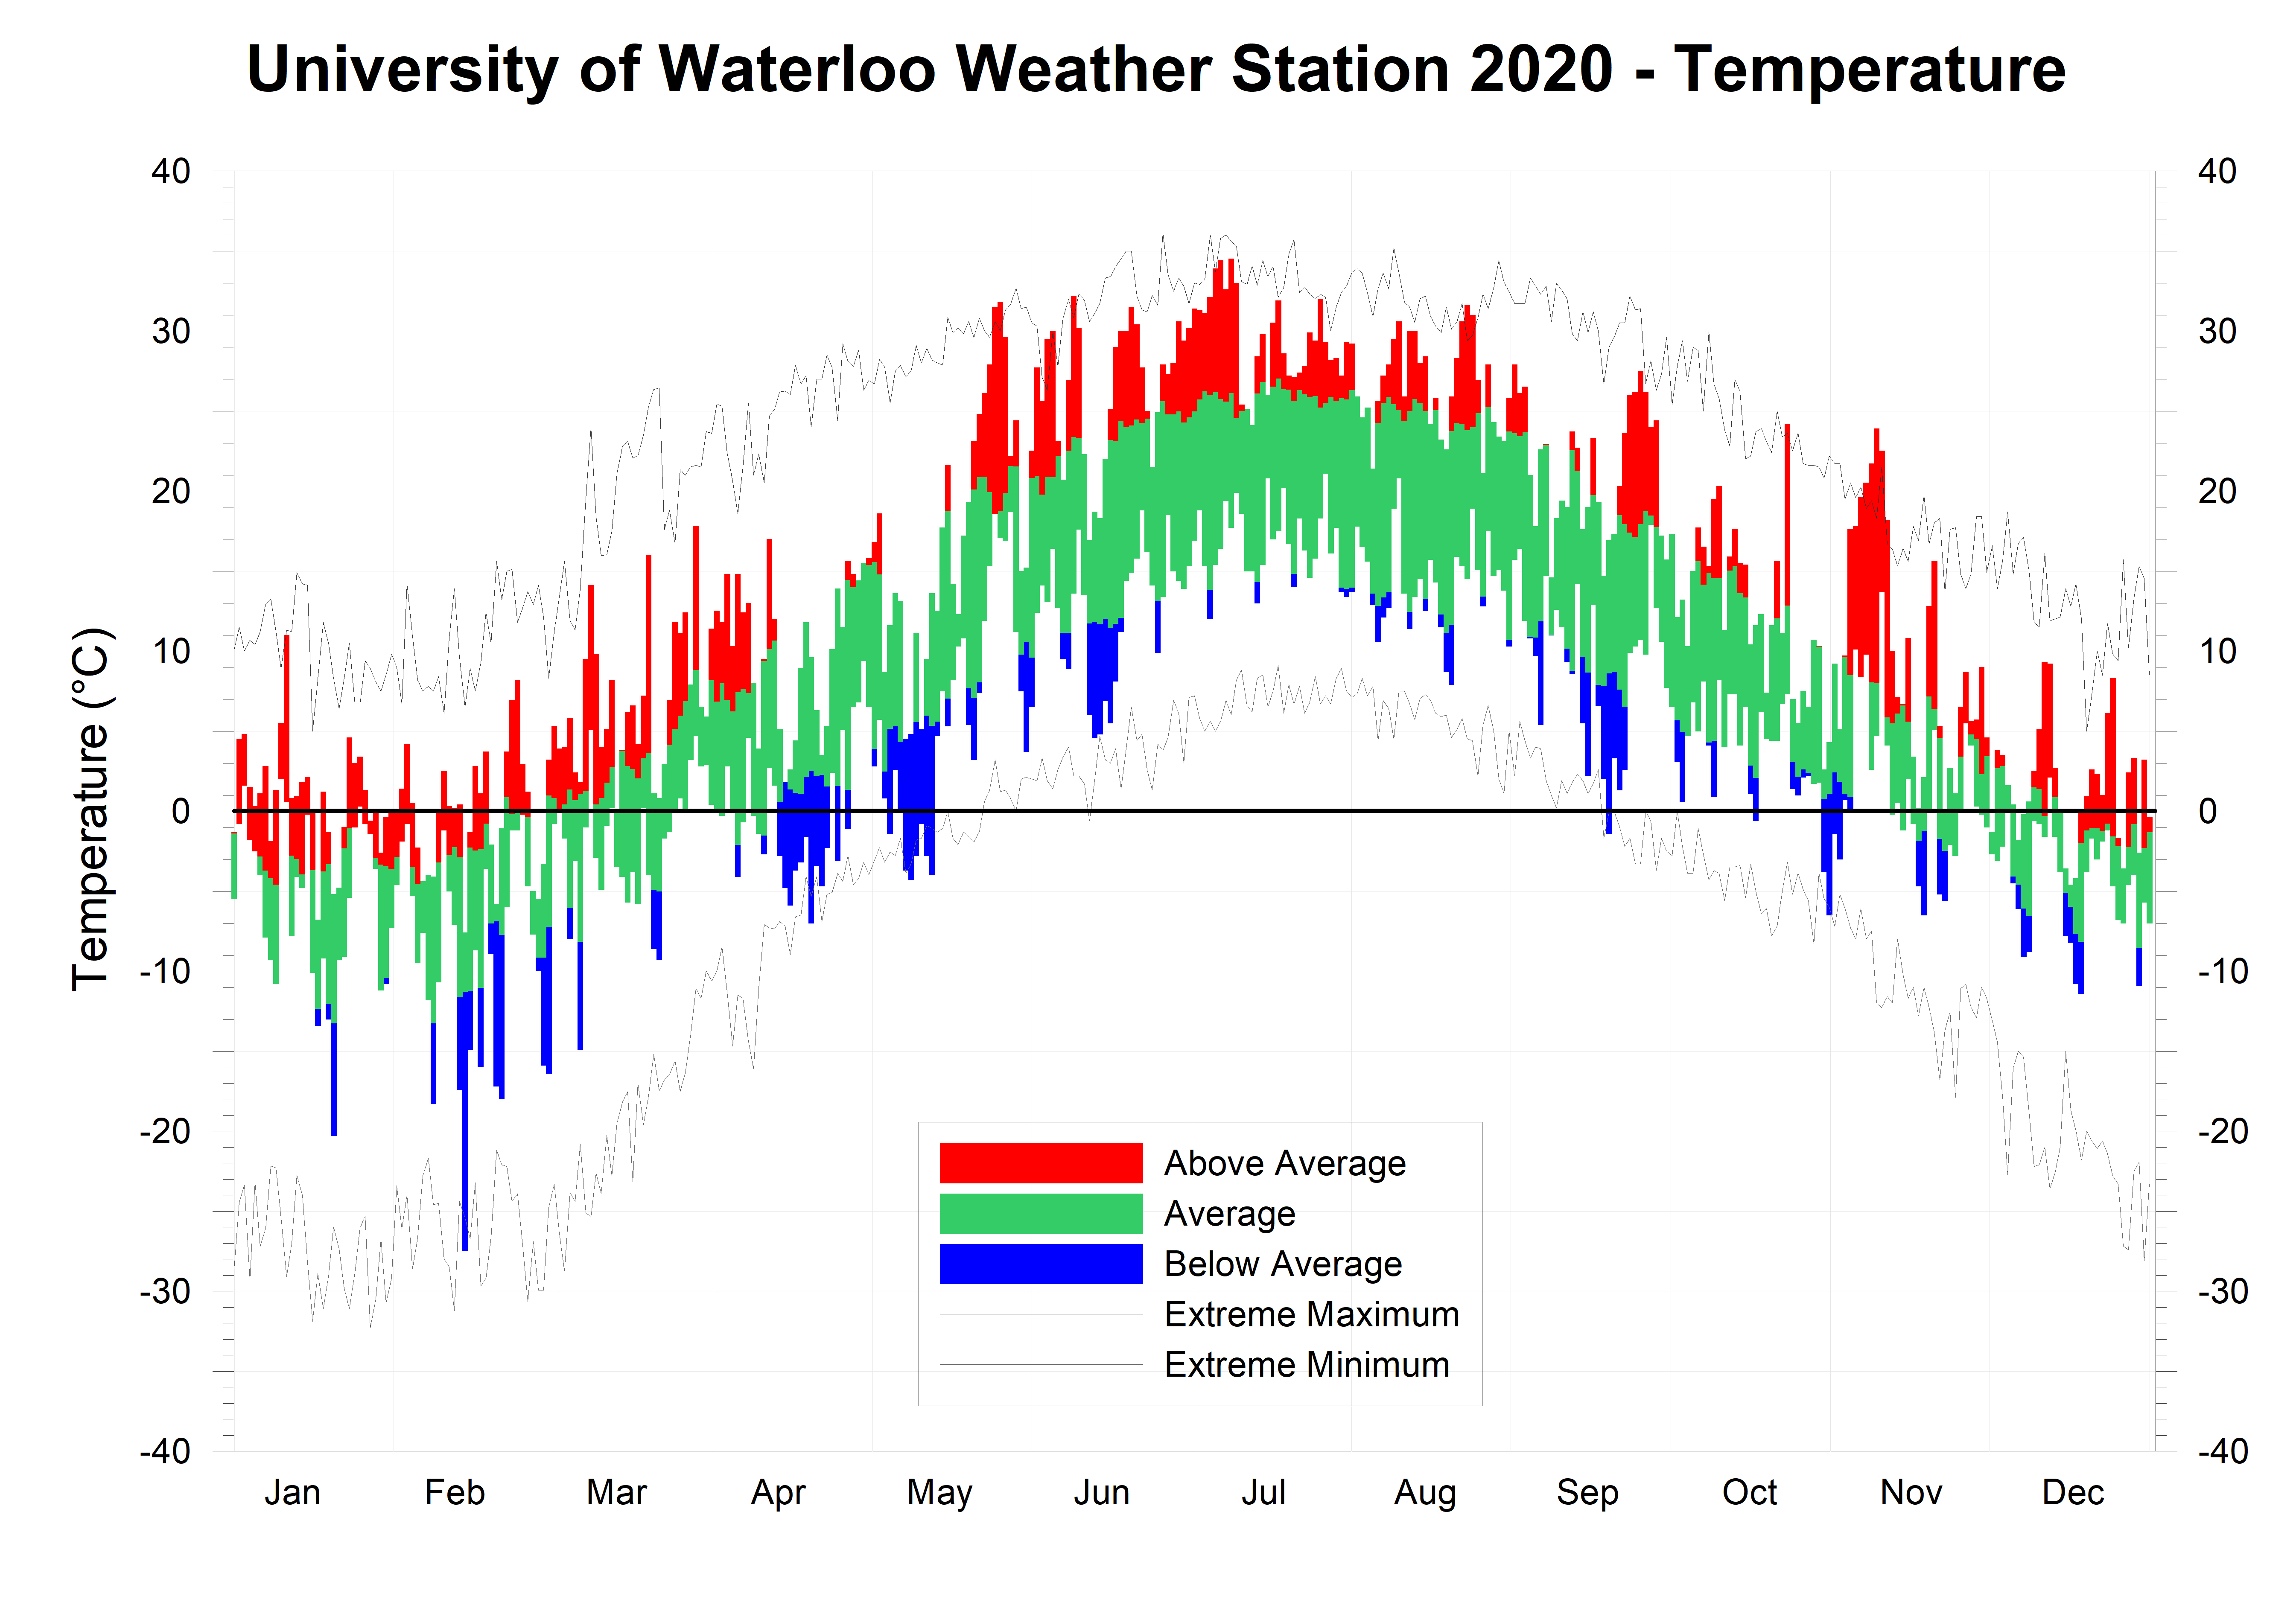
The year 2020 saw some really warm months, many others that were just pretty warm and only two that were colder than average.  There were a couple of historic streaks of warm temperatures, one in July that included the hottest day in almost 7 years, and the other was the warm start of November, that saw the second highest ever November temperature.  Averaged over the entire year, the temperature was 1.5 degrees above average which puts it at the eighth warmest in the over 100 years of weather records in the region which started in 1914.

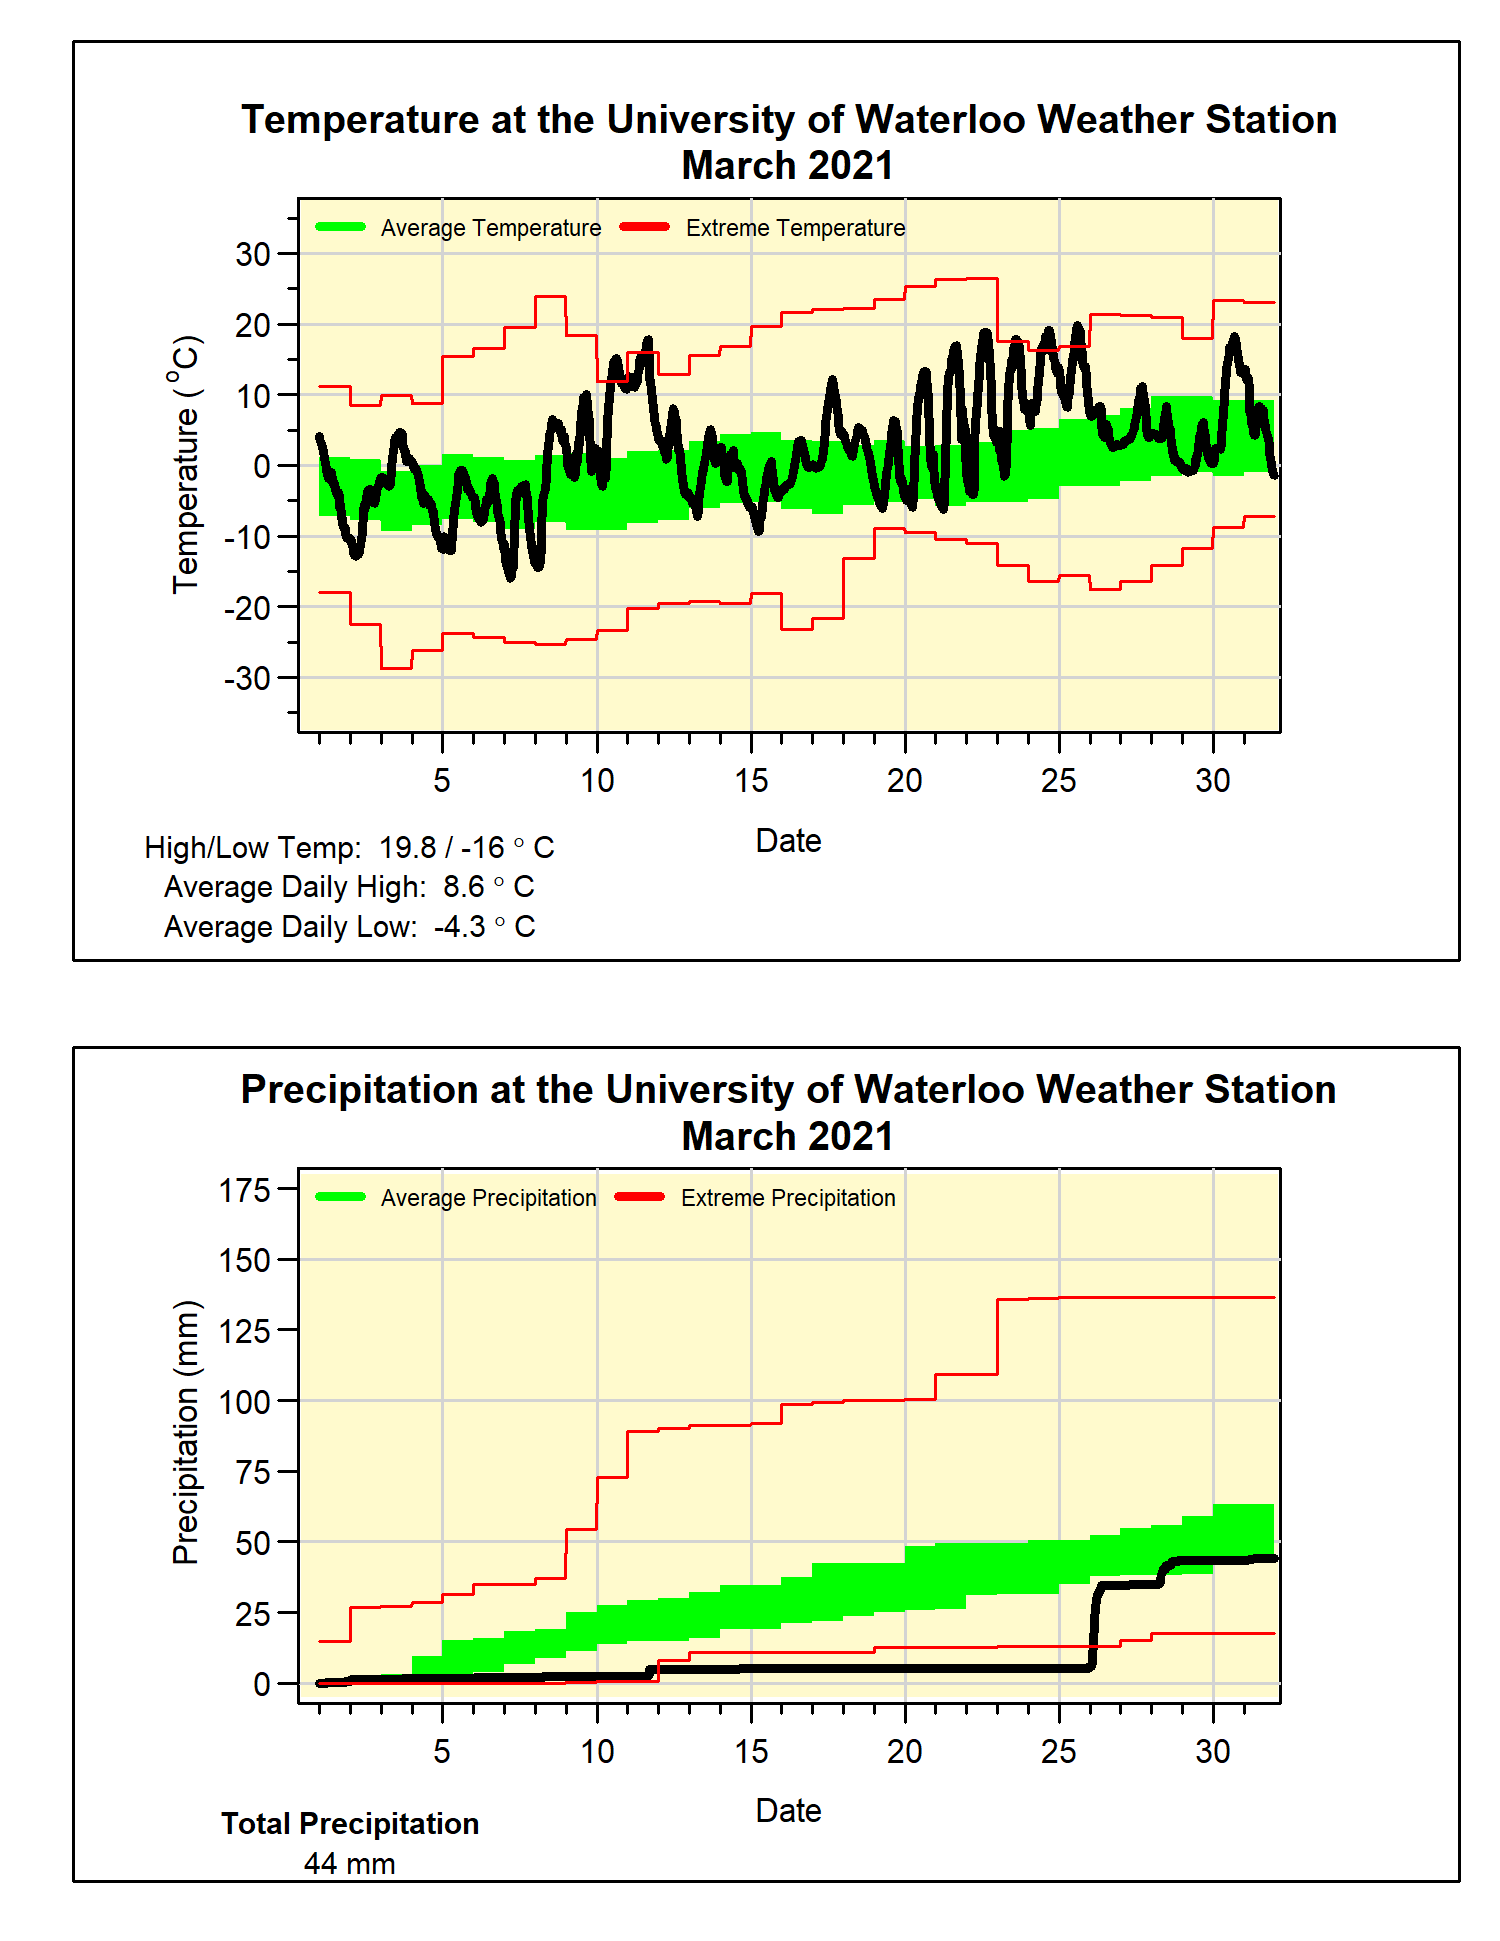
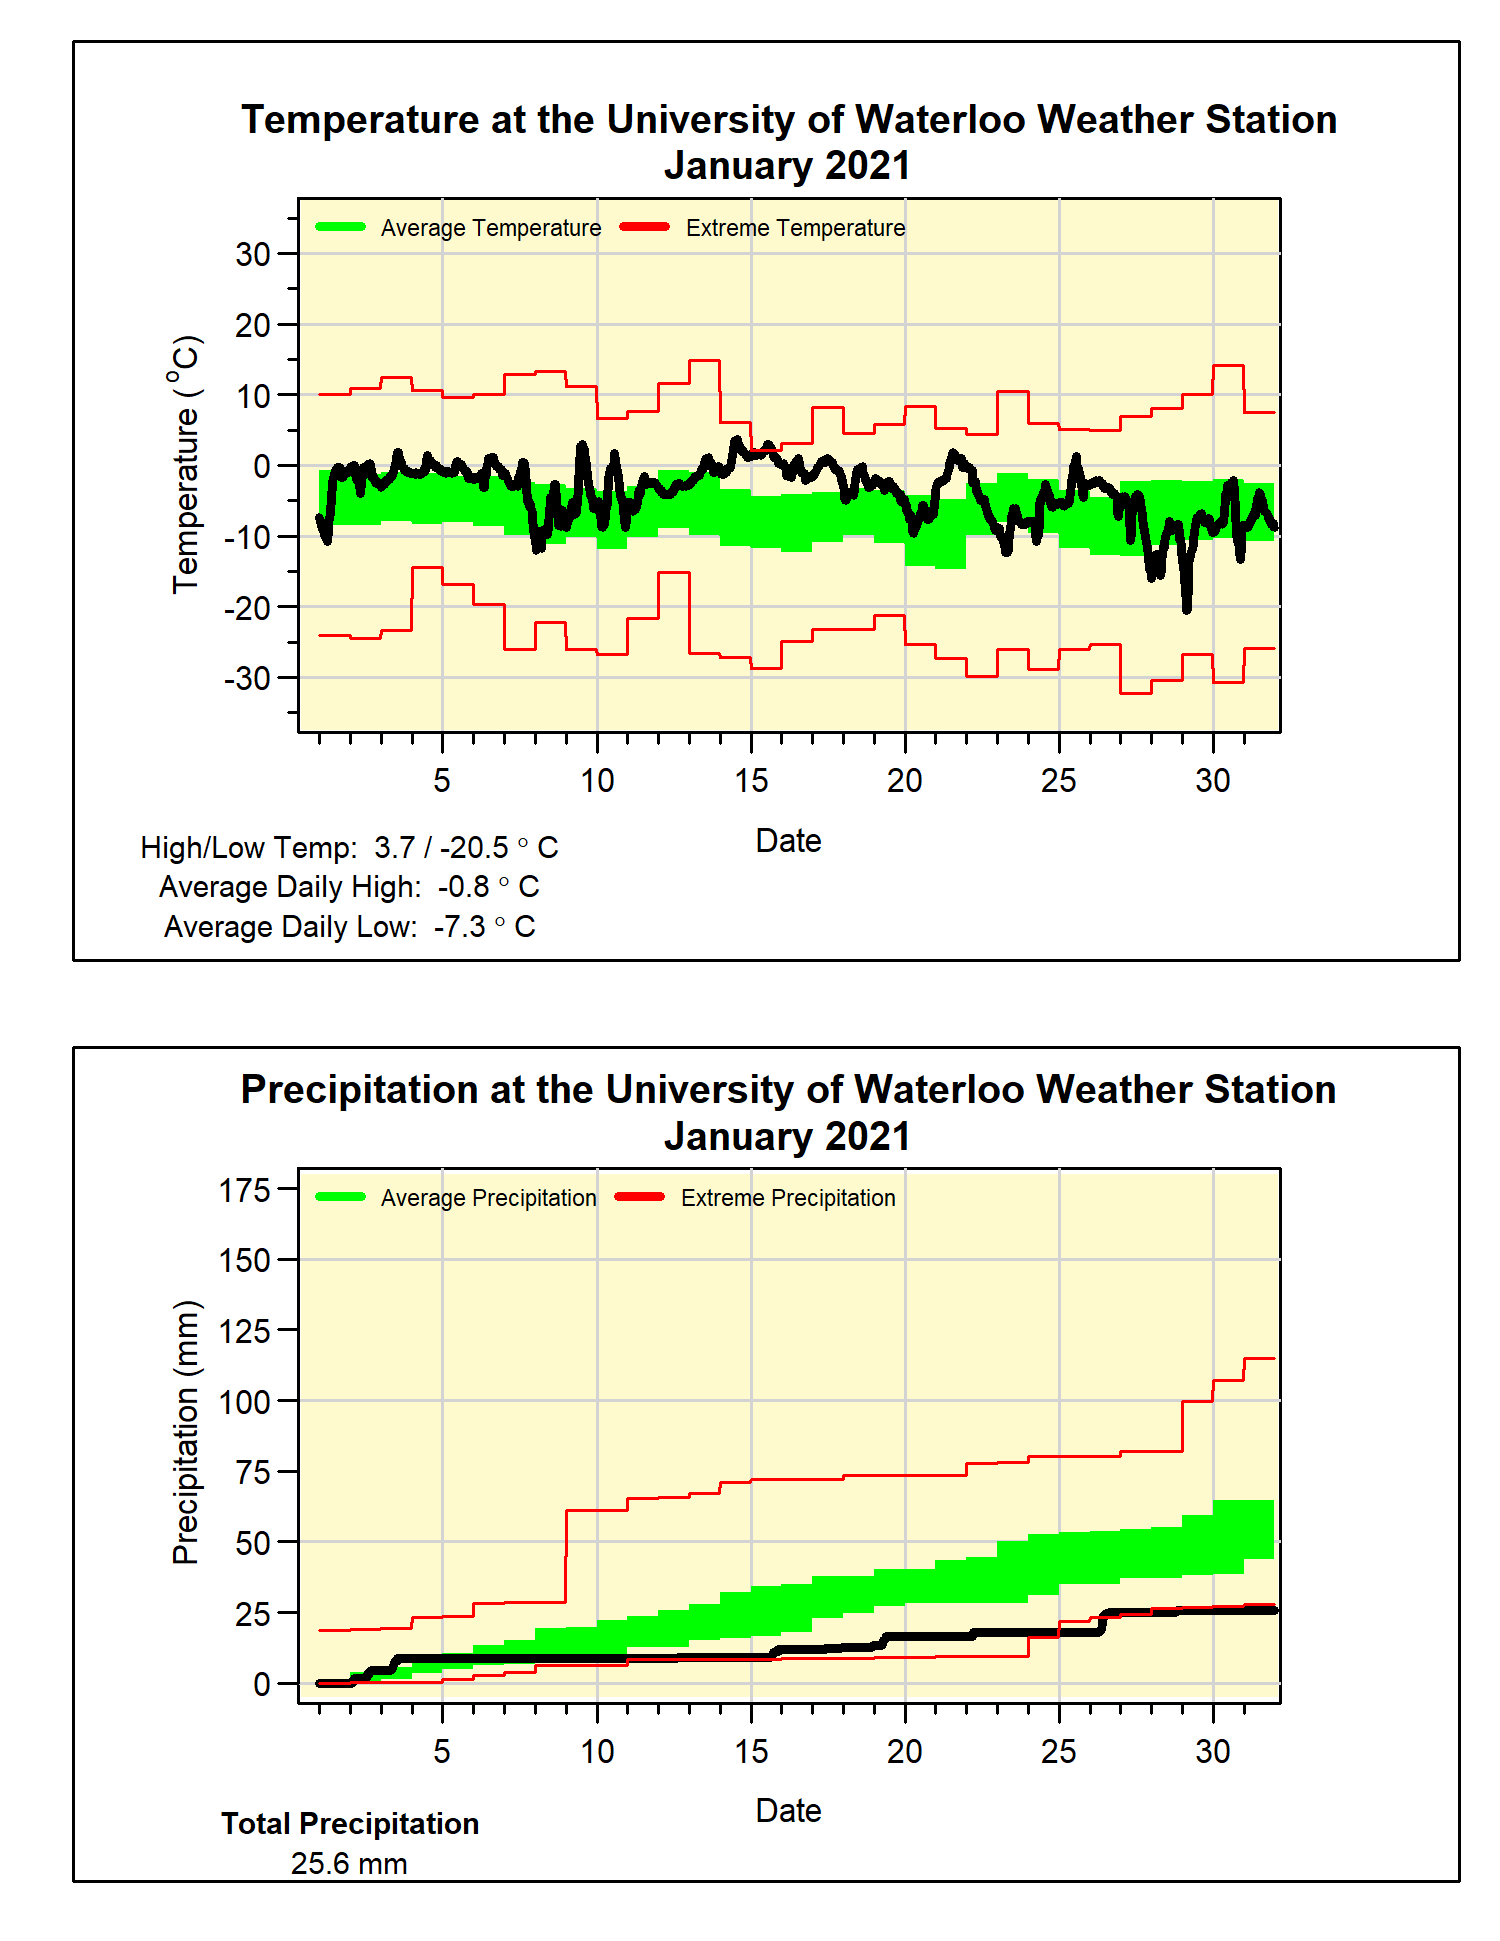
The year started off really warm, with January coming in at almost 4 degrees above average, which was the 6th warmest January in our region’s weather history and the warmest January since 2006.  Although it was just a bit warmer than average in February, the warmth really came back in March when for only the second time in our weather history the temperature went above zero every day during the month.

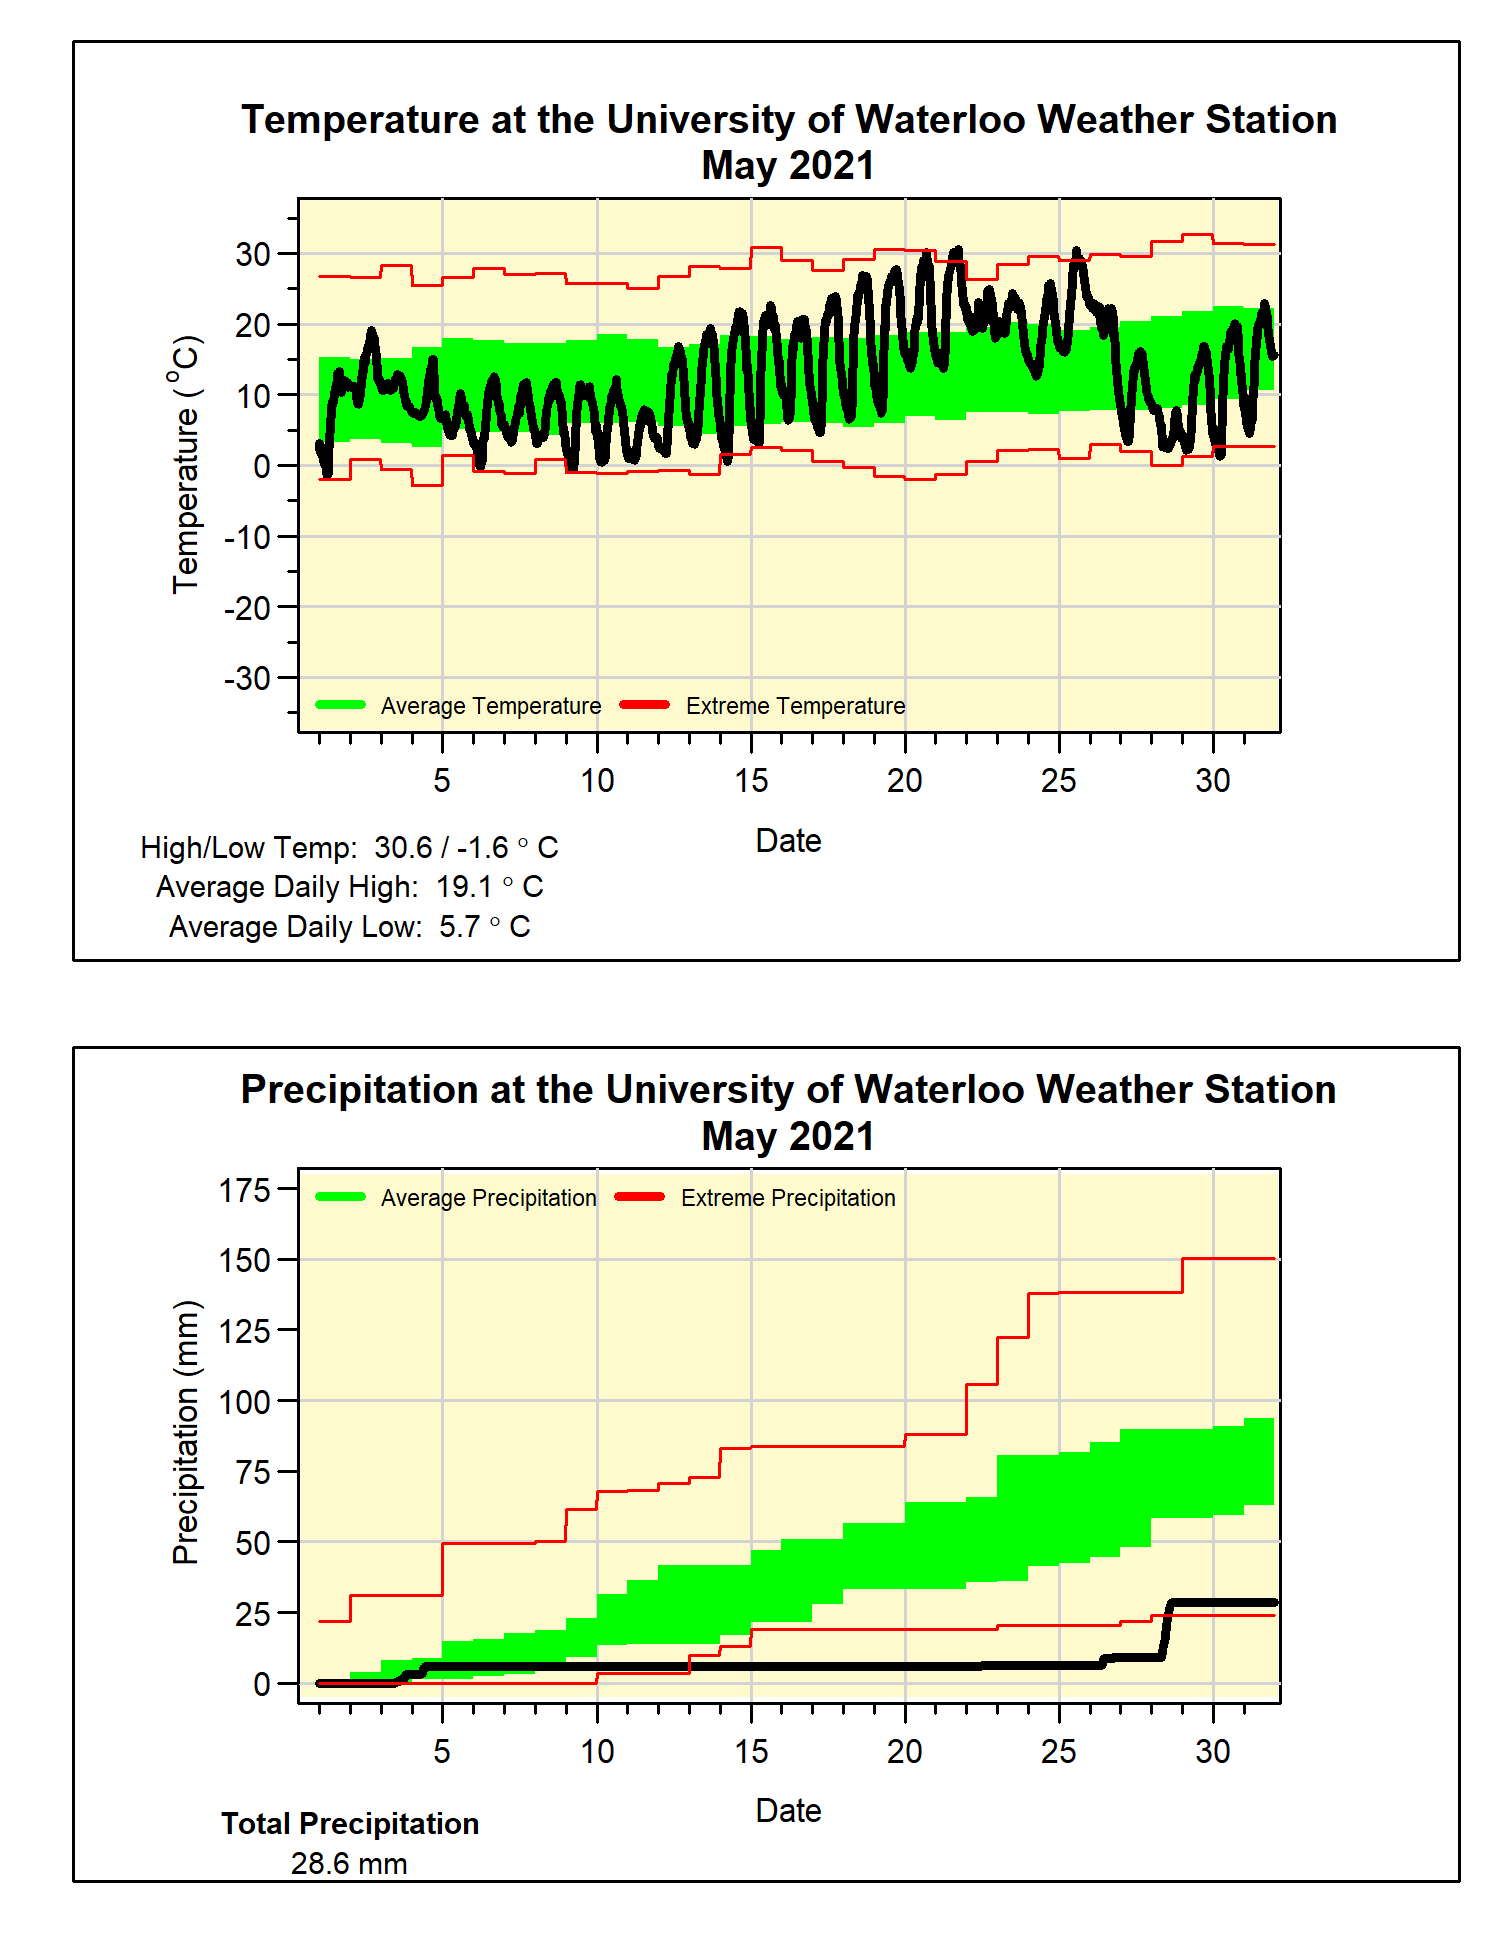
Then came April and May, which were the only two colder than average months of the year.  There were a few historical temperatures in May including: the low of -4.3°C on May 9, which was tied for the 3rd lowest May temperature in our weather history; the month saw not only the latest date (May 16) for the winner of the UW Weather Station Contest (when the temperature goes above 20°C), but this was also the latest 20°C day in the last 100 years; on the other end of the scale, on May 26, the high temperature of 31.8°C, was the 5th warmest day in May on record.

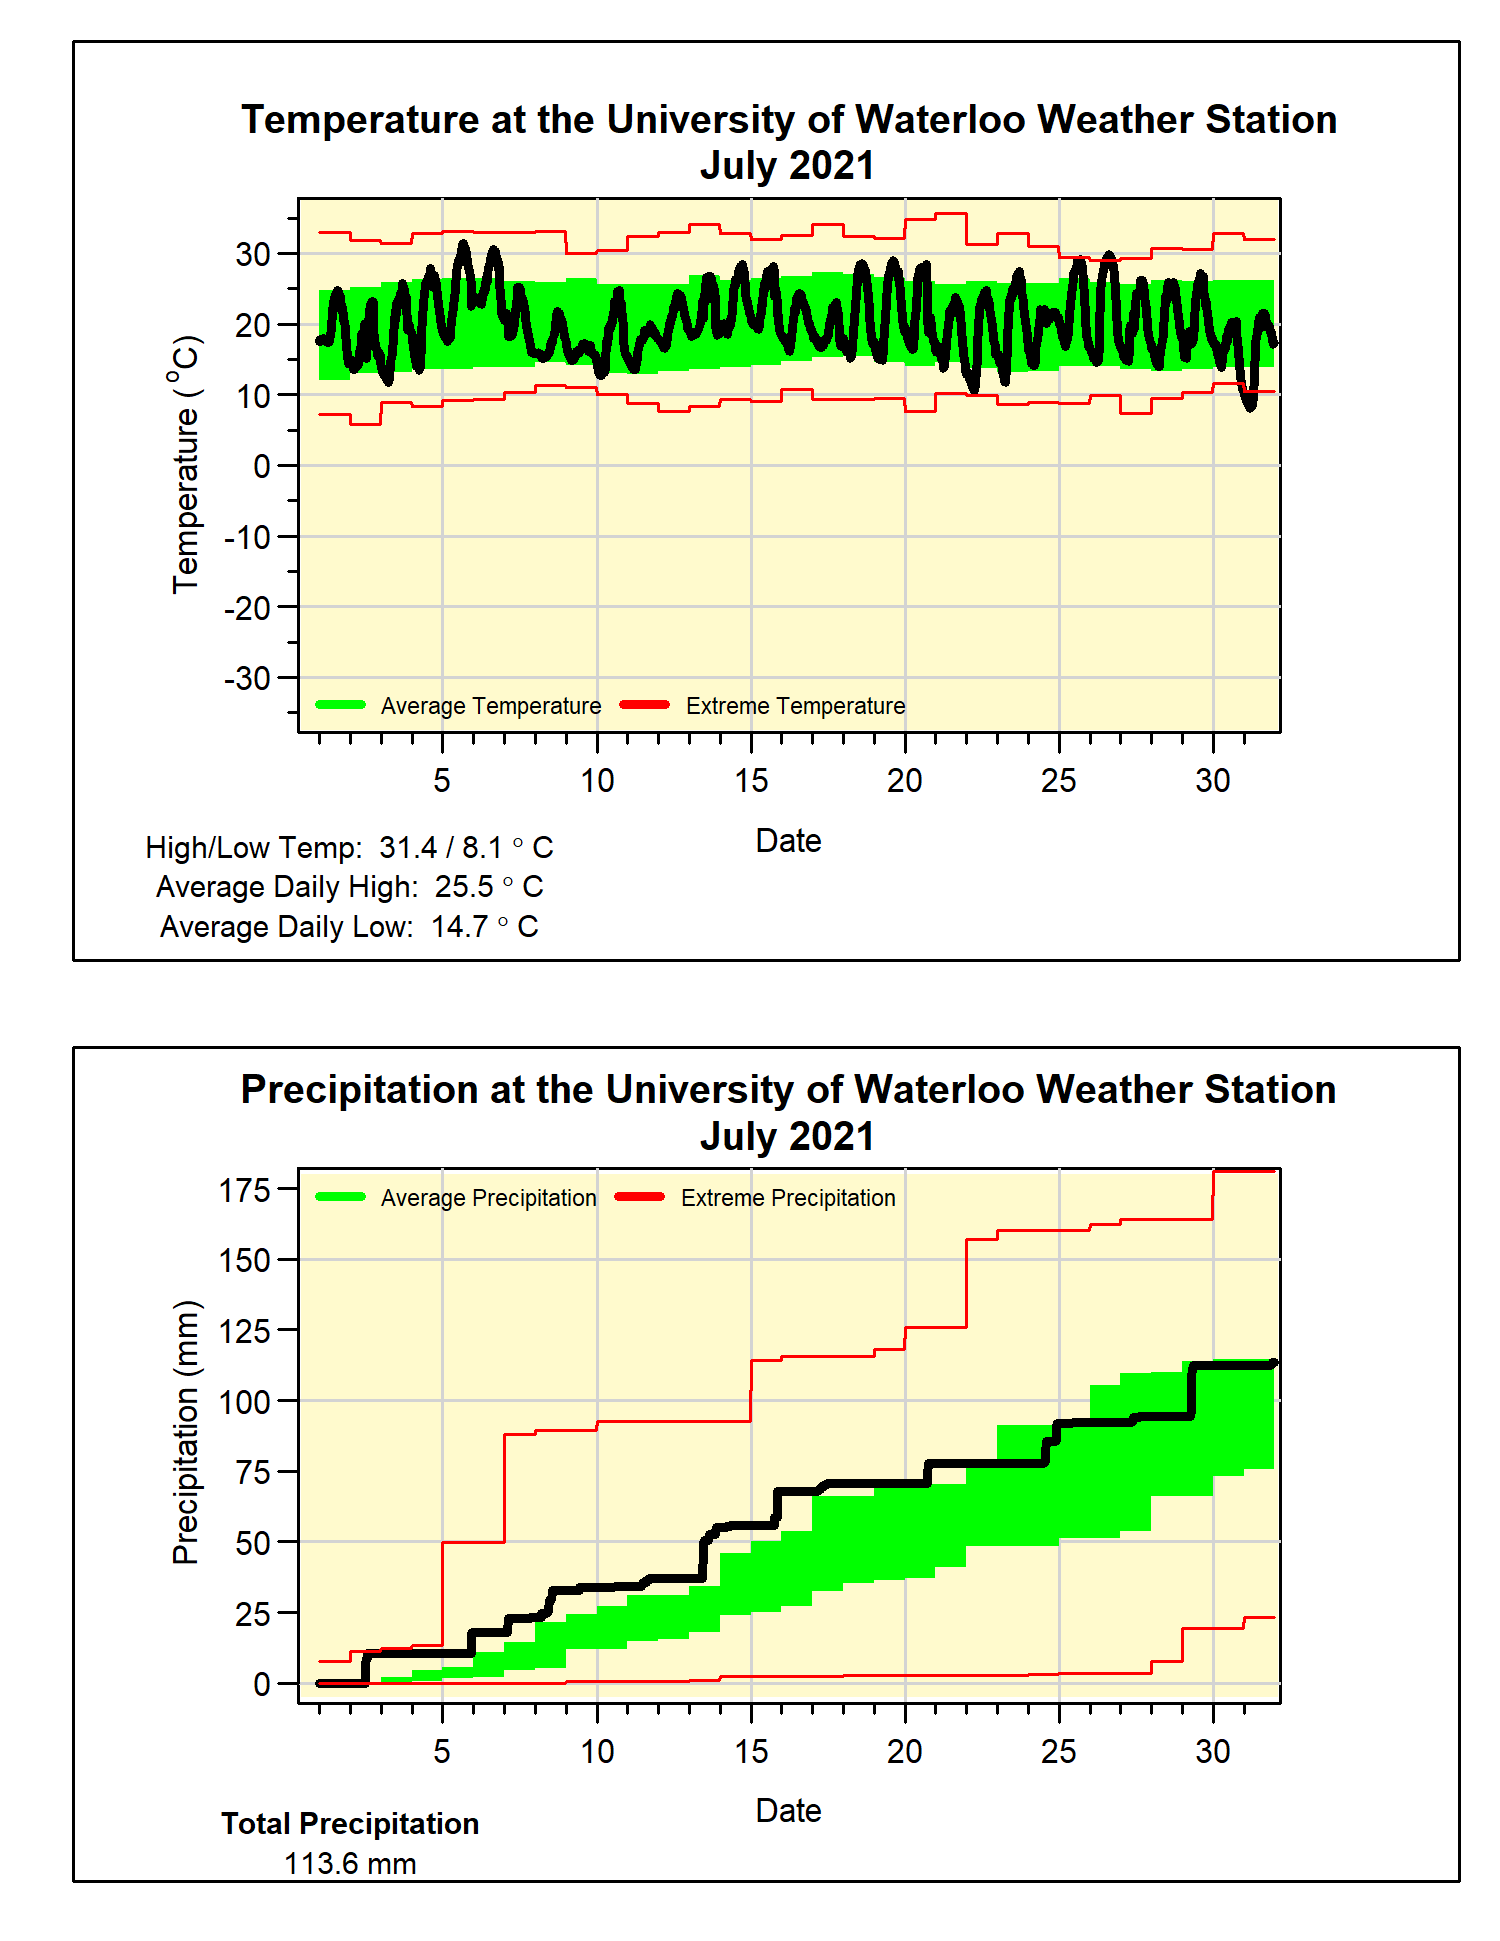
The summer months of June, July, and August were all much above average.  There were lots of really hot days in June, including 8 days above 30°C, while we typically average only 2 of those days.  July started with a string of 10 days above 30°C, which was the longest streak for any month since 1953, and the 34.5°C reported on July 9th was the hottest day of any month since Sept 10, 2013.  So it shouldn’t be a surprise that it was the third hottest July we have seen in the region’s weather history.  Although it wasn’t as hot as July, August did continue the pattern of high summer temperatures at 1.5 degrees above average, contributing to that were 6 days above 30°C, a lot more than the 2 we usually see.

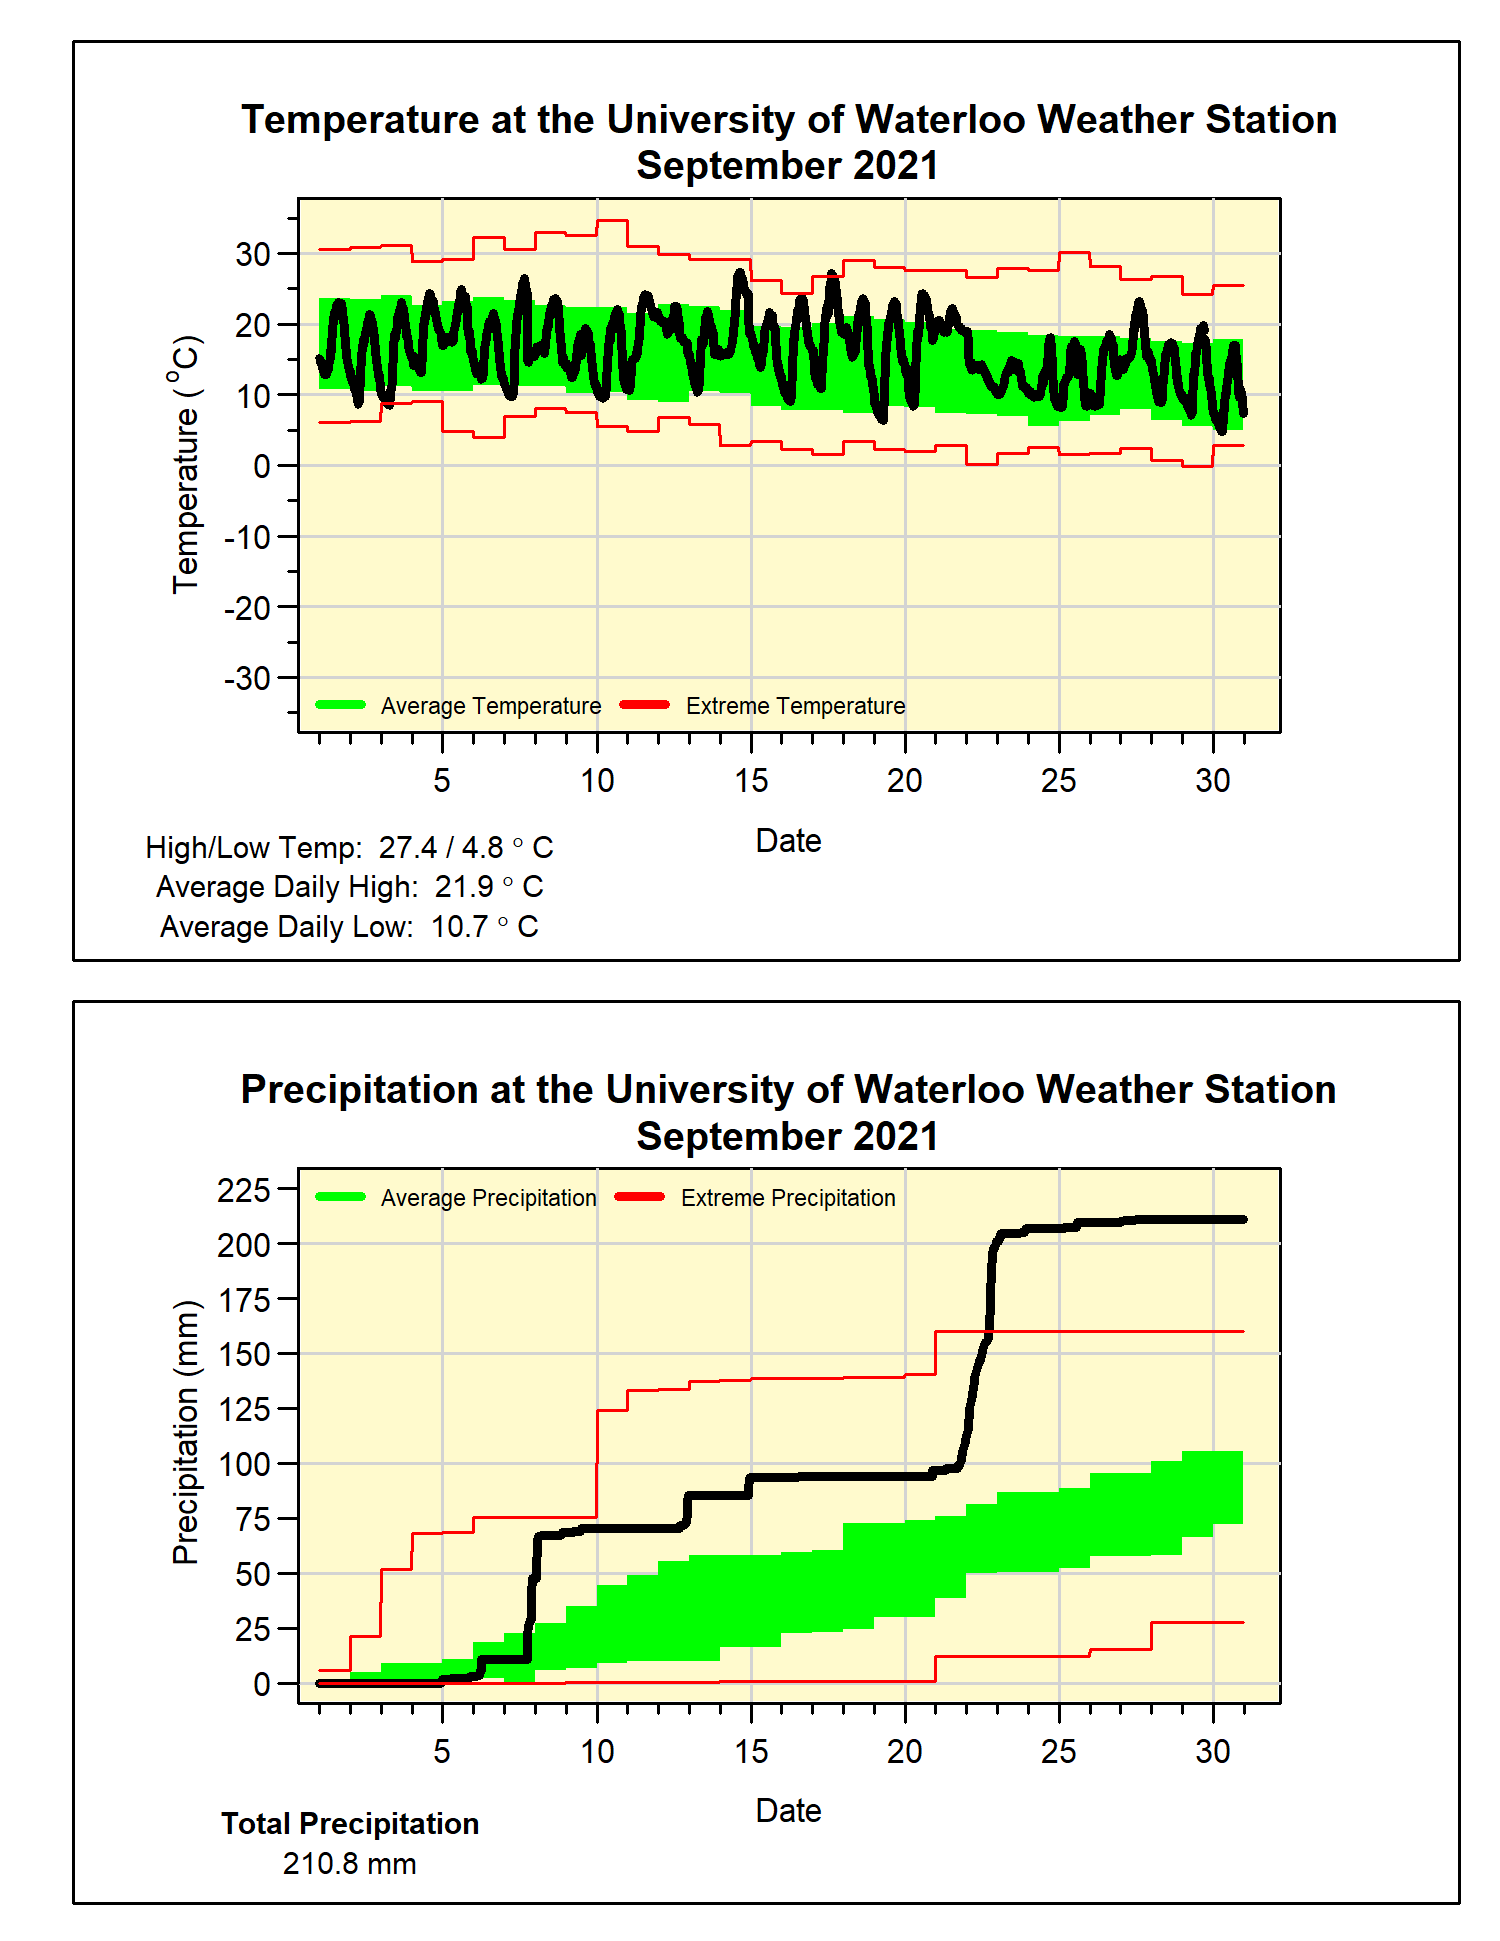
Overall, September was 0.8 degrees above average, but on the 19th the temperature went below zero for the first time since the spring.  This is the earliest it has happened in the 22 year history of the weather station and the coldest daily September temperature since September 30, 1993.

The month of October was just barely (0.1 degrees) below average, but an interesting day was the high of 24.2°C on the 23rd which was the warmest day in the second half of October since 1968.

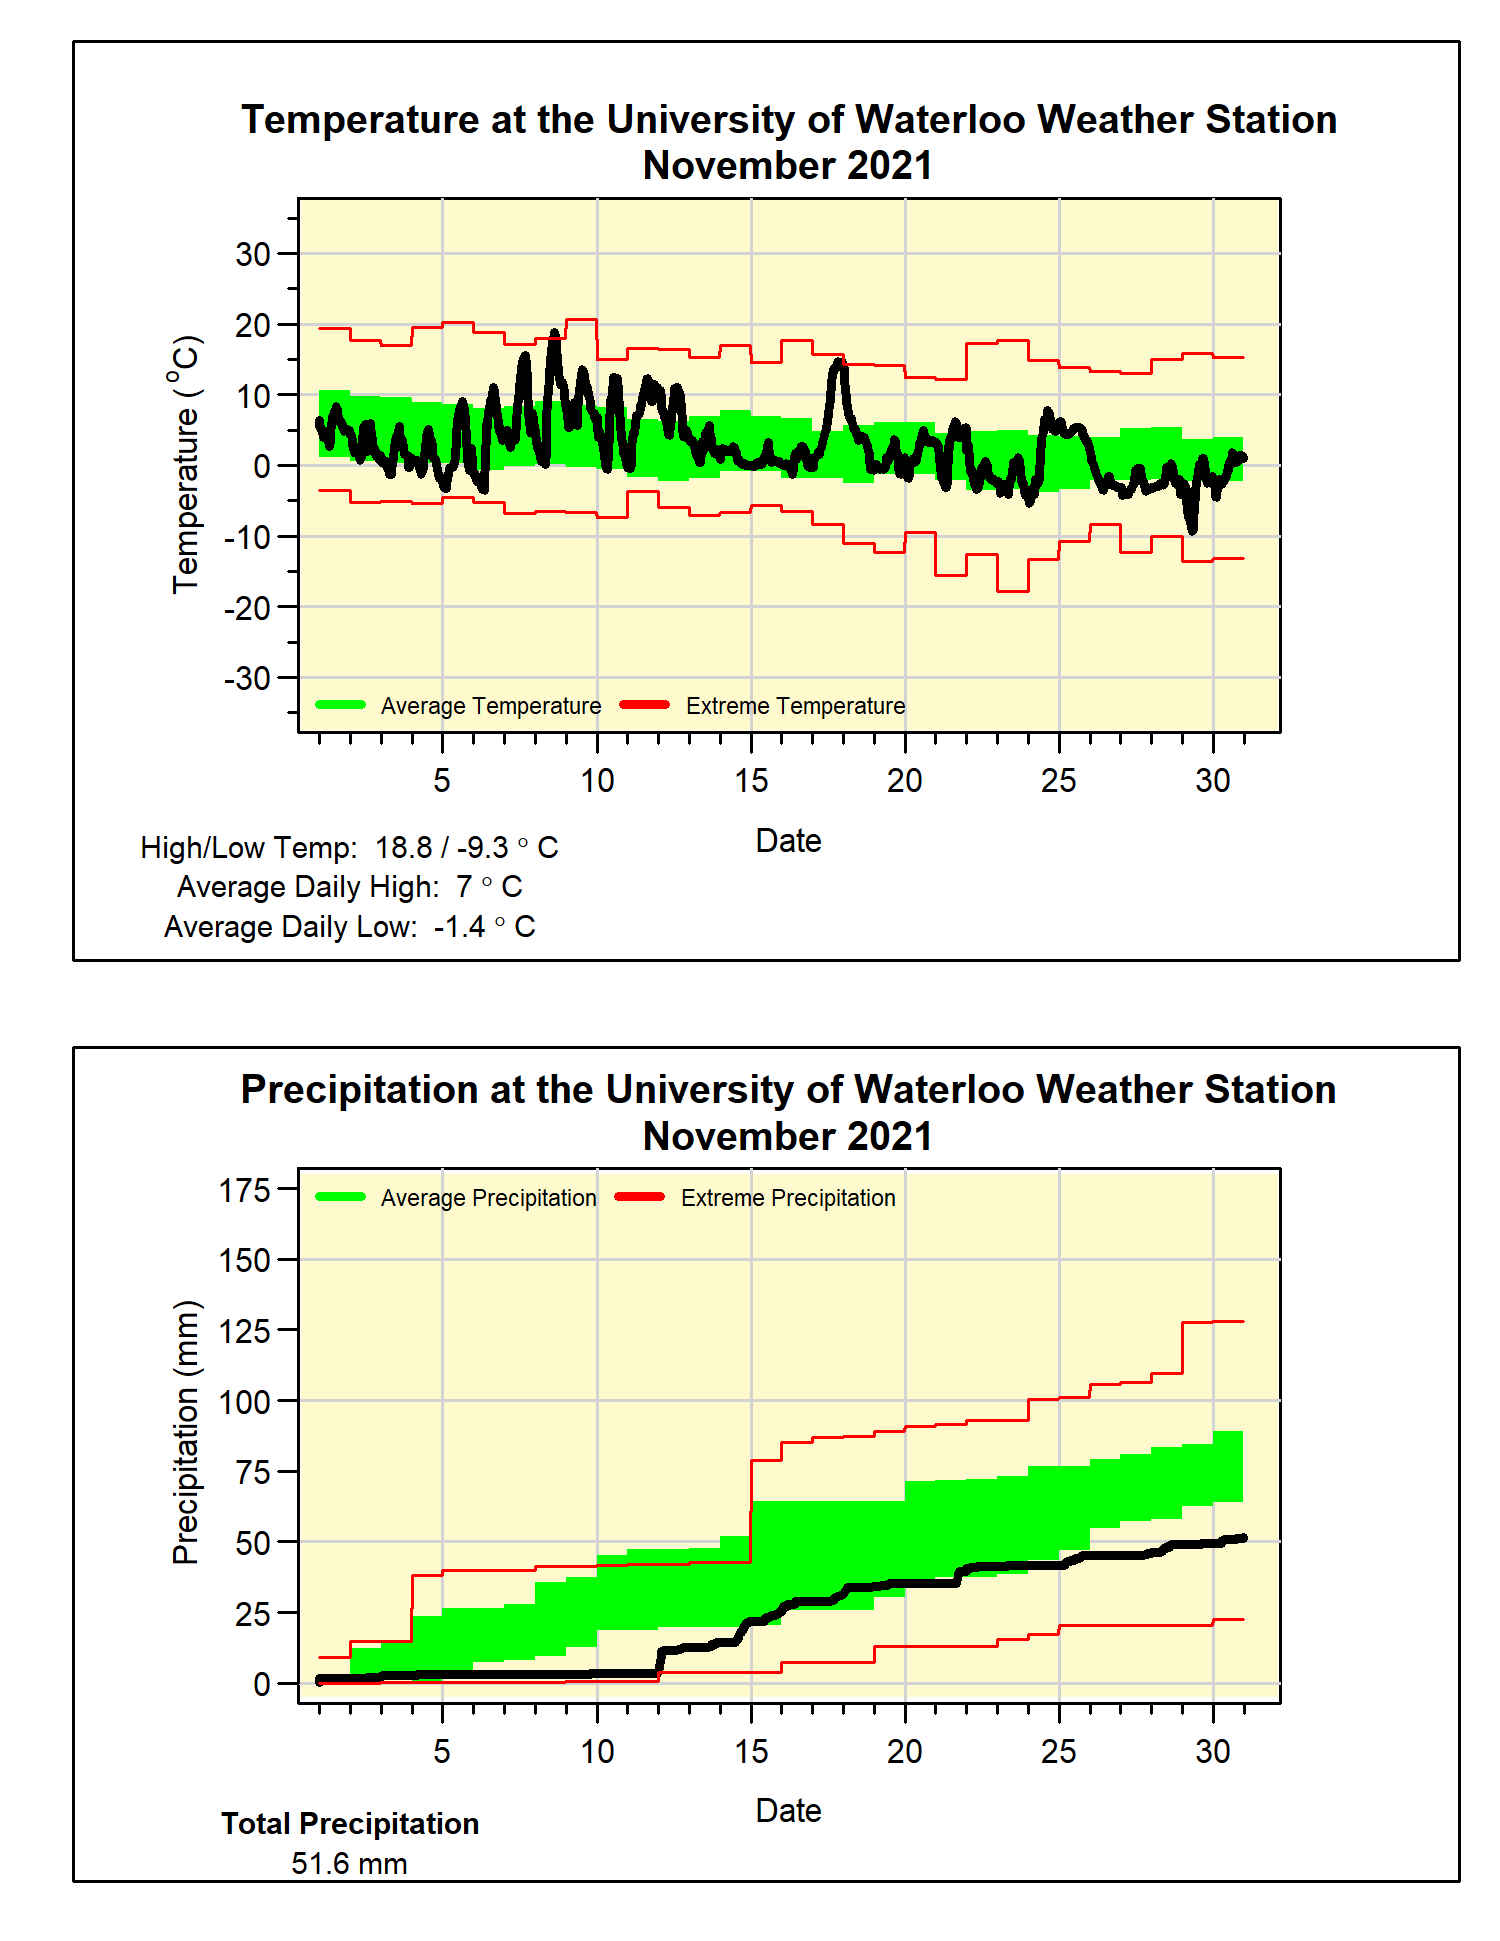
The warmer than average temperatures returned in November when it was more than 3 degrees above average, the 5th warmest November in our weather history.  This was a result of a week of record breaking temperatures at the start of the month.  The records that fell include: the high on the 9th of 23.9°C was the second highest November temperature for the region, we had 4 days in a row over 20°C which was the longest such streak in November, and finally the 8 days in a row above 15°C beat the previous longest streak of 7 days.

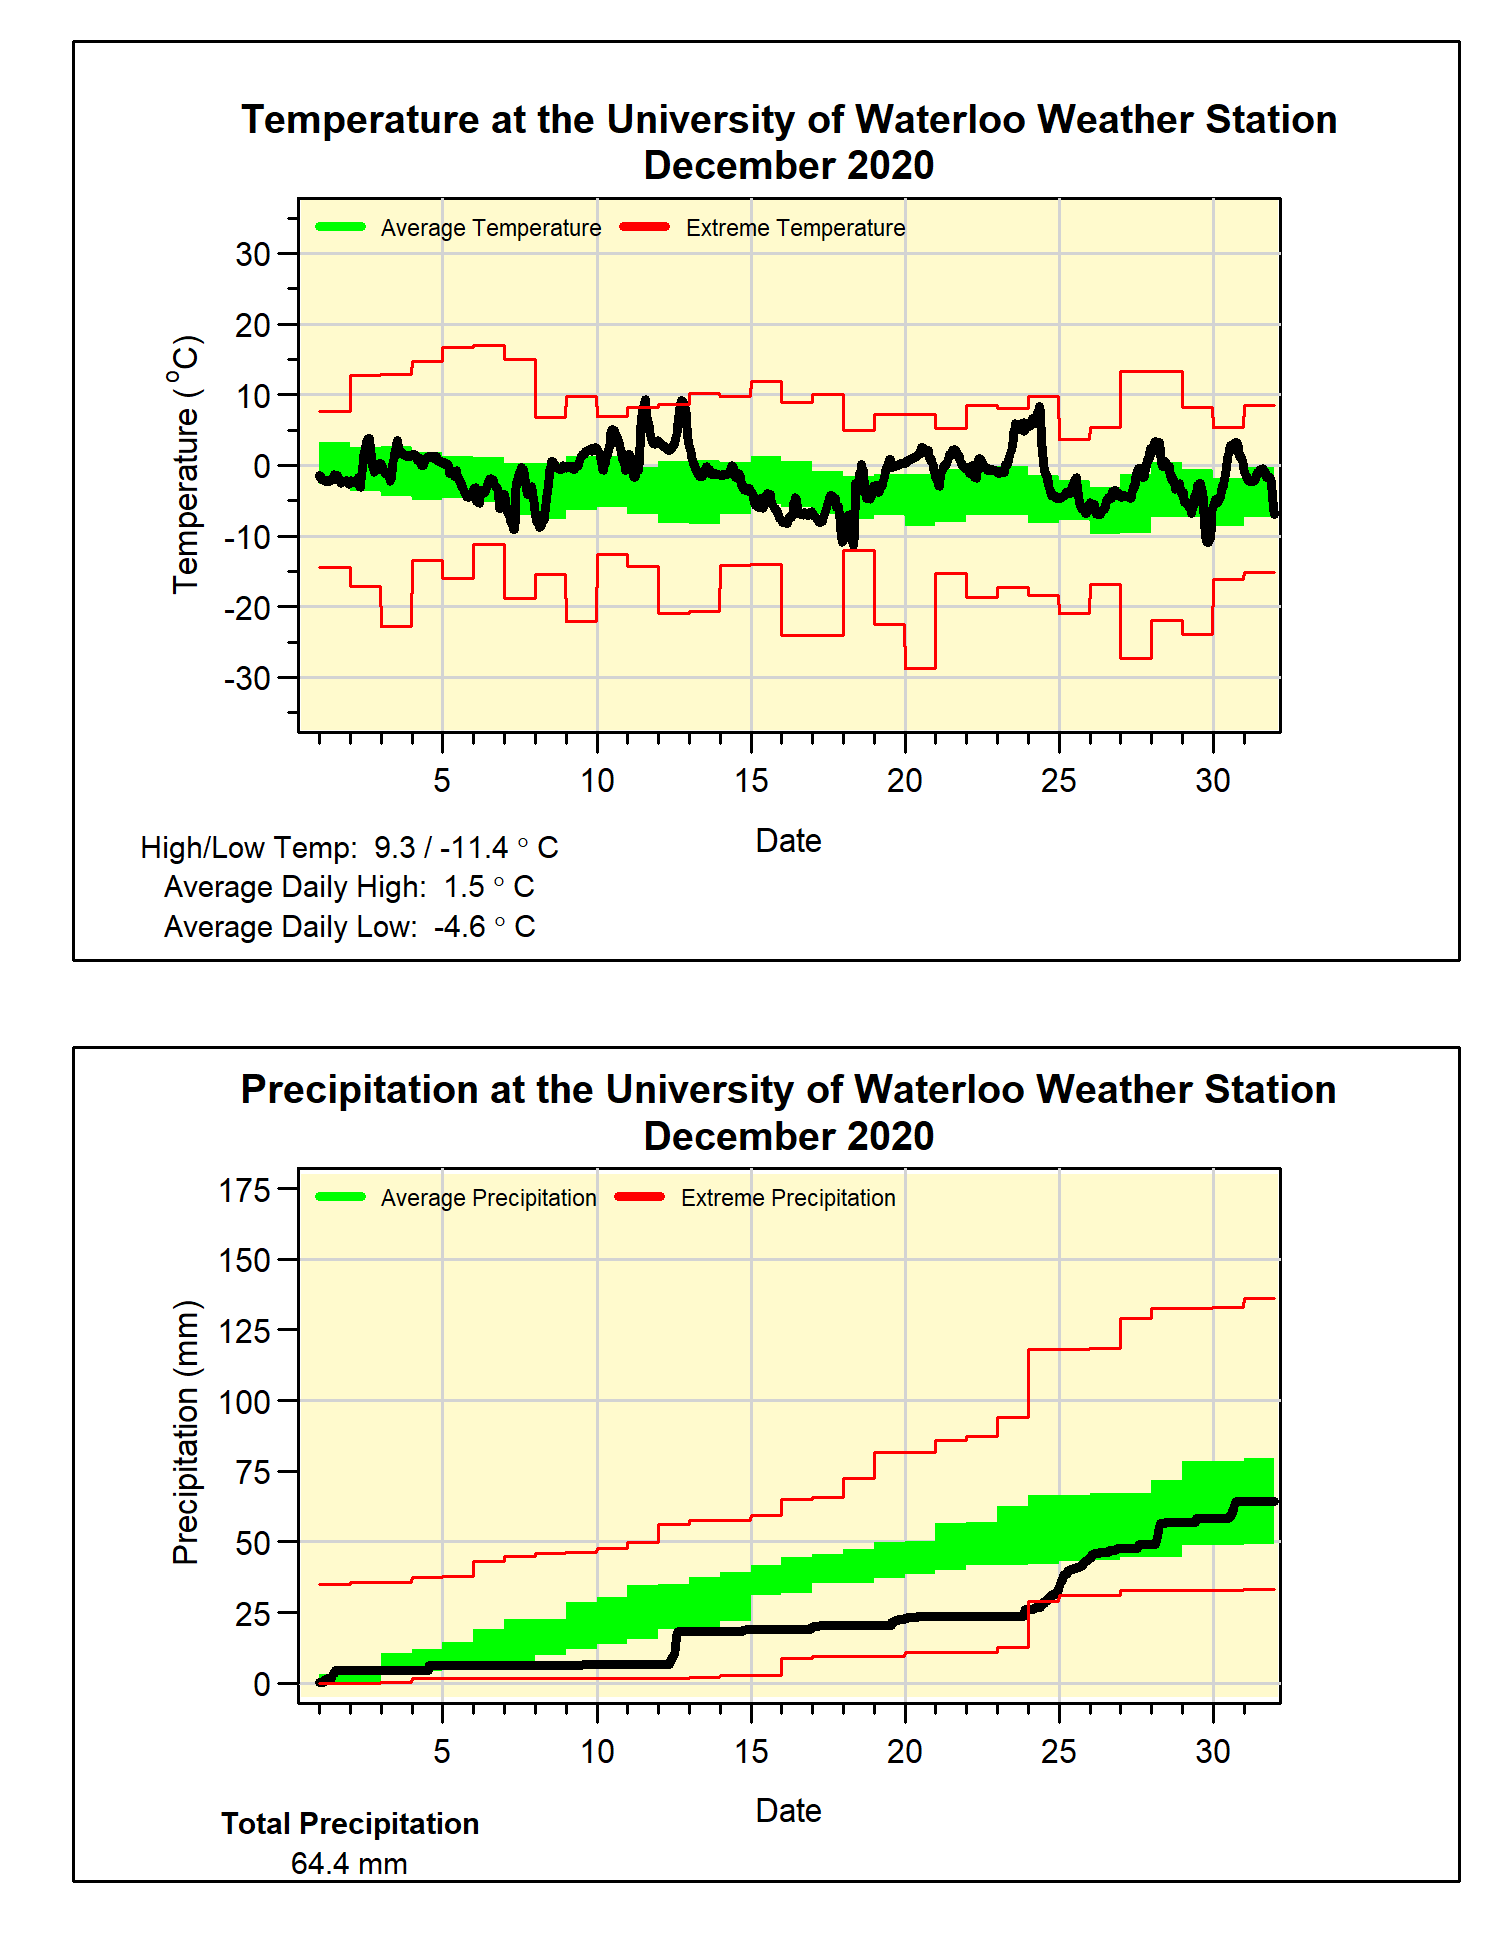
The year ended with a warm December, that was 1.7 degrees higher than average with only a few cold days during the month.

The biggest story for precipitation was the heavy rain that fell on January 11th, it started in the morning and lasted the entire day, ending with a total of 79.6 mm.  This was almost double the previous record single day’s precipitation in January of 43.0 mm and more than the average for the entire month.  Not only that, it was the wettest day for any month since July 7, 1991 when 82.0 mm came down.  This resulted in it being the wettest January on record in the region.  

The other record that fell was the highest 15 minute precipitation in the history of the UW Weather Station, when we experienced 24.8 mm of rain at 6:45 pm on July 10th.  Note that before the establishment of the UW Weather station in 1998 there were no measurements of 15 minute precipitation in the region.

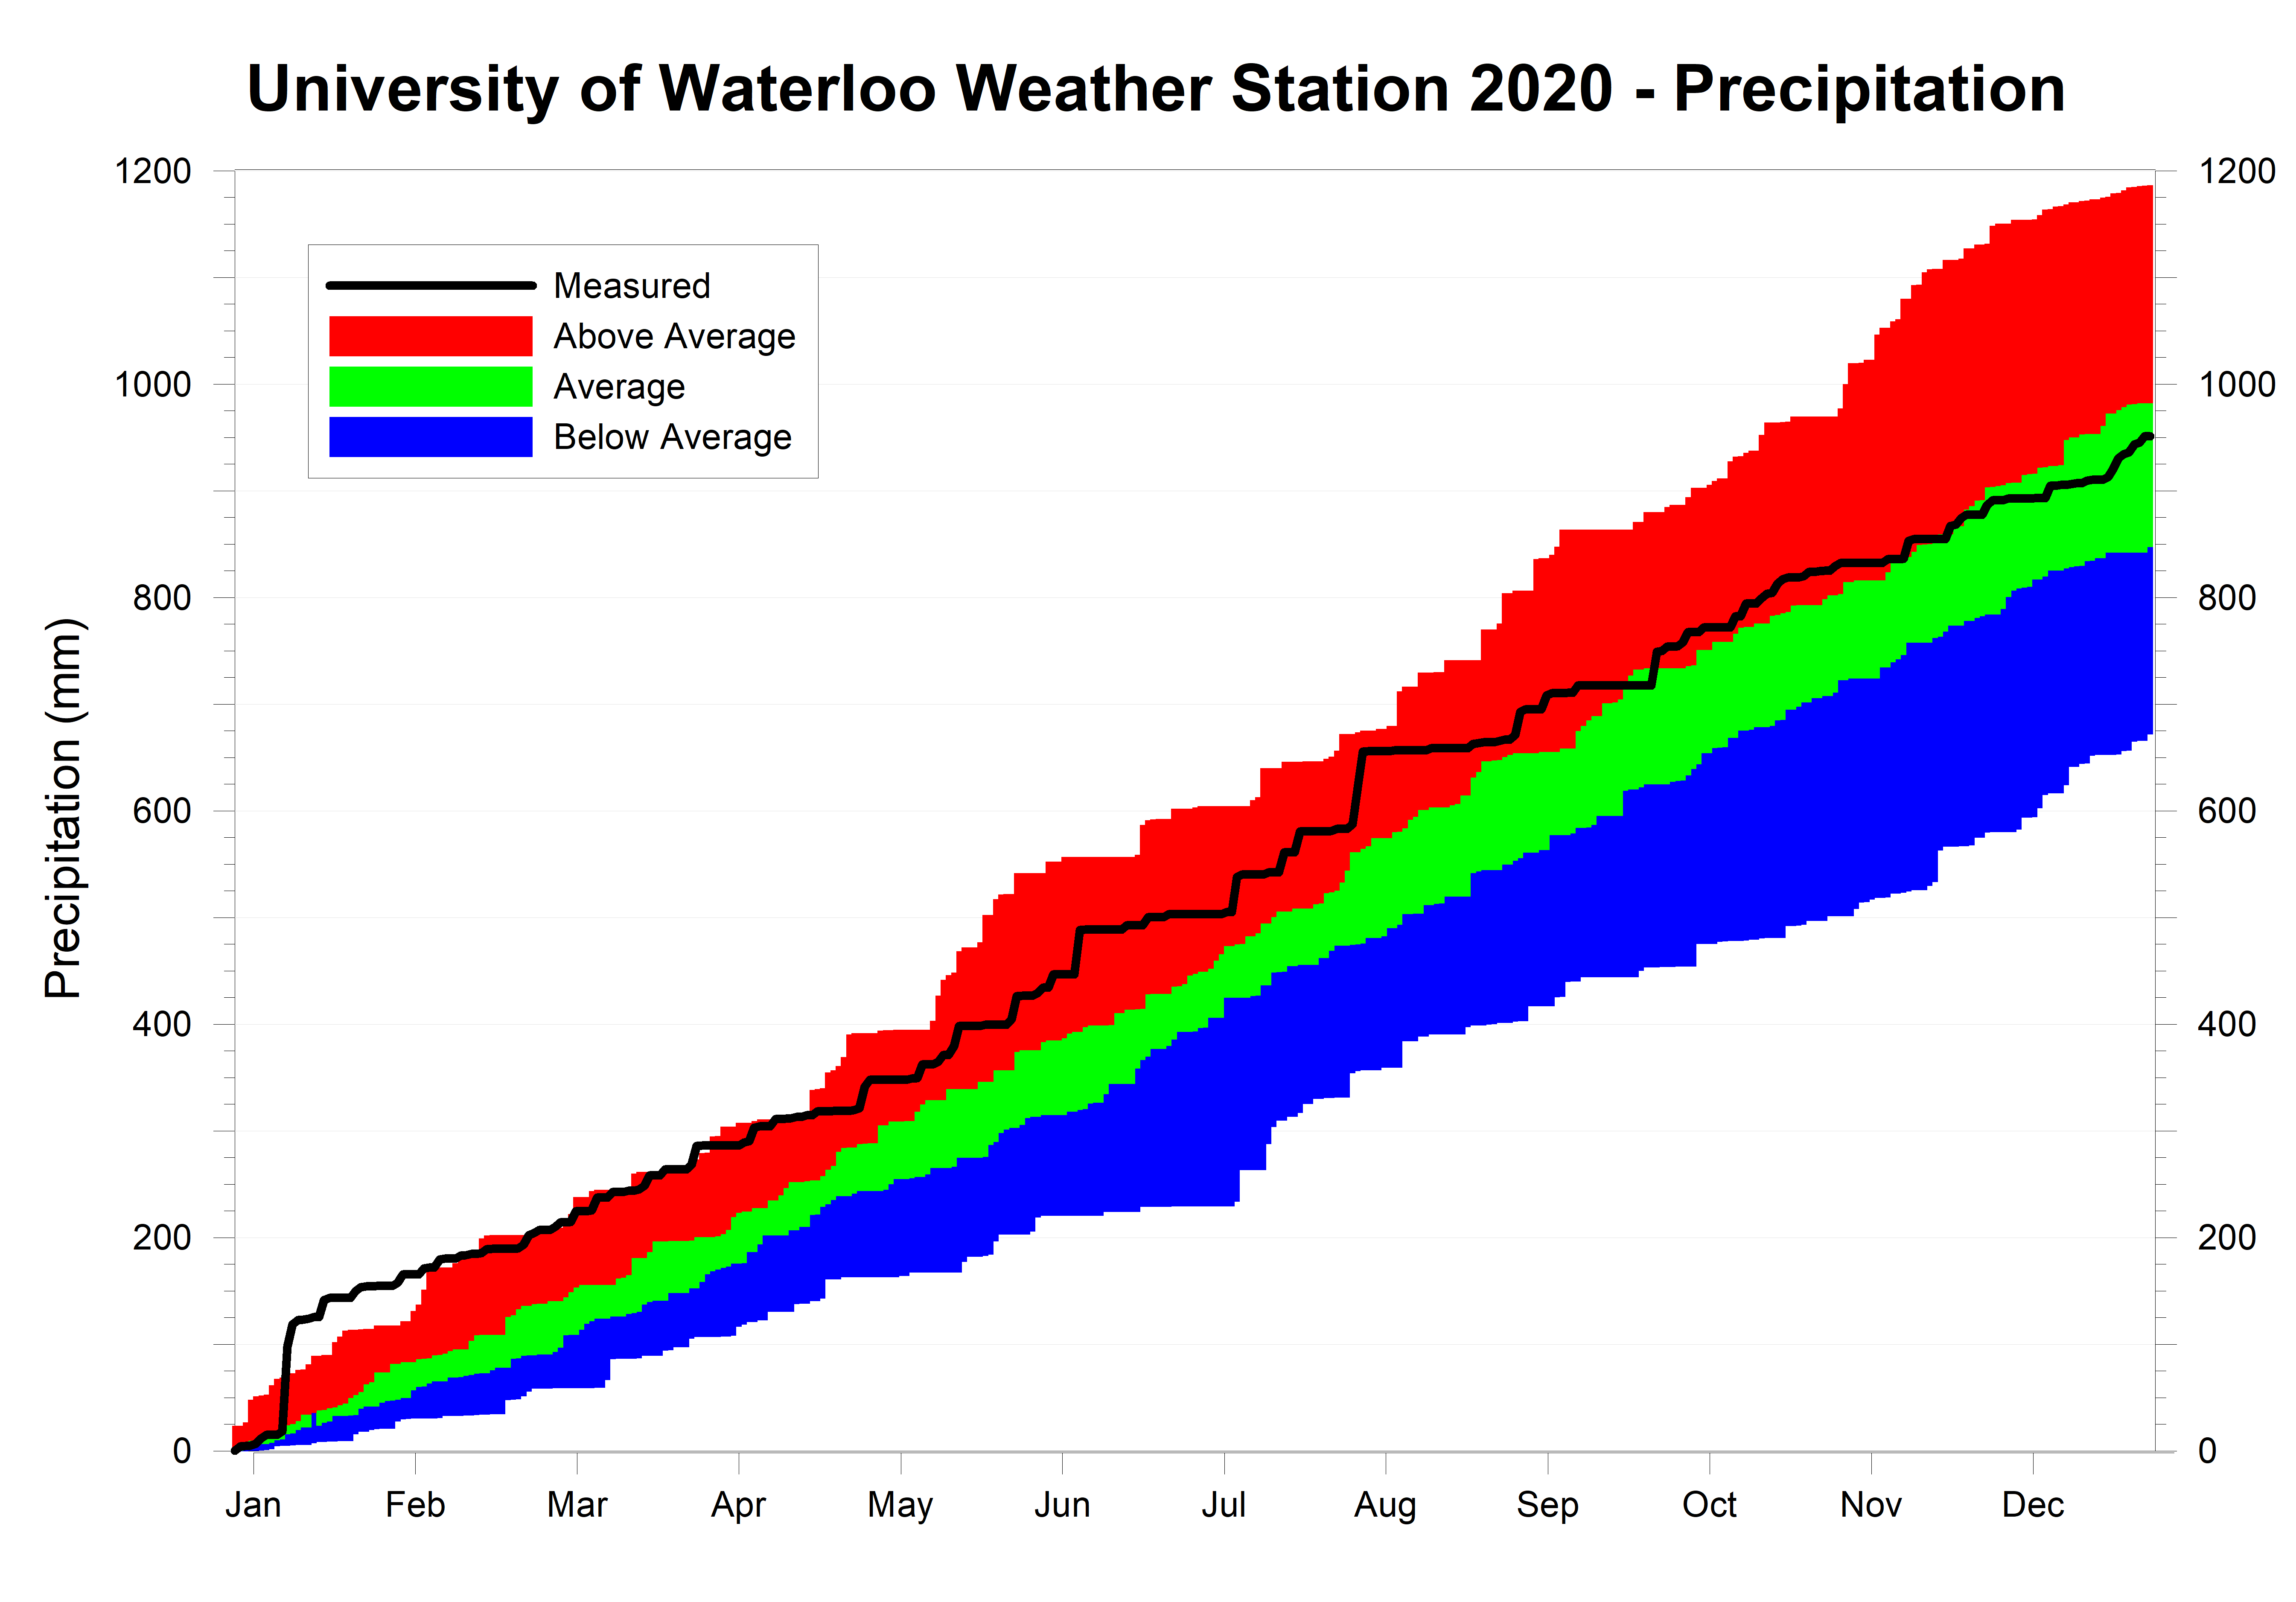
After January, the rest of the year didn’t see any other extreme high or low months for precipitation, with the rest of the year (apart from March) seeing average precipitation.  Not surprisingly, the total precipitation was 950.9 mm, which is just a little over the average of 916.3 mm.

Frank Seglenieks
weather@uwaterloo.ca
University of Waterloo Weather Station Coordinator

Summary for 2020 (averages from 1981-2010 data for the Waterloo-Wellington Airport):

Average Daily High Temperature: 13.59°C (average 12.05ºC)
Average Daily Low Temperature: 3.40°C  (average 1.94ºC)
Total Precipitation: 950.9 mm (average 916.3 mm) 

Extremes for 2020 (all time UW weather station extreme in brackets):

Highest temperature:
34.4°C Jul 9 4:00 pm (35.7 °C July 21, 2011 3:00 pm)
Highest humidex:
43.3 Jul 10 12:30 pm (47.6 July 17, 2013 5:00 pm)
Lowest temperature:
-27.5°C Feb 14 6:30 am (-35.5 °C Feb 16, 2015 7:00 am)
Lowest windchill:
-26.2 Feb 15 2:00 am (-47.3 Feb 15, 2015 6:15 am)
Greatest temperature drop in 15 minutes:
-6.6°C Jun 5 5:15 pm (-9.5 °C July 19, 2013 5:00 pm)
Greatest temperature drop in 60 minutes:
-9.9°C Jun 05 4:45-5:45 pm (-11.8 °C July 19, 2013 4:45-5:45 pm)
Greatest temperature rise in 15 minutes:
4.0°C Feb 17 8:45 am (8.6 °C Jan 2, 2001 6:15 am)
Greatest temperature rise in 60 minutes:
6.7°C Feb 14 8:00 - 9:00 am (12.2 °C Jan 2, 2001 4:45-5:45 am)
Highest precipitation in 15 minutes:
24.8 mm Jul 10 6:45-7:00 pm (New record)
Highest precipitation in 60 minutes:
29.2 mm Jul 10 6:45-7:45 pm (36.7 mm Jun 16, 1998 3:30-4:30 pm)
Highest Precipitation in 1 day:
79.6 mm Aug 18 (New record)
Highest 15 minute average wind speed:
20.8 km/h Nov 15 3:45 pm (44.6 km/h Mar 9, 2002 6:30 pm)
Highest wind gust (only available since 2015):
36.7 km/h Nov 15 4:30 pm (44.4 km/h Apr 13, 2015 2:30 pm)
Last time the temperature went below 0 before the summer:
May 13 6:45 am (Has ranged between Apr 26- May 23)
First time the temperature went below 0 after the summer:
Sep 19 3:00 am (Has ranged between Oct 2-29, earliest date on record)
Length of frost-free season:
129 Days (Has ranged between 146-175 days, smallest on record)
Highest daily low temperature:
21.1°C Jul 27 (25.3 °C Aug 1, 2006)
Lowest daily high temperature:
-7.6°C Jan 30 (-20.6 °C Feb 15, 2015)
Largest daily temperature range:
21.0°C Mar 1 (29.6 °C Feb 19, 2007)
Smallest daily temperature range:
0.80°C Feb 11 (0.45 °C Dec 7, 2005)

(averages are calculated from 1981-2010 data for the Waterloo-Wellington Airport)


Click on the image below to see the temperature chart:

Click on the image below to see the precipitation chart:


Friday, January 1, 2021

December 2020 Summary

 A warm December with average precipitation

With the only cold streak lasting just a few days in the middle of the month, it is not surprising that overall temperature was 1.7 degrees warmer than average.  This now makes 6 of the last 7 Decembers that have been warmer than average 

There wasn’t much precipitation in the first 3 weeks of the month, but a wet last week put the total of 64.4 mm close to the average of 71.2 mm.

December saw 44.5 cm of snow, a little more than the average of 37.2 cm for the month. 

Summary for December 2020:

Maximum Temperature 9.3°C
Minimum Temperature -11.4°C
Average Daily High Temperature 1.5°C (Long term average 0.2°C)
Average Daily Low Temperature -4.6°C (Long term average -6.8°C)
Total Precipitation 64.4 mm (Long term average 71.2 mm)

(Long term averages based on 1981-2010 data for the Waterloo-Wellington Airport)