Thursday, December 1, 2016

November 2016 Summary


Another warm November with average precipitation


It turns out that this November was really close to last November in terms of both temperature and precipitation.  For temperature it was just over 3 degrees above average, tying it with last year for 6th warmest since records began in the area 100 years ago.

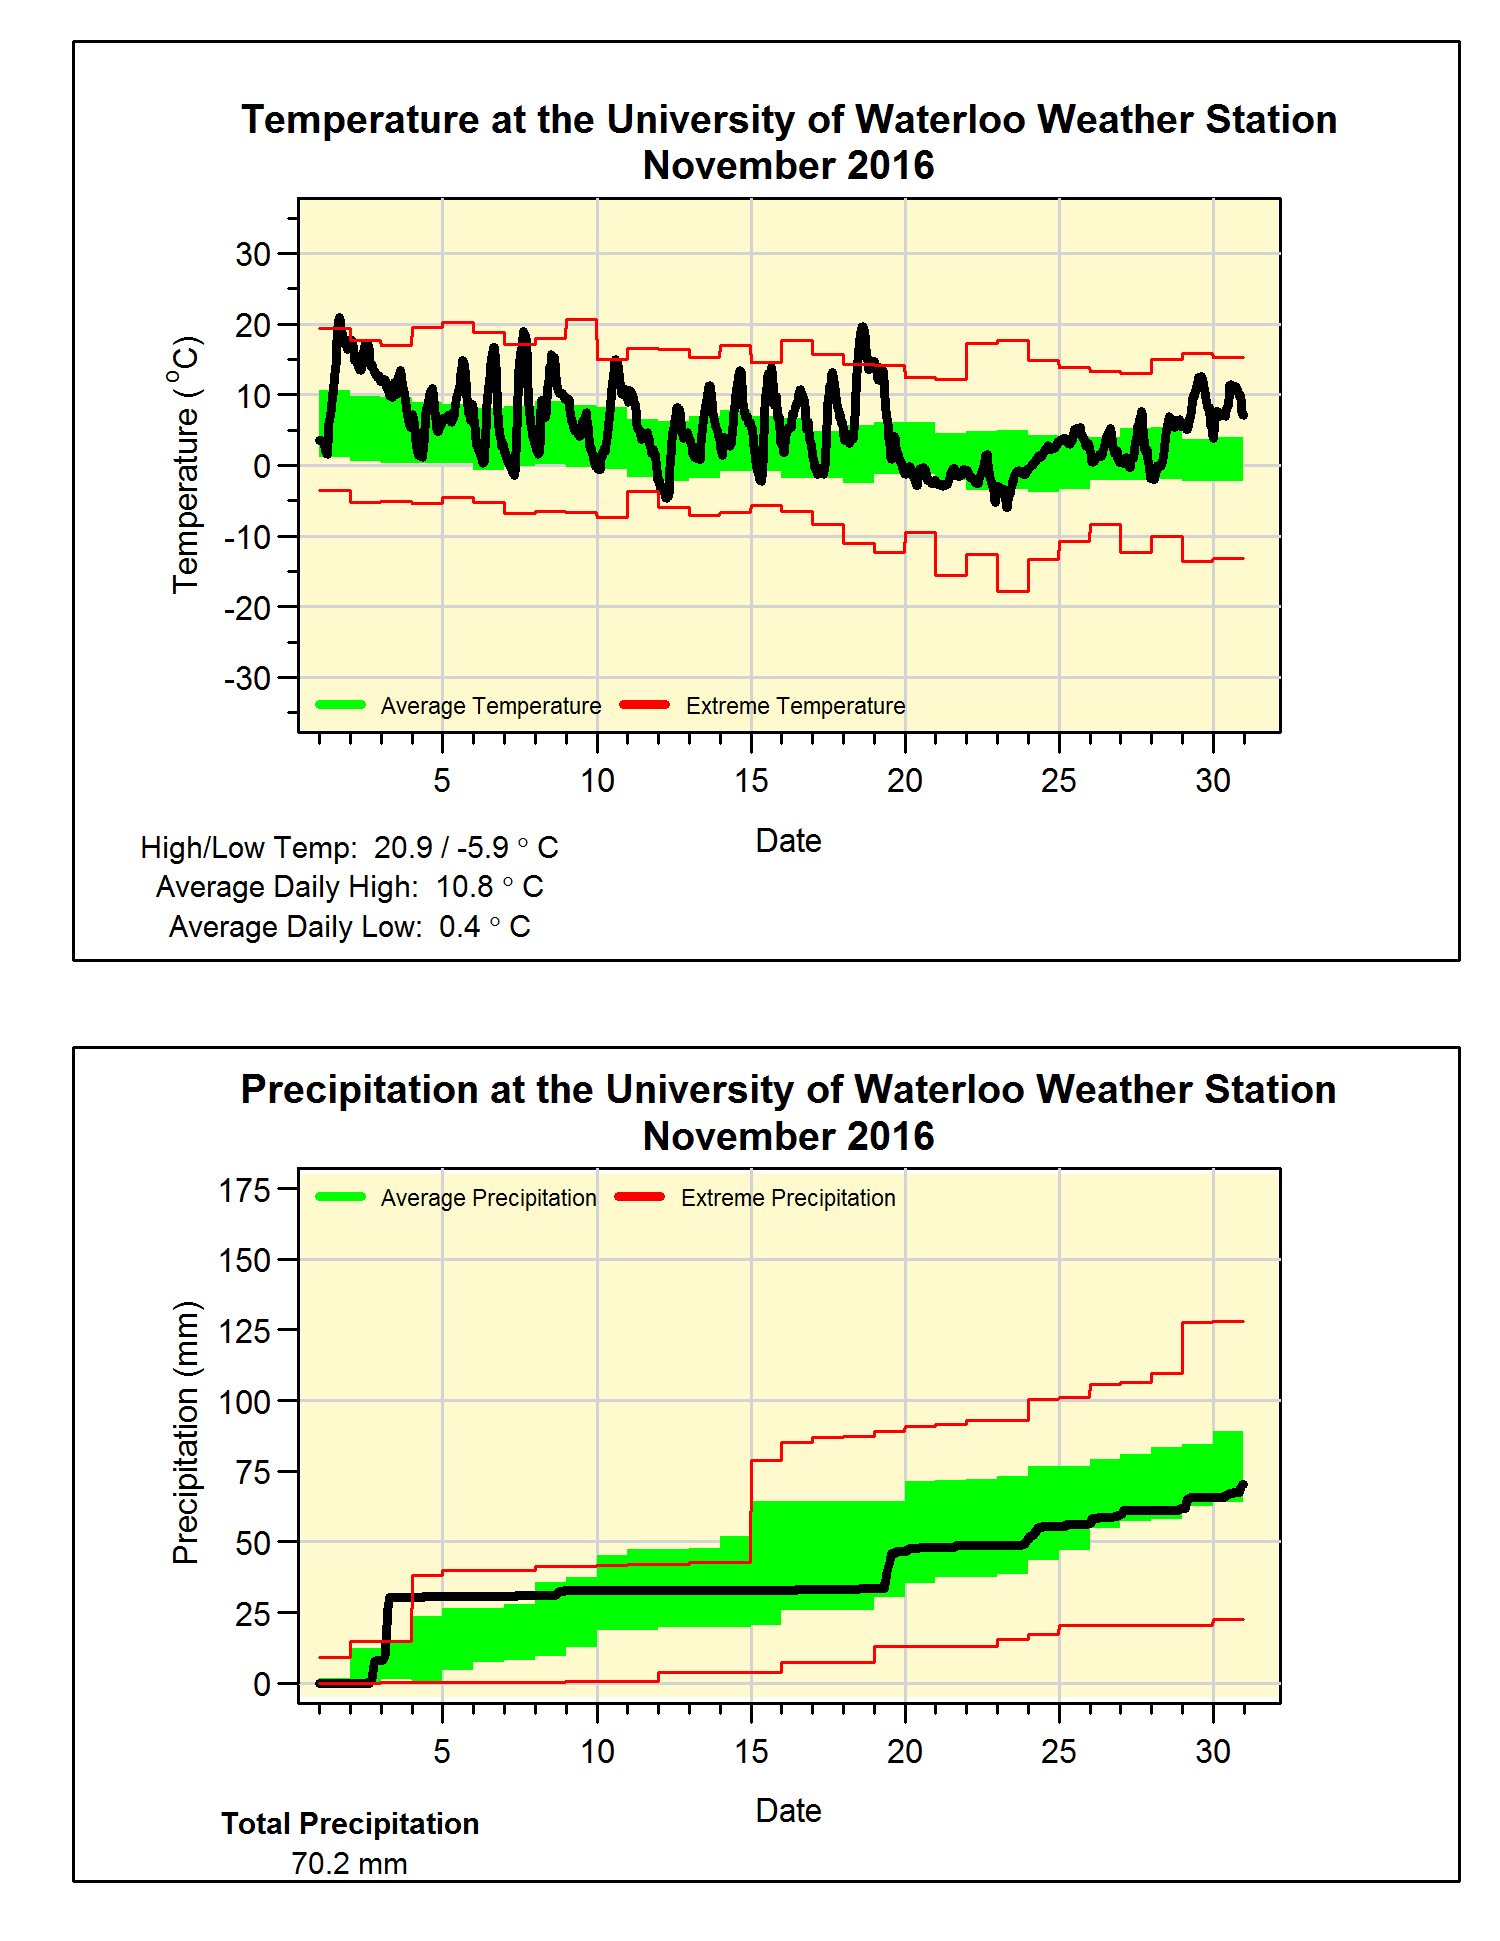
First fun fact, although the overall temperature was only tied for 6th, there were lots of temperature variations between the daytime and nighttime temperatures at the start of the month.  This resulted in the average of the daily high temperatures of 10.8°C coming in as the highest daily high temperatures for November.

Second fun fact, there were 20 days when the temperature was over 10°C in November, the highest number in the historical records in the region.

From the temperature graph you can see that the grey “Vancouver” weather started on the 20th with little variation between the daytime and nighttime temperatures.

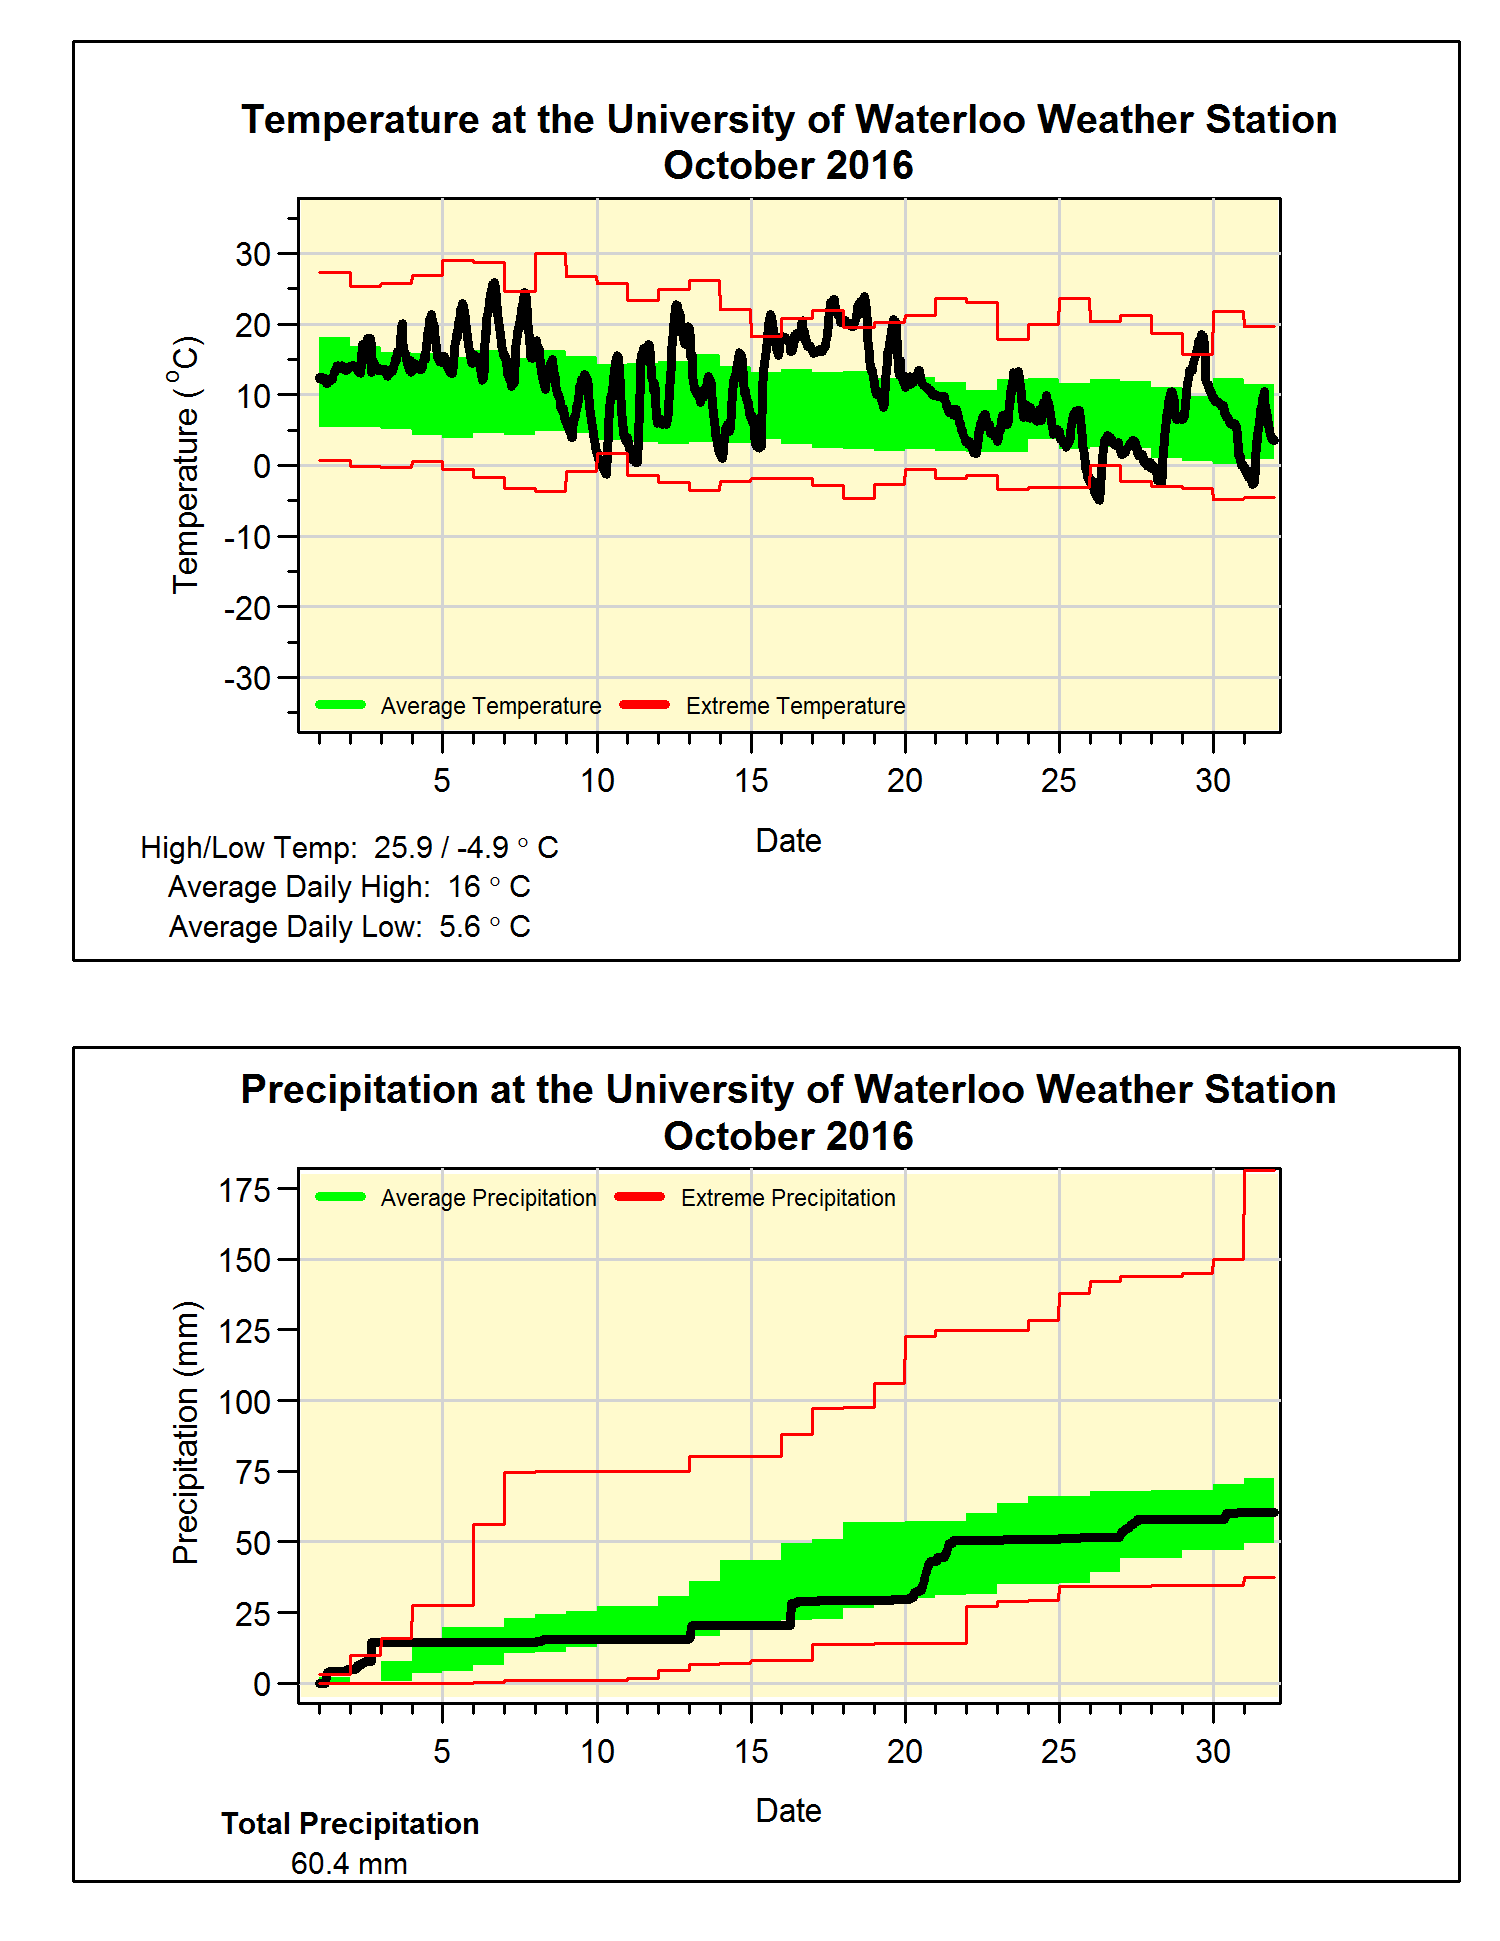
The precipitation total was 70.2 mm (compared to 68.2 mm last year), although this is below the average of 87.1 mm, it is within the average range for November.  The amount of precipitation for the year so far is 799.6 mm which is below the average of 832.9 mm.  It also means that we only need about 50 mm in December to get within the average range for 2016.

And yes we have to start talking about snow, however, there was only 2.5 cm recorded compared to the November average of 13 cm.

Summary for November 2016:
Maximum Temperature 20.9°C
Minimum Temperature -5.9°C
Average Daily High Temperature 10.8°C (Long term average 6.3°C)
Average Daily Low Temperature 0.4°C (Long term average -1.4°C)
Total Precipitation 70.2 mm (Long term average 87.1 mm)

(Long term averages based on 1981-2010 data for the Waterloo Wellington Airport)

Friday, November 11, 2016

UW Weather Station Archive Update


Ever since we switched the equipment at the UW Weather Station back in 2015 we haven't had been able to put up an archive of historical data.

As we have always prided ourselves in the fact that every reading we have ever taken is available to be downloaded, not being able to have a working archive was something that has frustrated me.

After 10 hours of coding today I finally have a system where the *.csv files on the Data Archives page will be updated every 15 minutes.  Unfortunately it will be bit longer before there will be the same functionality as we had before with being able to get data for specific data ranges.

Access the csv archive here:

http://weather.uwaterloo.ca/data.html#archive

Please leave any feedback about the archive in the comments.

Saturday, November 5, 2016

October 2016 Summary


Second warmest October in 45 years with average precipitation 

It was another hot month with the average October temperature coming in at 2.6 degrees above average, this made it the second warmest since 1971 (after 2007** See Note below).  However, it is also interesting that the on the 26th the temperature got down to -4.9°C which was the coldest October temperature in the region since Oct 14, 1993.

The temperature went below zero on October 10th, this was the first time this had happened since April 30.  That means we had 163 days of above zero temperatures, which is pretty much the average length we have seen in the past 15 years (by the way I’m trying to avoid calling it the growing season or frost-free days as those terms seem to cause a lot of confusion).

Although the total precipitation for the month of 60.4 mm was below the average of 67.4 mm, it was close enough to be within the average range.  The total for the year so far of 729.4 mm is still a bit below the average for this time of year of 750.6 mm.


Summary for October 2016:
Maximum Temperature 25.9°C
Minimum Temperature -4.9°C
Average Daily High Temperature 16.0°C (Long term average 13.5°C)
Average Daily Low Temperature 5.6°C (Long term average 2.9°C)
Total Precipitation 60.4 mm (Long term average 67.4 mm)

**Note:  The first version of this summary mistakenly stated that October 2016 was the warmest in 45 years when in fact it was the second warmest.


(Long term averages based on 1981-2010 data for the Waterloo Wellington Airport)

Sunday, October 2, 2016

September 2016 Summary

A very hot September and back to the dry 

Just like August, September was 3.3 degrees above average and just like the previous month it was also the 5th hottest in the 100 years of records in the region.  But whereas last time we had to go back to 1959 to find a hotter month this time we only have to go back to last year when September was over 4 degrees above average.

This year there were a couple of days over 30 early in the month and there was another warm streak in the middle.  For the last week the temperature really dropped and although it might have seemed a lot colder it actually just went down to the average.

We might have to soon start using the D word again as this month only saw 28.2 mm of precipitation, this is less than a third of the average of 87.8 mm.  The annual precipitation total has been jumping around the average all year and with this dry month we have gone under again (669.0 mm this year – 685.2 mm average).


Summary for September 2016:
Maximum Temperature 32.8°C
Minimum Temperature 3.3°C
Average Daily High Temperature 24.2°C (Long term average 20.4°C)
Average Daily Low Temperature 11.4°C (Long term average 8.6°C)
Total Precipitation 28.2 mm (Long term average 87.8 mm)

(Long term averages based on 1981-2010 data for the Waterloo Wellington Airport)

Sunday, September 4, 2016

August 2016 Summary


The hottest August in 55 years and the wettest in 30 

The month of August was the hottest we have seen since 1959 and the 5th hottest in the 100 years of records in the region.  There was only 1 day that was colder than average and that was only by a less than a degree.  The overall temperature was over 3 degrees above average, the most above average month this year.

Drought? What drought? After 3 really dry months in a row, this August was the wettest once since 1985 with 155.6 mm of precipitation.  This was almost as much as we had in the previous 3 months combined (167.6 mm).  It also puts it at the 7th wettest August in the region.

Generally we don’t see weather that is overall warm and wet at the same time, looking at a graph of temperature versus precipitation anomaly (see below), you can see that 2016 is out on its own towards the upper right of the graph.  Note that the crazy total for 1915 was caused by a recorded daily precipitation of 175.3 mm on the 4th which is more than 100 mm more than any other station recorded that day in the area.  So I see that data point as suspect, but even if you take 100 mm of the total is was still by far the wettest August we have seen in the region.

Given the wet month it is not surprising that the total for the year of 640.8 mm has gone above the average of 596.0 mm for the end of August.


Summary for August 2016:
Maximum Temperature 33.6°C
Minimum Temperature 10.5°C
Average Daily High Temperature 28.4°C (Long term average 24.8°C)
Average Daily Low Temperature 16.0°C (Long term average 12.9°C)
Total Precipitation 155.6 mm (Long term average 83.9 mm)

(Long term averages based on 1981-2010 data for the Waterloo Wellington Airport)


Thursday, August 4, 2016

July 2016 Summary


Another hot and dry month

At over one and half degrees above average, it was definitely a hot month. 

With not much else so say about the heat this month let’s have a couple of fun facts for the summer so far: 

The last time the daily high temperature was more than 5 degrees below average was back on June 13th. So far we have seen 22 days above 30 degrees, on average we only see 8 of them during a typical year, but we still have a long way to go to beat the record of 49 back in 1955. 

For the third month in a row the precipitation was below average.  Although it might have been much worse as it was only in the last week of the month that we saw almost 40 mm of the 70 mm precipitation for July.  But as was typical of the type of storms we have seen this summer, most of the rain fell in short bursts lasting less than an hour, and this means a lot of it probably ran off without having time to soak into the ground.

The total precipitation for the year (485.0 mm) has now started to drop below the average for this time of the year (509.0 mm).


Summary for July 2016:
Maximum Temperature 33.4°C
Minimum Temperature 8.6°C
Average Daily High Temperature 28.1°C (Long term average 26.0°C)
Average Daily Low Temperature 15.1°C (Long term average 14.0°C)
Total Precipitation 70.2 mm (Long term average 98.6 mm)


(Long term averages based on 1981-2010 data for the Waterloo Wellington Airport)

Sunday, July 3, 2016

June 2016 Summary


A dry and warm-ish June

We saw a lot of hot days in June, in fact the average daily high temperatures were the highest in almost 10 years. But the generally clear skies allowed the nighttime temperatures to dip down causing the average daily low temperatures to be the lowest in 12 years.

Put that all together and the overall temperature was a little over half a degree above the 1981-2010 average. But I put “warm-ish” in the headline as this still puts June within the average range.

For the second month in a row it was much drier than average, which is really starting to have an effect on the lawns and gardens of the region. Of the 55.2 mm that fell in June, half of it came during a couple of days early in the month meaning the rest of it was very dry.

The total precipitation for the first half of the year so far of 415.0 mm is incredibly close to the average for this time of the year of 416.1 mm.

Summary for June 2016:
Maximum Temperature 31.5°C
Minimum Temperature 5.2°C
Average Daily High Temperature 25.2°C (Long term average 23.6°C)
Average Daily Low Temperature 11.0°C (Long term average 11.5°C)
Total Precipitation 55.2 mm (Long term average 82.4 mm)


(Long term averages based on 1981-2010 data for the Waterloo Wellington Airport)

Friday, June 3, 2016

May 2016 Summary


A dry and warm May 

Although it was just pretty much average for the first half of the month, it was hot enough in the second half to put the overall temperature for May at 1.2 degrees higher than average.  A neat thing you can see on the graph is the temperature starting at 24.7°C on the 12th and then going pretty much straight down to 0.9°C on the 15th.

As sometimes happens in the region, there were no below zero temperatures during the month of May.  So this makes the last frost day April 30, which is about 5 days earlier than the UW weather station average of May 6.  This is an instance where I don’t like using the Waterloo Wellington Airport data as a small difference in temperature can make the difference between a frost or non-frost day.  Indeed this May the airport did record a low of -1.0°C on the 9th, where we only got down to 0.6°C.

For the first time since September, it was a drier than average month.  With the 42.2 mm of precipitation in May only being a bit more than half of the average of 82.3 mm.  This has pretty much wiped out the surplus we have seen since the beginning of the year, so the total for the year of 359.8 mm is now just a little above the average of 342.4 mm.


Summary for May 2016:
Maximum Temperature 30.9°C
Minimum Temperature 0.6°C
Average Daily High Temperature 20.0°C (Long term average 18.7°C)
Average Daily Low Temperature 7.4°C (Long term average 6.4°C)
Total Precipitation 42.2 mm (Long term average 82.3 mm)

(Long term averages based on 1981-2010 data for the Waterloo Wellington Airport)

Thursday, May 5, 2016

April 2016 Summary


A cold April with average precipitation

Apart from a week in April that taunted us with spring-like temperatures, the rest of the month was pretty cold.  This resulted in a colder than average month (2.3 degrees below) for the first time in over a year and the coldest April since 1995. 

Another interesting note is that the minimum temperature on the 5th of -14.7°C was the fourth coldest April temperature we have seen in the over 100 years of records in the region.

Not much of interest as far as precipitation, the total of 72.2 mm was just a bit below the average of 74.5 mm.  The total for the year of 317.6 mm is still above the average of 264.4 mm.

This year shows why you can’t call an end to the snowfall season at the end of March, as the 28.5 cm that fell in April ranked as the second highest month of the season (12.5 – Nov, 8.5 – Dec, 36.5 – Jan, 17.5 – Feb, and 18 – March).  This month kept the total (121.5 cm) below the average of 159.5 cm.

  
Summary for April 2016:
Maximum Temperature 24.6°C
Minimum Temperature -14.7°C
Average Daily High Temperature 9.6°C (Long term average 11.5°C)
Average Daily Low Temperature -2.0°C (Long term average 0.8°C)

Total Precipitation 72.2 mm (Long term average 74.5 mm)

(Long term averages based on 1981-2010 data for the Waterloo Wellington Airport)

Sunday, April 3, 2016

March 2016 Summary


A very wet and warm March

March started with an early taste of Spring, including a high of 17.5°C on the 9th, and as the rest of the month only saw a few colder than average days, it isn’t surprising that overall it was 3 degrees above average.  Although this seems impressive, it didn’t come close to March of 2012 when it was an incredible 7 degrees above average.

For a while it was looking like it might end up being a dry month, however from the 24th to the 31st we were deluged with 95 mm of precipitation.  This put the total for the month at 127.4 mm, which is more than double the average of 61.0 mm and the 5th wettest in the 100 years of weather data in the region.

Even with the spring-like weather for a lot of the month, there was a decent amount of snow (18 cm), although that is less than the average of 26.5 cm.  The total snowfall of 93 cm is still well below the average total of 152 cm for this time of year.


Summary for March 2016:
Maximum Temperature 17.5°C
Minimum Temperature -15.2°C
Average Daily High Temperature 6.9°C (Long term average 3.6°C)
Average Daily Low Temperature -2.9°C (Long term average -5.6°C)
Total Precipitation 127.4 mm (Long term average 61.0 mm)


(Long term averages based on 1981-2010 data for the Waterloo Wellington Airport)

Tuesday, March 22, 2016

Winter 2015/16 Summary


I did this one as a series of tweets:

Winter 15/16 Summary #1: The temperature was 3.3 degrees above average, second warmest in 100 year history of weather records in the region

Winter 15/16 Summary #2: The precipitation of 178.2 mm was just a little under the 1981-2010 average of 184.5 mm.

Winter 15/16 Summary #3: So far we have seen about half of the average amount of snowfall, however that could change this week.

Winter 15/16 Fun Fact 1: The warmest winter in the region was in 2011-12 which ended with that crazy March featuring temperatures in the mid-20s

Winter 15/16 Fun Fact 1: Longest streak of days without an above zero temperature: This winter 9 Days, last winter 41 Days.

FS

Tuesday, March 8, 2016

February 2016 Summary

Another warm month with average precipitation

It was a month that saw some very warm and also some very cold temperatures.  However, the warms ones greatly outnumbered the cold ones resulting in a month that was almost 2 degrees above the long term average.  This is a lot, but we only have to go back to 2012 to find a warmer one.

Of note is that the high of 14.2°C on the 3rd was the highest February temperature we have ever seen in the over 100 years of records in the region.  This beat the 13.9°C on February 12th, 1999.

Not many large storms during the month, with the final total precipitation of 55.8 mm ending up pretty close to the average of 54.9 mm.  While the 17.5 cm of snow in February was just a little over half of the average of 30.3 cm.
                                                           
Summary for February 2016:
Maximum Temperature 14.2°C
Minimum Temperature -25.4°C
Average Daily High Temperature 0.9°C (Long term average -1.2°C)
Average Daily Low Temperature -8.1°C (Long term average -9.7°C)
Total Precipitation 55.8 mm (Long term average 54.9 mm)

(Long term averages based on 1981-2010 data for the Waterloo Wellington Airport)

Sunday, March 6, 2016

Last day to enter the 2016 UW Weather Station contest

Just a reminder that there is only one more day to enter the UW Weather Station Contest.  The entry period ends Monday, March 7 at 2:00 pm.

Enter here: http://weather.uwaterloo.ca/contest2016/contest.html

Tuesday, February 2, 2016

January 2016 Summary


A warm January with average precipitation

After a couple of very interesting months weather-wise, the start of 2016 might have seemed just a little bit boring.  It was a warm month, with the overall temperature coming in a bit more than a degree above average.  But, this isn’t that special as we only have to go back 3 years to find a warmer January.

However, it was quite the contrast to the last two years as this year it was over 4 degrees warmer than those.  It also may have felt a lot warmer as there was never more than one cold day in a row.

The total precipitation for the month of 62.6 mm was just a little bit less than the average for January of 65.2 mm.  With the warmth we saw this month it isn’t surprising that the snowfall of 36.5 cm was also below the average of 43.7 cm.


Summary for January 2016:
Maximum Temperature 9.3°C
Minimum Temperature -19.9°C
Average Daily High Temperature -1.0°C (Long term average -2.6°C)
Average Daily Low Temperature -9.4°C (Long term average -10.3°C)
Total Precipitation 62.6 mm (Long term average 65.2 mm)

(Long term averages based on 1981-2010 data for the Waterloo Wellington Airport)


Sunday, January 3, 2016

2015 Summary


University of Waterloo Weather Station Annual Summary - 2015


A quick look at the temperature graph for the year pretty much tells you the story for this year.  First is the large amount of blue (indicating lower than average temperatures) in February and the lack of blue (meaning higher than average temperatures) in December.  These were both record months for the 100 years of weather data in our region.

The year started off really cold with only a few warmer than average days during January, but this was only a foreshadowing of what was to come.  Not only was it followed by the coldest February in the region, but it was the coldest of any month.  Also of note was the low temperature on February 16th of -35.5 °C, which was the coldest day we have recorded in the 17 year history of the UW Weather Station.

The spring started out cold with March being at a little more than a degree below average (it turned out to be the last colder than average month of the year).  Then April was exactly average followed by May which jumped up to being over 3 degrees warmer than average.  Even with the warm temperatures in May, a cold snap late in the month resulted in the temperature going below zero on May 23rd, this was the latest in the history of the UW weather station.

The summer saw its share of both hot and cold days resulting in it coming out to pretty much average in the end.  The rest of the year was warm, starting with September at 4 degrees above average, which was the second warmest ever in the region, followed by October that was just about a degree above.  November came in at 3 degrees above average and had both the second and third warmest November temperatures since records began in the region.

Then came December, which ranked as the warmest ever seen in the region by a full 2 degrees and it didn’t have any colder than average days.  Overall for the year, it was 0.43 degrees above average during the year, this puts us pretty much in middle of the pack for the last 10 years.

As for precipitation, the year started off on the dry side and by the end of May it was approaching the extreme low for that time of the year.  However, June was the wettest month of the year which almost put the total back into the average range.  The rest of the year saw mostly drier than average months with October being the only exception.

The total precipitation for the year was 814.2 mm which is around 100 mm less than the average of 916.3 mm.  This puts it in the below average range, but not historically low by any means.
 

Summary for 2015 (averages are calculated from 1981-2010 data for the Waterloo-Wellington Airport):
Average Daily High Temperature: 12.96 °C (average 12.24 °C)
Average Daily Low Temperature: 2.01
°C  (average 1.86 °C)
Total Precipitation: 814.2 mm (average 916.3 mm)
Click on the image below to see the temperature chart:


Click on the image below to see the precipitation chart:


Saturday, January 2, 2016

December 2015 Summary


The warmest December on record

It is hard to properly emphasize just how warm it was this December.  To start, at 6 degrees above average it beat the previous warmest one back in 1923 by a full 2 degrees, which in meteorological terms is incredible.  There were no individual days that were colder than average (although some days had high temperature less than average, when you consider both the high and low temperatures, each day was warmer than average). 

As well, there were 9 days of the month where the low temperature was higher than the average high for that day.  Finally, the lowest temperature we saw in December was only -7.0°C, this is a record (previous record was in 1974 when it only got down to -10.6°C).

It was really dry for the first half of the month, but second half made up for it getting the total up to 66.2 mm, which is just short of the average of 71.2 mm.  But the warm temperatures resulted in only 8.5 cm of snow during the month, which is much below the average of 37 cm.


Summary for December 2015:
Maximum Temperature 14.8°C
Minimum Temperature -7.0°C
Average Daily High Temperature 6.2°C (Long term average 0.2°C)
Average Daily Low Temperature -0.6°C (Long term average -6.8°C)
Total Precipitation 66.2 mm (Long term average 71.2 mm)

(Long term averages based on 1981-2010 data for the Waterloo Wellington Airport)