Some historical temperatures during a dry September
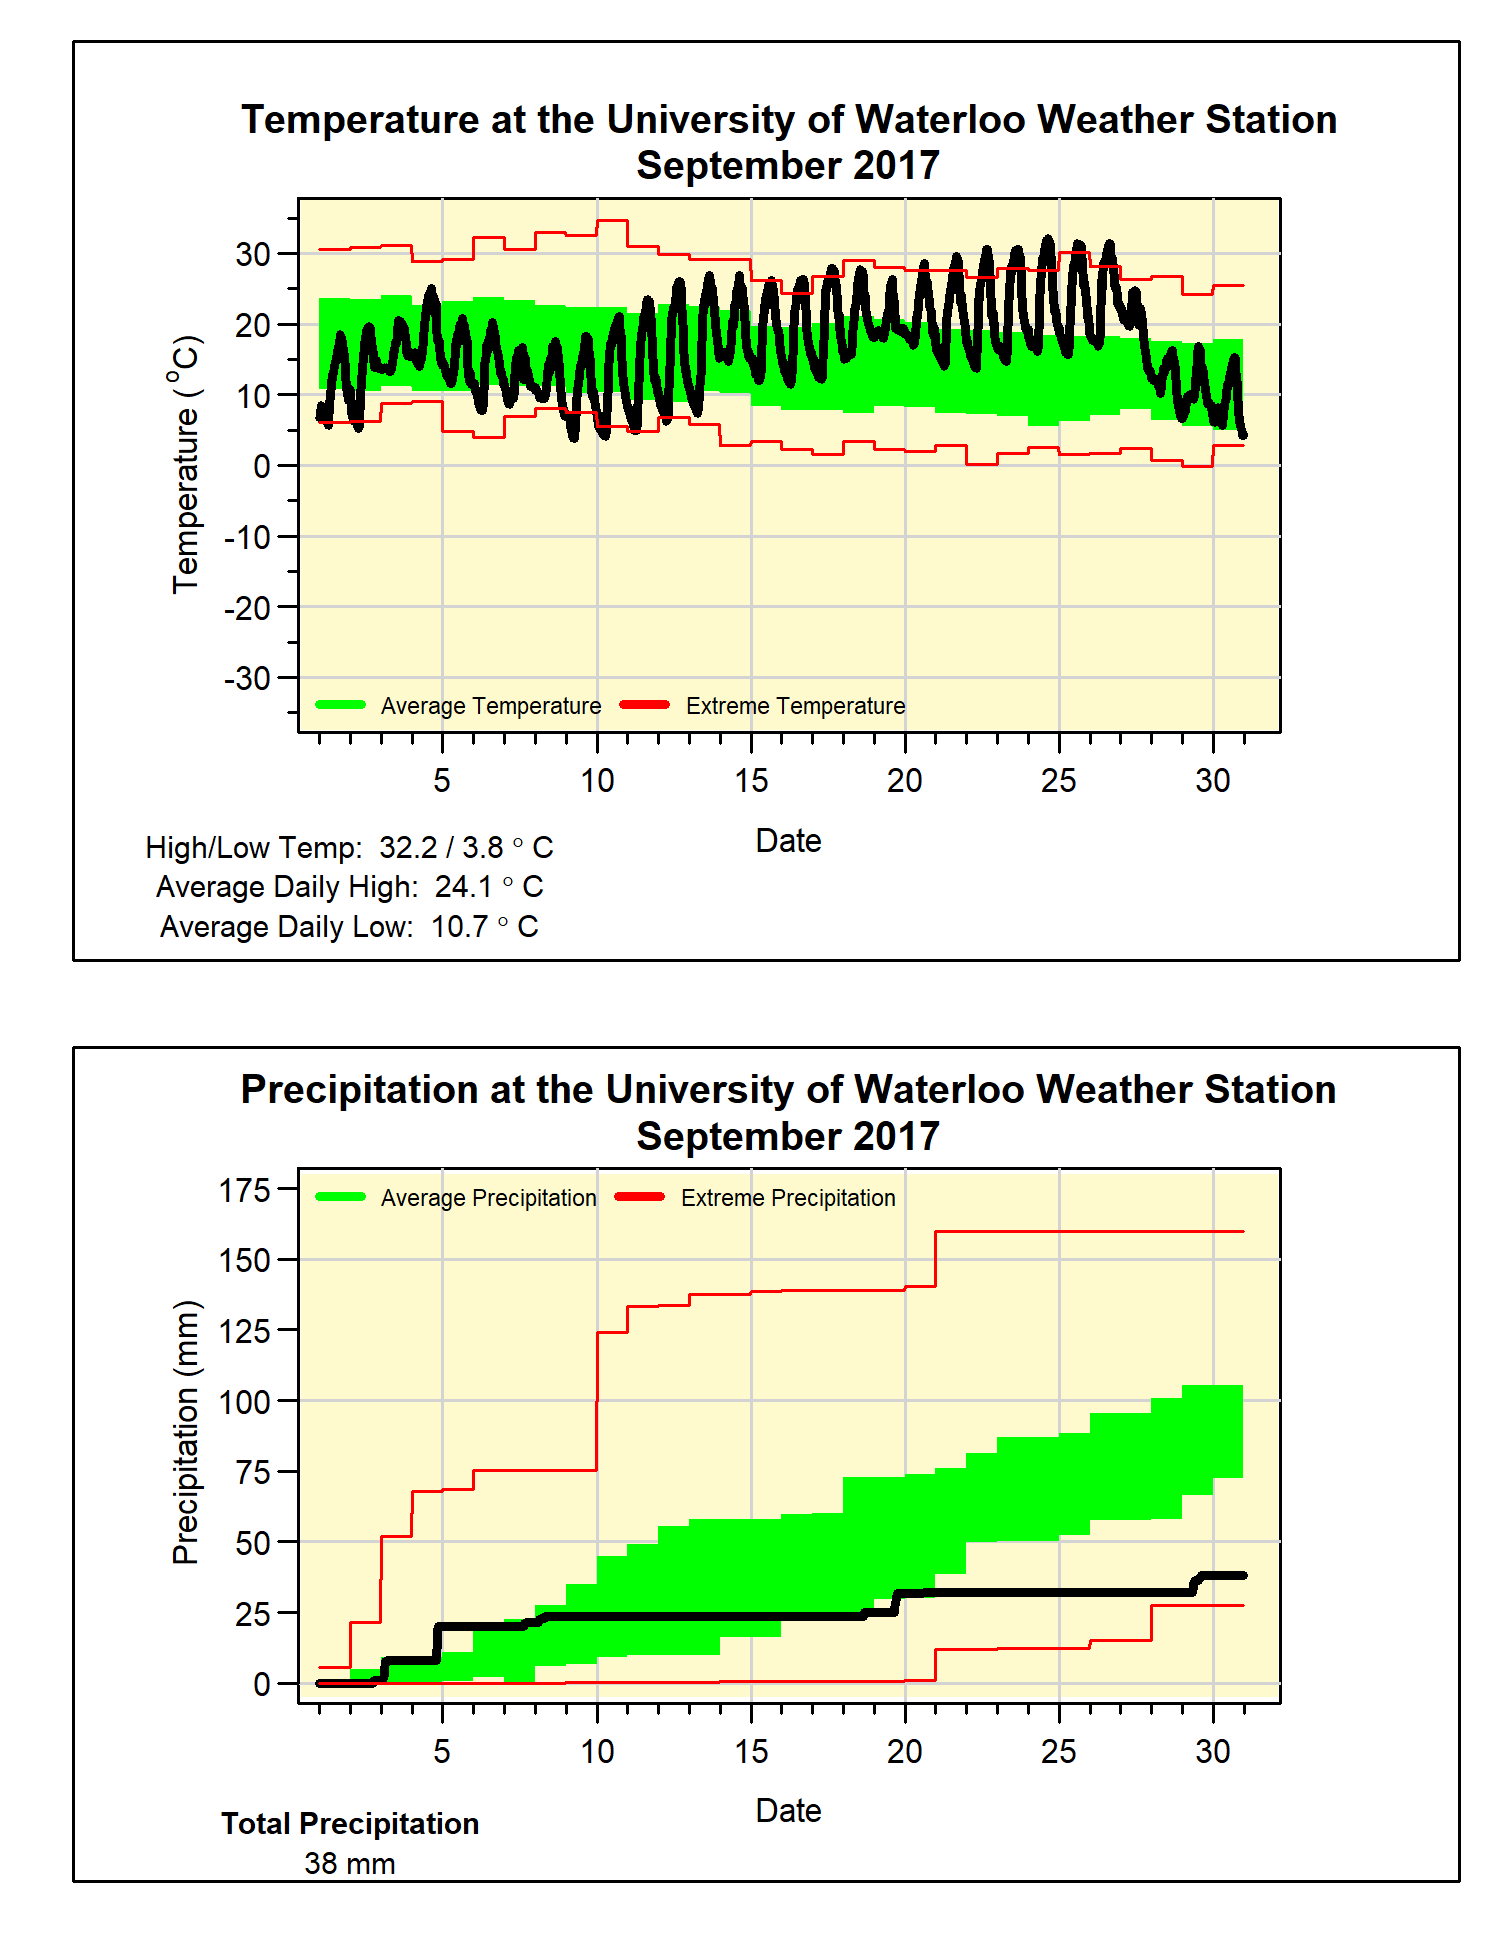
Well that was quite an end to September with the longest heat wave of the “summer” and some historical temperatures. The most significant streak was the 15 days above 25°C between the 12th and the 26th, that is something we have never seen before in September during the 100+ years of weather records in the region (the previous record was 13 such days back in 1947).
Some other notable events were the 5 days in a row above 30°C, which is something we have only seen a few times, the last was back in 1952. Finally, the high temperature on the 24th of 32.2°C was the highest seen that late in the year since September 24, 1931 when it was 32.8°C.
Not surprisingly, the overall temperature was almost 3 degrees above average, what might be surprising is that this is colder than the last 2 years although they didn’t have the extreme highs we saw this year. It is also useful to remember that this year the month started off cool during the first week.
But since I have you here can we talk a bit about recent Septembers? Fun fact: no other month has seen more consistently above average temperatures. In the past 20 years of data at the UW weather station, there has not been one in the below average range and only once was it even slightly below average (by 0.1 degrees in 2006).
The month was also very dry with only 38.0 mm of precipitation compared to the average of 87.8 mm, with half of the total coming during the first 4 days. This dry month puts the total precipitation for the year at 813.4 mm, which is still well above, but a bit closer to the average of 683.5 mm than it was at the end of August.
Summary for September 2017:
Maximum Temperature 32.2°C
Minimum Temperature 3.8°C
Average Daily High Temperature 24.1°C (Long term average 20.4°C)
Average Daily Low Temperature 10.7°C (Long term average 8.6°C)
Total Precipitation 38.0 mm (Long term average 87.8 mm)
(Long term averages based on 1981-2010 data for the Waterloo Wellington Airport)