Sunday, December 6, 2015

November 2015 Summary

A very warm November with average precipitation

We saw some really warm days this month, in fact the high of 23.1°C on the 4th was the second hottest November day in the 100 years of records in the region (highest ever was 25°C on November 1, 1950).  By the way, the high of 22.7°C the next day was the third hottest. 

There were 6 days that were 10 or more degrees above the average and those two days mentioned above were almost 15 degrees above.  Overall it was a little more than 3 degrees above average, although this is a lot, we only have to go back to 2011 to find a warmer November.

The month had 68.2 mm of precipitation, below than the average of 87.1 mm, but still within the average range.  Also, with only one more month to go, we have had 748.0 mm of precipitation this year.  This is much less than the average of 832.9 mm and it means we will need a really wet December (ie. over 100 mm) in order to avoid having a below average year.

After not getting any snow in October, there was 12.5 cm of snow that fell in November which is pretty much the average.

Summary for November 2015:
Maximum Temperature 23.1°C
Minimum Temperature -9.3°C
Average Daily High Temperature 10.6°C (Long term average 6.3°C)
Average Daily Low Temperature 0.6°C (Long term average -1.4°C)
Total Precipitation 68.2 mm (Long term average 87.1 mm)

(Long term averages based on 1981-2010 data for the Waterloo Wellington Airport)


Sunday, November 22, 2015

El Nino effect in our region

You have probably heard a lot of talk lately about the very strong El Nino which is current occurring in the Pacific Ocean.  If you are interested in the El Nino Southern Oscillation (or ENSO as it is called), this is a great resource for information:

https://www.climate.gov/news-features/department/8443/all

However, it is always important to keep in mind exactly just how much effect El Ninos generally have in our region.  Generally, the further away from the Pacific, the less direct effect El Nino will have on an area.  Thus you can imagine that around Waterloo it isn't exactly a slam dunk that an El Nino will always be the dominant factor in what we see.  For example, a less predictable and more variable factor called the Arctic Oscillation (AO) will usually have a great effect on what we see during a typical winter.  See the recent variations in the AO here:

http://www.cpc.noaa.gov/products/precip/CWlink/daily_ao_index/ao.shtml

So the real question is just how much of a difference does El Nino make for us?

To answer this question I did a quick plot of the average temperature, total precipitation and total snowfall for each winter between 1950 and 2010 in our region.  The winters with the seven strongest El Ninos are shown as red dots in the plot below (don't worry about the units of the plots, it is really just the patterns that are important here, the dark line at zero would be the average 1981-2010 value):


From the plot you can get an idea of the general variability of the different factors as well as how they are affected by El Nino.  Looking at the temperature, strong El Ninos are not uniformly all well above average, but it could be said they are all average to above average.  Thus you get the idea that El Nino will encourage warmer winters, but even the strong ones don't guarantee it.

Interestingly, for total precipitation it seems that El Ninos tend to not have either very wet or very dry overall winters (keep in mind total precipitation consists of both rainfall and snowfall).  Most of the strong El Ninos have resulted in very average overall wetness.

The strongest El Nino effect appears to be in the total snowfall as all the red dots are either a little or a lot below the average line and none are above. 

I have never been one who likes to make seasonal weather predictions (you can see why here: http://uwweatherstation.blogspot.ca/2014/12/what-is-winter-going-to-be-like-you.html ) and of course there are no guarantees when it comes to the weather.  However, based on the pattern from past strong El Ninos, it would seem that there is a "good chance" that we will see less total snowfall this winter, above average temperatures, and about average total precipitation. But as always, mother nature will have the final say.

Frank Seglenieks
University of Waterloo Weather Station Coordinator

PS For full disclosure I have to say that I totally stole the idea for the graph from NOAA's ENSO blog, they created a similar graph for different regions of the US, I just adopted it for our region.

Sunday, November 1, 2015

October 2015 Summary

A very wet and warm October

Although it never really got that hot, there were only a couple of days over 20 C, the overall temperature for the month was almost a degree above average. But incredibly this makes it the coldest October in the last 6 years as in those years it has consistently been more than a degree above average. On the graph you can also see when the temperature went up over 15 degrees in just under 6 hours on the 19th.

We saw a lot of precipitation late in the month with 30.8 mm on the 28th, however it still would have been an above average month even if that had not have happened. The total of 109.6 mm was well above the average of 67.4 mm.

A wetter month puts the total so far this year of 679.8 mm a little closer to the average for the end of October of 750.6 mm.

Summary for October 2015:
Maximum Temperature 22.4°C
Minimum Temperature -3.1°C
Average Daily High Temperature 14.0°C (Long term average 13.2°C)
Average Daily Low Temperature 4.3°C (Long term average 2.9°C)
Total Precipitation 109.6 mm (Long term average 67.4 mm)
(Long term averages based on 1981-2010 data for the Waterloo Wellington Airport)


Monday, October 5, 2015

September 2015 Summary

The second hottest September we have seen in 100 years

With only 3 colder than average days and the very warm start to the month, it isn’t surprising that this was the second hottest September we have seen in the 100 years of measurements in the region (only 1961 was warmer).  Overall it was 4 degrees above the average which is the most above average month since that crazy March of 2012.

What really set the month apart was the summer-like weather at the beginning with a string of temperatures near 30, this resulted in the average daily high temperature for September only a fraction of a degree below those of August.

We saw some, but not a lot of precipitation in September, in fact it would have been amongst the lowest if not for 24 mm on the 29th.  The total of only 53.8 mm was well below the average of 87.8 mm and puts the total for the year (570.2 mm) a little further away from what we would expect at this time of year (683.5 mm).


Summary for September 2015:
Maximum Temperature 32.4°C
Minimum Temperature 5.4°C
Average Daily High Temperature 24.7°C (Long term average 20.4°C)
Average Daily Low Temperature 12.4°C (Long term average 8.6°C)
Total Precipitation 53.8 mm (Long term average 87.8 mm)


(Long term averages based on 1981-2010 data for the Waterloo Wellington Airport)


Wednesday, September 2, 2015

August 2015 Summary

An average August for both temperature and precipitation

Even though we had 3 days in a row where the high temperature didn’t go above 20°C (the first time that has happened in August since 2000), overall it was a little over half a degrees hotter than average which is on the high end of the average range.  As sometimes happens, there was a big difference between the daily high temperature (just 0.2 degrees above average) and the daily low temperature (1.2 degrees above average).

About 60 mm of the month’s 78.2 mm of precipitation came during the first 10 days of the month and most of that came during just 2 days (23.0 mm on the 2nd and 31.2 mm on the 10th).  It has been pretty dry since then, but it was enough to make the total close to the average of 83.9 mm.

This pretty average month kept the total precipitation for the year (516.4 mm) pretty much the same distance from what we would expect at this time of year (596.0 mm).


Summary for August 2015:
Maximum Temperature 31.1°C
Minimum Temperature 8.1°C
Average Daily High Temperature 25.0°C (Long term average 24.8°C)
Average Daily Low Temperature 14.1°C (Long term average 12.9°C)
Total Precipitation 78.2 mm (Long term average 83.9 mm)

(Long term averages based on 1981-2010 data for the Waterloo Wellington Airport)


Thursday, August 6, 2015

July 2015 Summary

July was dry with average temperature

Even with the mini-heatwave we saw at the end of July with 4 days over 30°C, for the second month in a row it was a very average month for temperature, coming in again as just 0.1 degrees above average.    These 4 days over 30°C might have felt like something significant, but it is something we have seen in over half of the last 30 years.

Also interesting was that the low of 6.8°C on the 3rd was the lowest July temperature since 2001.

The first half of the month was a pretty average for precipitation, but then the tap was shut off with only 1.6 mm after the 18th.  This caused the total for the month (60.0 mm) to be well below the average (98.6 mm).

A dry month meant that the total for the year so far (438.2 mm) fell further away from the average (509.0 mm).


Summary for July 2015:
Maximum Temperature 31.7°C
Minimum Temperature 6.8°C
Average Daily High Temperature 26.3°C (Long term average 26.0°C)
Average Daily Low Temperature 13.8°C (Long term average 14.0°C)

Total Precipitation 60.0 mm (Long term average 98.6 mm)


(Long term averages based on 1981-2010 data for the Waterloo Wellington Airport) 


Thursday, July 2, 2015

June 2015 Summary

A very wet June with average temperature

About as average of a month for temperature as you can have with just a few colder and a few warmer than average days.  Overall, it was a mere 0.1 degree above average, but this was still the coldest June we have seen in the region since 2009.

It was a very wet month with 4 days over 15.0 mm along with 18 days of some precipitation compared to the average of 11.5.  The total of 117.9 mm was much more than the long-term average of 82.4 mm well outside the average range, but we only have to go back to a couple of years to find a wetter month of June.  Another interesting thing that I found out was that it is month of extremes, in the last 10 years only once has the total precipitation been in the average range, the rest were either very dry or very wet.  

This soggy month put the total precipitation we have seen this year (378.2 mm) closer to the average (416.1 mm).


Summary for June 2015:
Maximum Temperature 28.3°C
Minimum Temperature 5.6°C
Average Daily High Temperature 23.1°C (Long term average 23.6°C)
Average Daily Low Temperature 12.1°C (Long term average 11.5°C)
Total Precipitation 117.9 mm (Long term average 82.4 mm)


(Long term averages based on 1981-2010 data for the Waterloo Wellington Airport) 


Thursday, June 18, 2015

May 2015 Summary

A very warm May with just barely average precipitation

Although it went below zero a couple of times during the month, overall it was three and half degrees higher than average making it the warmest May since 1998.  This was also the first warmer than average month we have seen this year.

Up until the last 2 days of the month it was looking like this May might have been one of the driest every recorded in the region.  However, the almost 50 mm in those last 2 days managed to get the total (61.6 mm) just into the bottom end of the average range.

The total precipitation for the year so far (260.3 mm) is still considerably less than the average for this time of year (337.7 mm).


Summary for May 2015:
Maximum Temperature 30.4°C
Minimum Temperature -0.8°C
Average Daily High Temperature 22.6°C (Long term average 18.5°C)
Average Daily Low Temperature 9.0°C (Long term average 6.1°C)

Total Precipitation 61.6 mm (Long term average 82.3 mm)
(Long term averages based on 1981-2010 data for the Waterloo Wellington Airport)

Sunday, May 10, 2015

April 2015 Summary


A very average April for both temperature and precipitation

There were quite a few really warm days during the month, but these were offset by a cold spell during the last half of the month.  It was an average month for temperature as the overall temperature was just 0.1 degrees below the average and the first month of the year that wasn’t in the colder than average range.

It was also a pretty typical April for precipitation with a just few storms here and there.  The 77.0 mm we saw was a bit higher that the average of 74.5 mm, but still within the average range.

A close to average month for precipitation means that we didn’t really close the gap between what we have seen so far this year (198.7 mm) and that we would expect at this point in the year (264.4 mm).

I’m hoping it is now safe to call an end to the 2014-15 snowfall season, with April adding 3 cm, the total for the season was 127.5 cm.  This is a lot less than the average of 159.7 cm and the lowest total since 2011-12.  I would like to thank our snow measurement volunteers Melinda, Eric, Stephen, and Dave.


Summary for April 2015:
Maximum Temperature 21.1°C
Minimum Temperature -6.1°C
Average Daily High Temperature 11.8°C (Long term average 11.5°C)
Average Daily Low Temperature 0.4°C (Long term average 0.8°C)
Total Precipitation 77.0 mm (Long term average 74.5 mm)

(Long term averages based on 1981-2010 data for the Waterloo Wellington Airport)

Sunday, April 5, 2015

March 2015 Summary

A cold and dry March

Although it was a cold month, it certainly wasn’t as cold as the February that just passed or March of last year. Compared to last year’s March, which was 5.6 degrees colder than average, this March was “only” 1.3 degrees colder.

There were only a few days with a small amount of precipitation, staying below average for the entire month. The total of 23.9 mm much less than the average of 61.0 mm.

With another dry month, the total for the year of 121.7 mm is well below the 187.6 mm that we would expect at this point in the year.

We only had 6.5 cm of snow during March, about a quarter of the average of 26.5 cm. Of course we usually see some snow after March, so I’m not calling an end to the snowfall season, but we currently stand at 124.5 cm of snow since the fall compared to the average of 159.7 cm.

Summary for March 2015:
Maximum Temperature 14.1°C
Minimum Temperature -26.4°C
Average Daily High Temperature 2.8°C (Long term average 3.6°C)
Average Daily Low Temperature -7.5°C (Long term average -5.6°C)

Total Precipitation 23.9 mm (Long term average 61.0 mm)


(Long term averages based on 1981-2010 data for the Waterloo Wellington Airport)

Sunday, March 8, 2015

February 2015 Summary

The coldest month on record with average precipitation

Not only was it the coldest February in the 100 years of weather records in the region, but it was also the coldest of any month.  The average temperature was -15.1°C, putting it well below the previous coldest months which were February 1934 (-13.3°C) and January 1994 (-13.2°C).  Even though last year seemed really cold at the time, at an average of -11.6°C, it was practically balmy compared to this year.

Overall, it was over 9 degrees below average with many of the daily high temperatures not even getting up to the average low temperatures for that day.  Also of note was the low temperature we saw on Family Day (Feb 16) which was -34.9°C, beating the previous low of -32.3°C on January 27, 2005.

The precipitation got off to a fast start for the month but ended in the average range with 48.2 mm (note that because the solid precipitation gauge at the UW weather station was not working this is based on the Environment Canada station called ”Waterloo Wellington 2”).  The snowfall we received of 54 cm was well above the average of 30.3 cm for the month.


Summary for February 2015:
Maximum Temperature -1.7°C
Minimum Temperature -34.9°C
Average Daily High Temperature -8.9°C (Long term average -1.2°C)
Average Daily Low Temperature -21.2°C (Long term average -9.7°C)
Total Precipitation 48.2 mm (Long term average 54.9 mm)


(Long term averages based on 1981-2010 data for the Waterloo Wellington Airport)

Tuesday, February 3, 2015

January 2015 Summary

A cold January with average precipitation

With only a few scattered days that were above average, it is not that surprising that the month was very cold (overall 3 degrees below average).  However, it might be surprising that it was not that much colder than last year’s (much hyped) January.  Although it was February and March that really made last winter stand out, so we still have a long way to go to match it.

After a wet start to the month, the rest was pretty dry, causing us to end within the average range.  As far as snow, the 34 cm that came down was below the average of 43.7 cm.

As well, a bit of milestone here as this month marks the 10th year that I have been doing these weather station summaries (and if you didn’t know, you can see all ten years of the summaries on the UW weather station website here: http://www.weather.uwaterloo.ca/data.html#chart ).


Summary for January 2015:
Maximum Temperature 4.8°C
Minimum Temperature -25.3°C
Average Daily High Temperature -4.3°C (Long term average -2.6°C)
Average Daily Low Temperature -14.9°C (Long term average -10.3°C)
Total Precipitation 49.6 mm (Long term average 65.2 mm)


(Long term averages based on 1981-2010 data for the Waterloo Wellington Airport) 

Saturday, January 17, 2015

Hottest year on record, wait didn't you say...


Question: I just heard 2014 was the hottest year on record, but didn't this blog just say that it was the coldest year since 1980, what gives? 

Answer: Yes many different agencies just announced that have recorded 2014 as the warmest year on record and our data show that it was the coldest year locally since 1980.   What is important to remember is that our region makes up only a small part of the planet and although we had a very cold year, globally the temperature was well above average. 

This map from NASA of the 2014 temperatures shows that our part of the world was the coldest anywhere:


So both statements are correct,  just for different scales. 

Thursday, January 8, 2015

2014 Summary

University of Waterloo Weather Station Annual Summary - 2014

I knew that last winter was cold, but I was a bit surprised to find out that 2014 was the coldest year overall since 1980 at 0.8 degrees below average.  After the winter, the rest of the year actually wasn’t all that remarkable, but the frigid temperatures we saw early in the year were enough to drag down the annual average.

The start of the year was remarkably cold, January, which was over 3 degrees colder than 
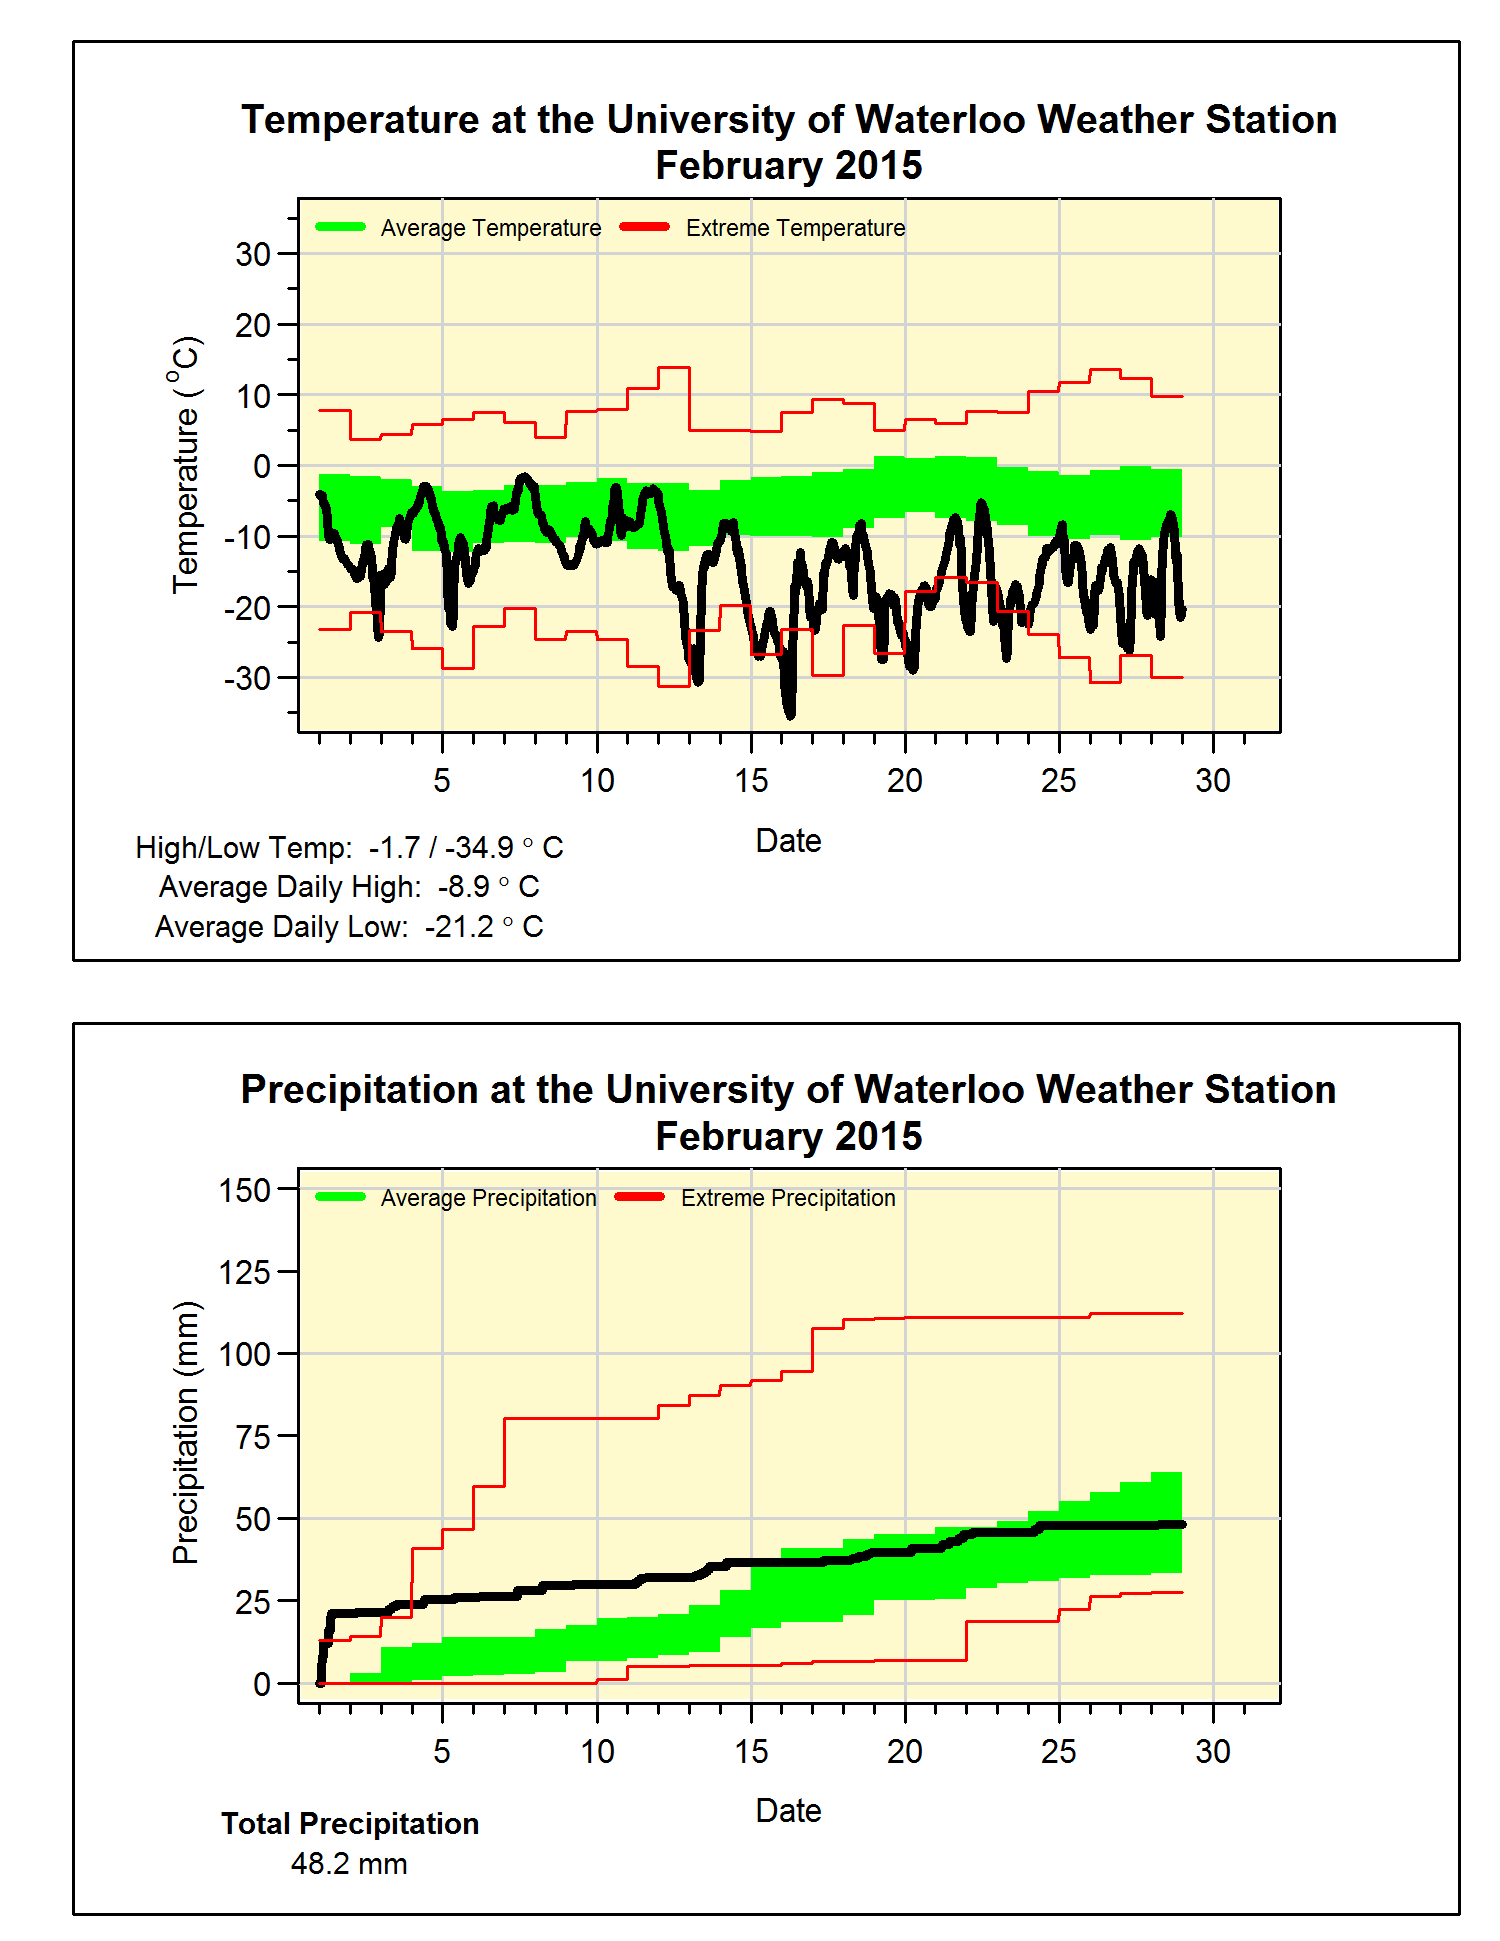
average, was followed by 2 months that were colder by more than 5 degrees.  It was the coldest February since 1979 and it was the second coldest March in the 100 year history of records in the region.  The low of -31.2 °C on February 12th was the coldest temperature since January 27th, 2005 and the second lowest February temperature recorded in the region (the coldest being all the way back in 1934).

April was still cold, but then May and June finally brought us some warmer than average months.  But any hopes for a warm summer were dashed with a cold July and average August.  The fall actually turned out to be pretty warm ending with a December that was the most above average of any month of the year.

Although the entire winter was memorable, of particular note was January 7th.  It was not the coldest day of the year, but the combination of temperature and wind made the windchill equivalent temperature -40.2, which was the lowest value we have seen since the UW weather station was established in February of 1998.  The other distinction of this day was that the high temperature only got up to -18.7 °C, you have to go back to January 19, 1994 to find a day when the high temperature was that low.

For precipitation, the total for the year of 949.6 mm was just 45.6 mm more than the average of 904.0 mm.  The first few months of 2014 were a little bit drier than average and these were followed by some average months.  The months of July (5th wettest) and September (3rd wettest) put the total back above average.  However, the last few months were dry putting the final total back into the average range. 

The most significant day for precipitation was August 2nd.  Interestingly the total for the day wasn’t that spectacular at only around 60 mm, however, this storm resulted in the highest 15 minute (23.7 mm) and 1 hour (57.4 mm) precipitation values in the history of the UW weather station.  Looking at the MTO website that calculates Intensity Duration Frequency Curves ( link to MTO site - developed with the help of the Civil Engineering department of the University of Waterloo by the way) the one hour total has less than a 1 percent chance of happening any given year (commonly referred to as a 1 in 100 year storm, but I don’t like that terminology).

You can see just how intense and isolated the storm was in this radar loop from Environment Canada (link to EC radar loop for August 2nd – hit the play button to see the loop).

As always the total snowfall for the calendar year is kind of a strange statistic as it straddles 2 different snowfall seasons, but nonetheless we got 148 cm during 2014 compared to an average of 159.5 cm.

Summary for 2014 (averages are calculated from 1971-2000 data for the Waterloo-Wellington Airport):
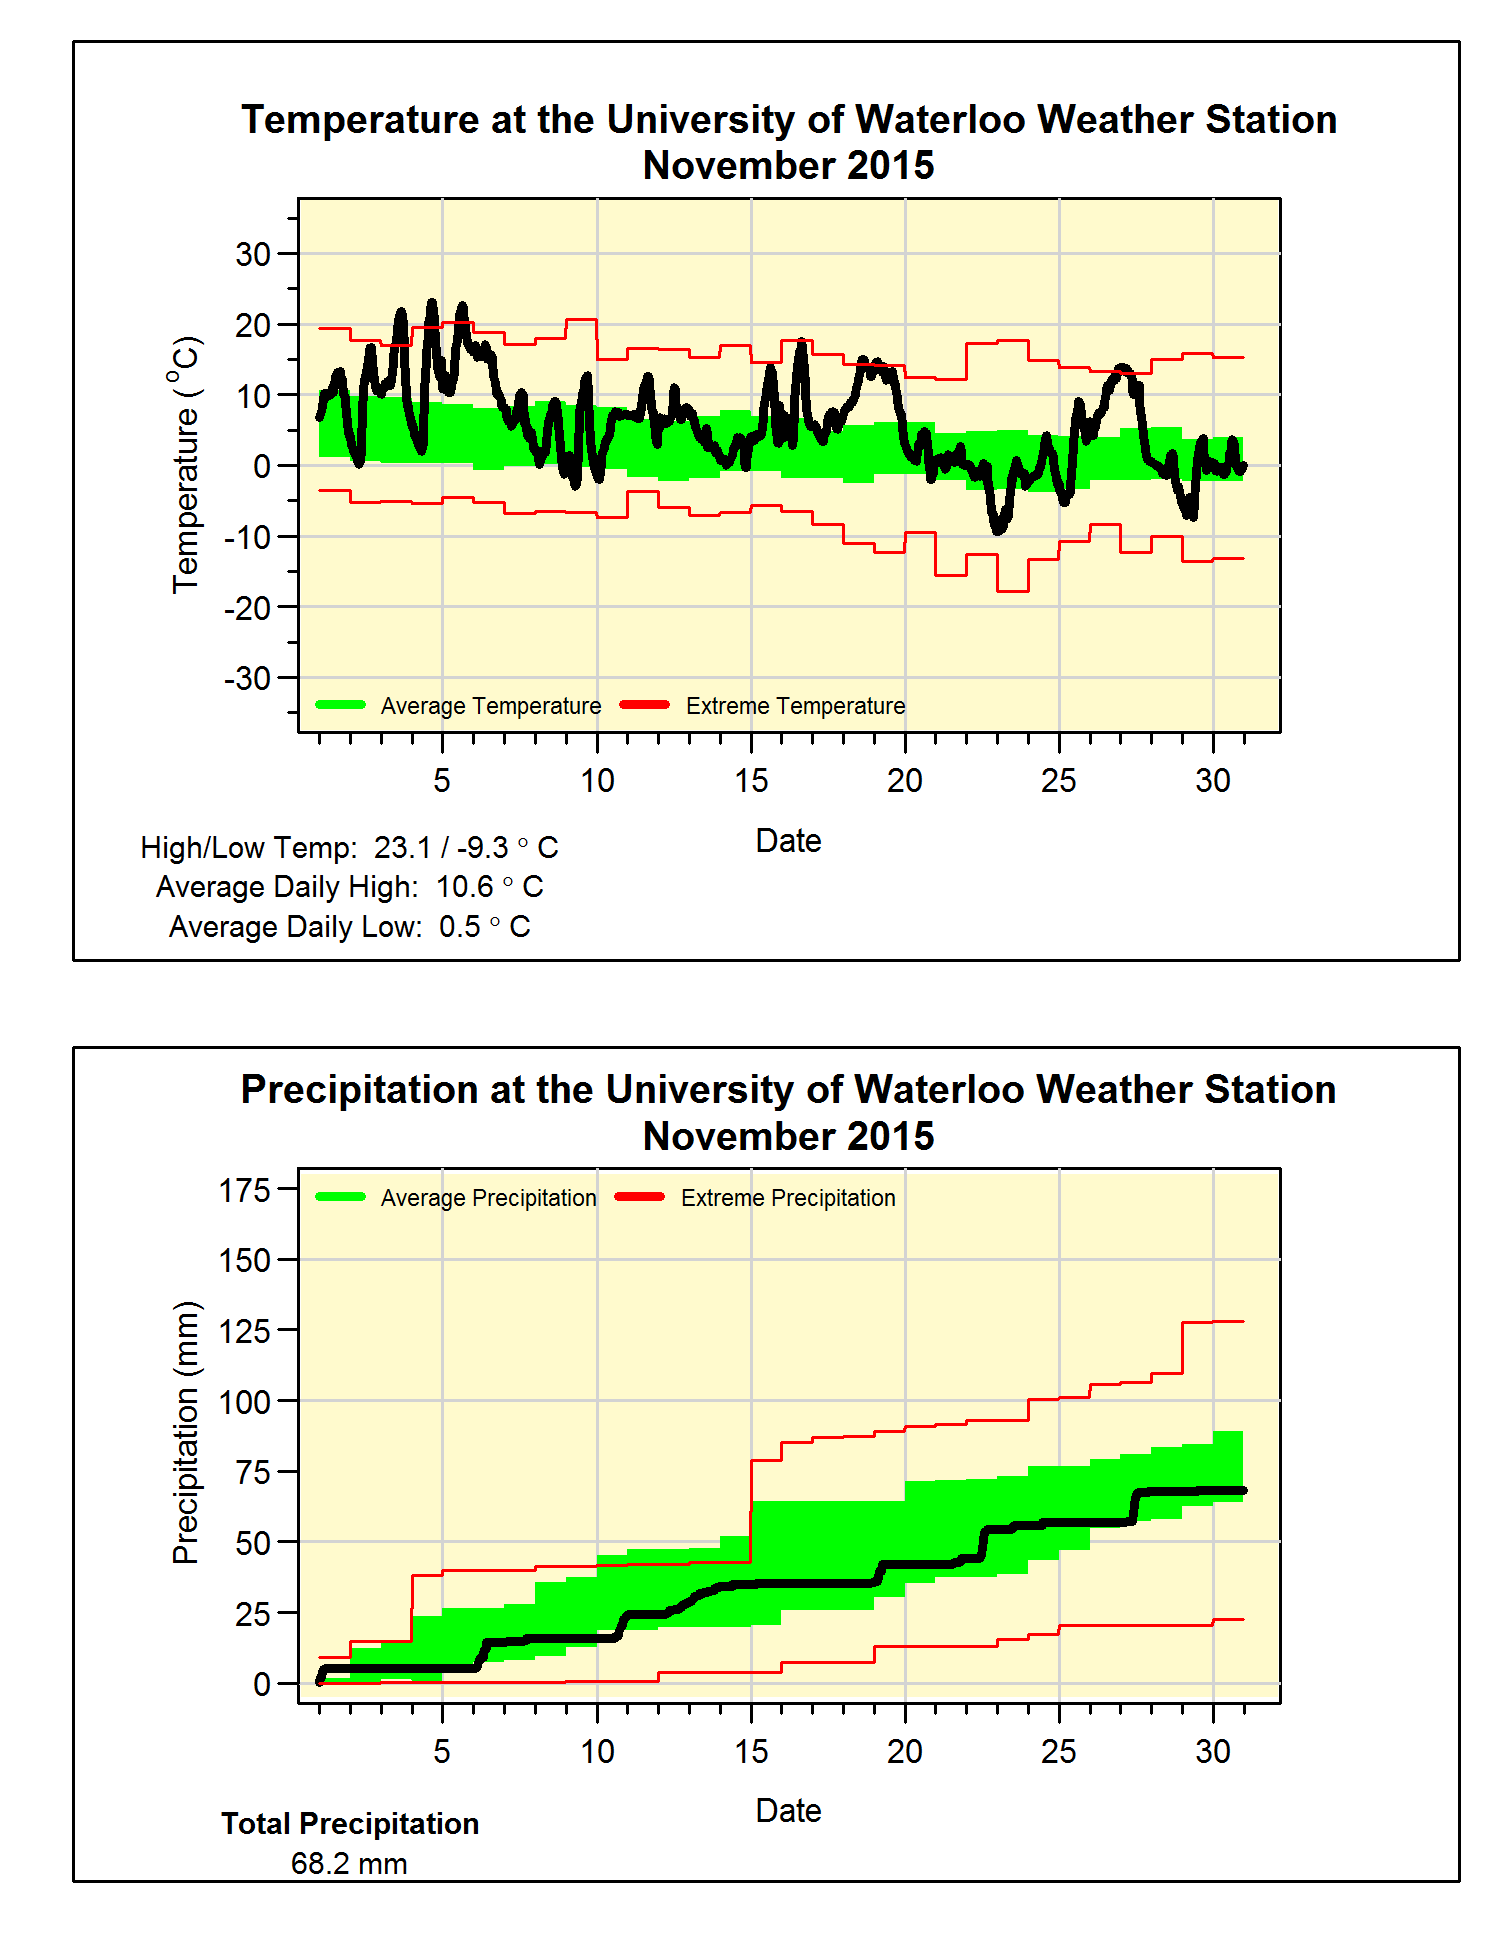
Average Daily High Temperature: 10.91 °C (average 11.89 °C)
Average Daily Low Temperature: 1.04
°C  (average 1.71 °C)
Total Precipitation: 949.6 mm (average 904.0 mm)


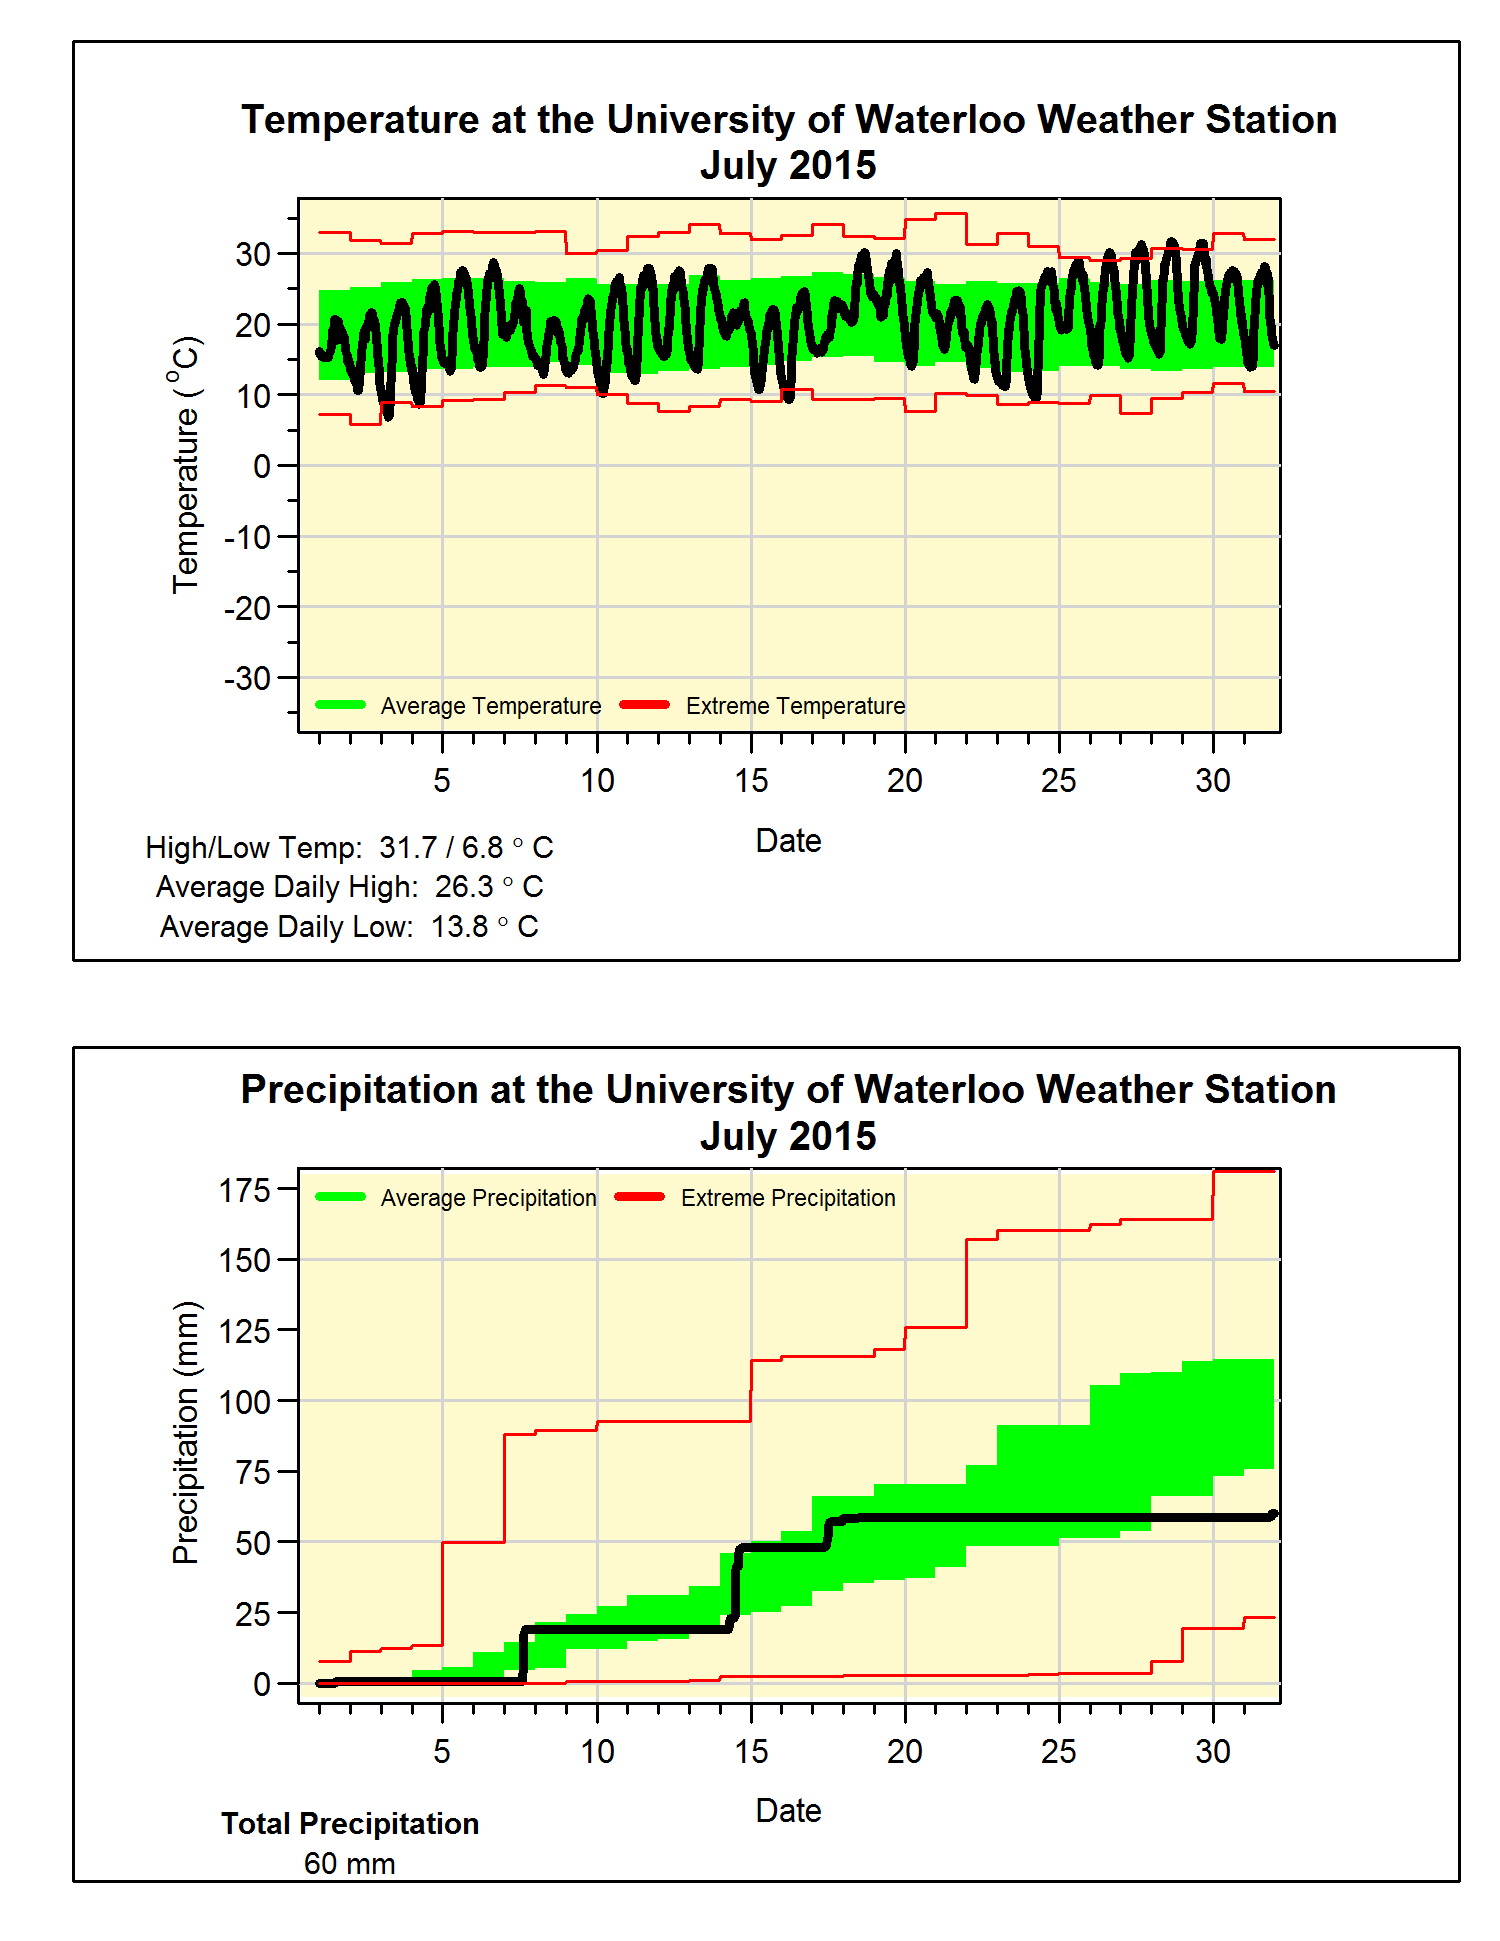
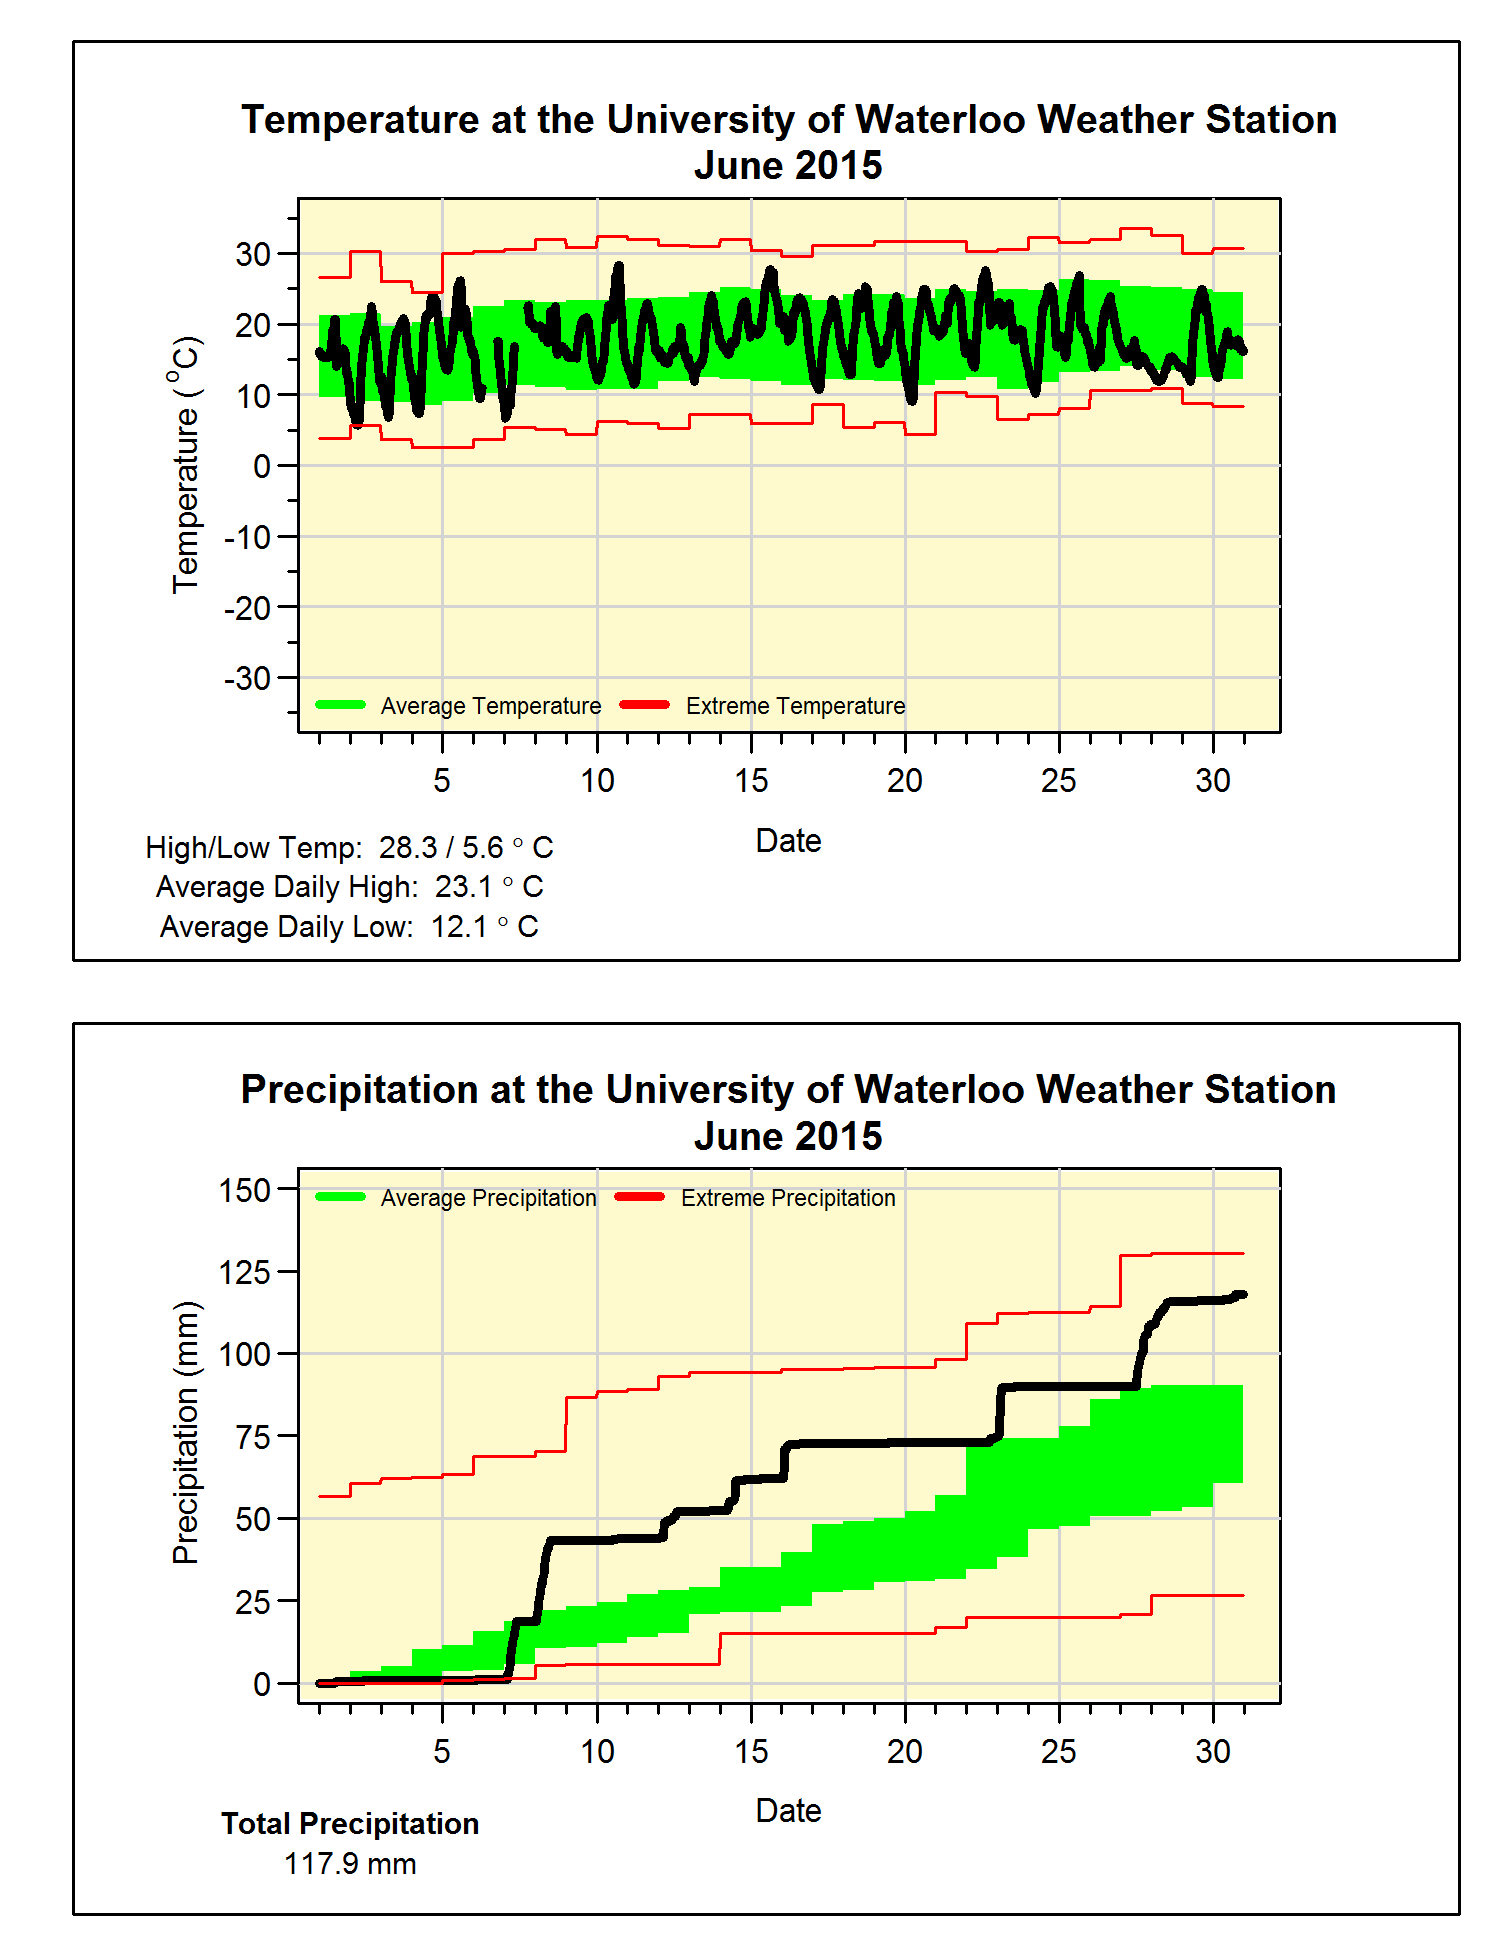
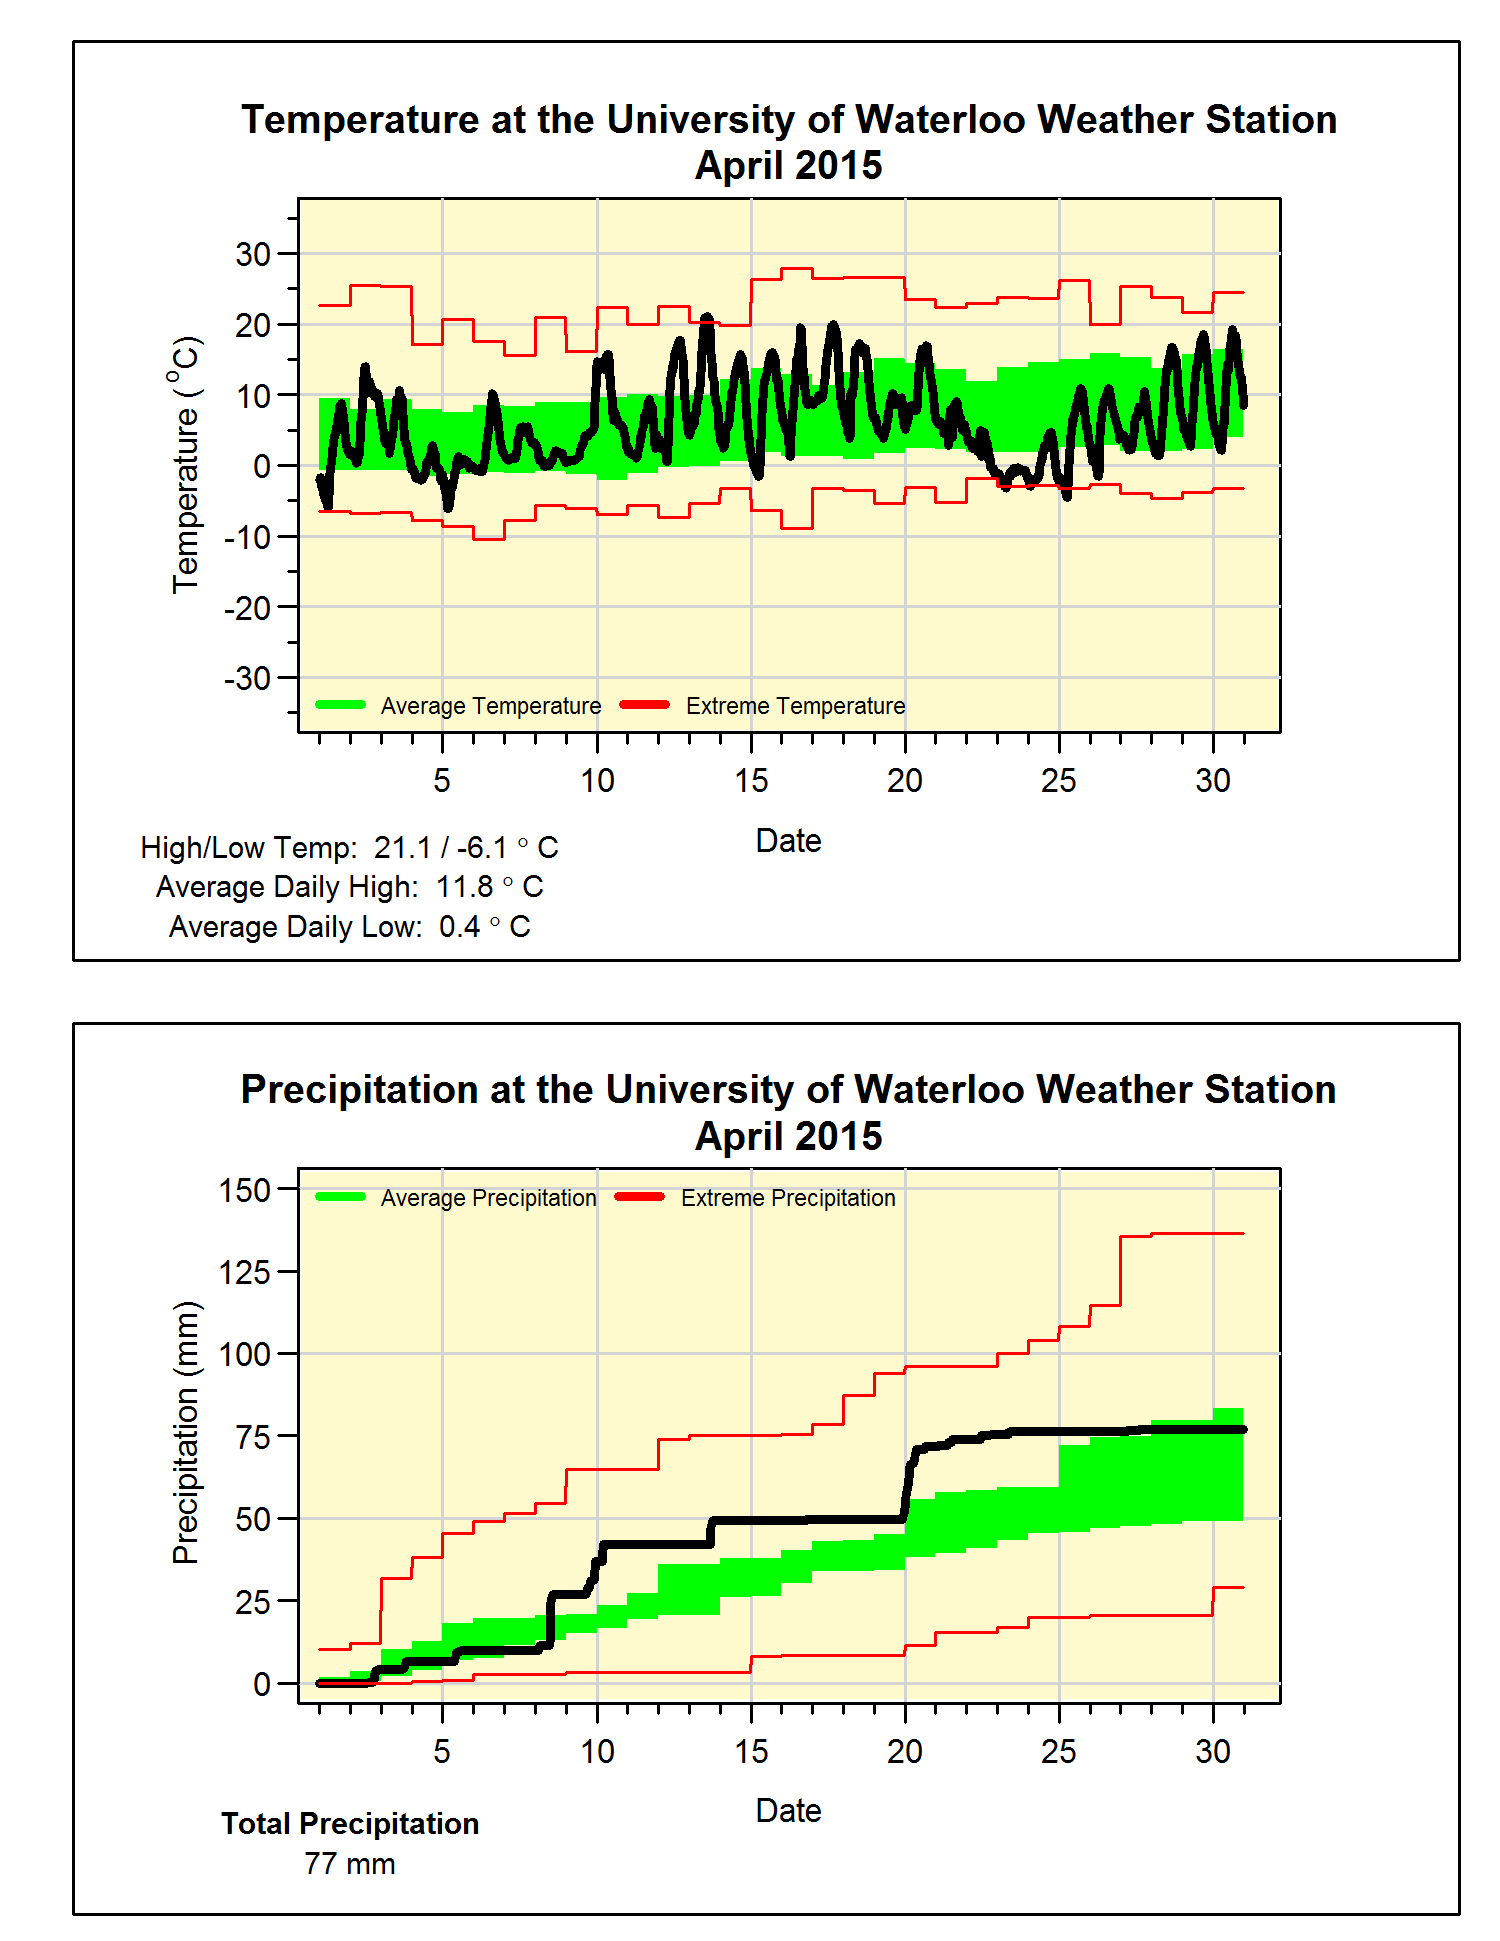
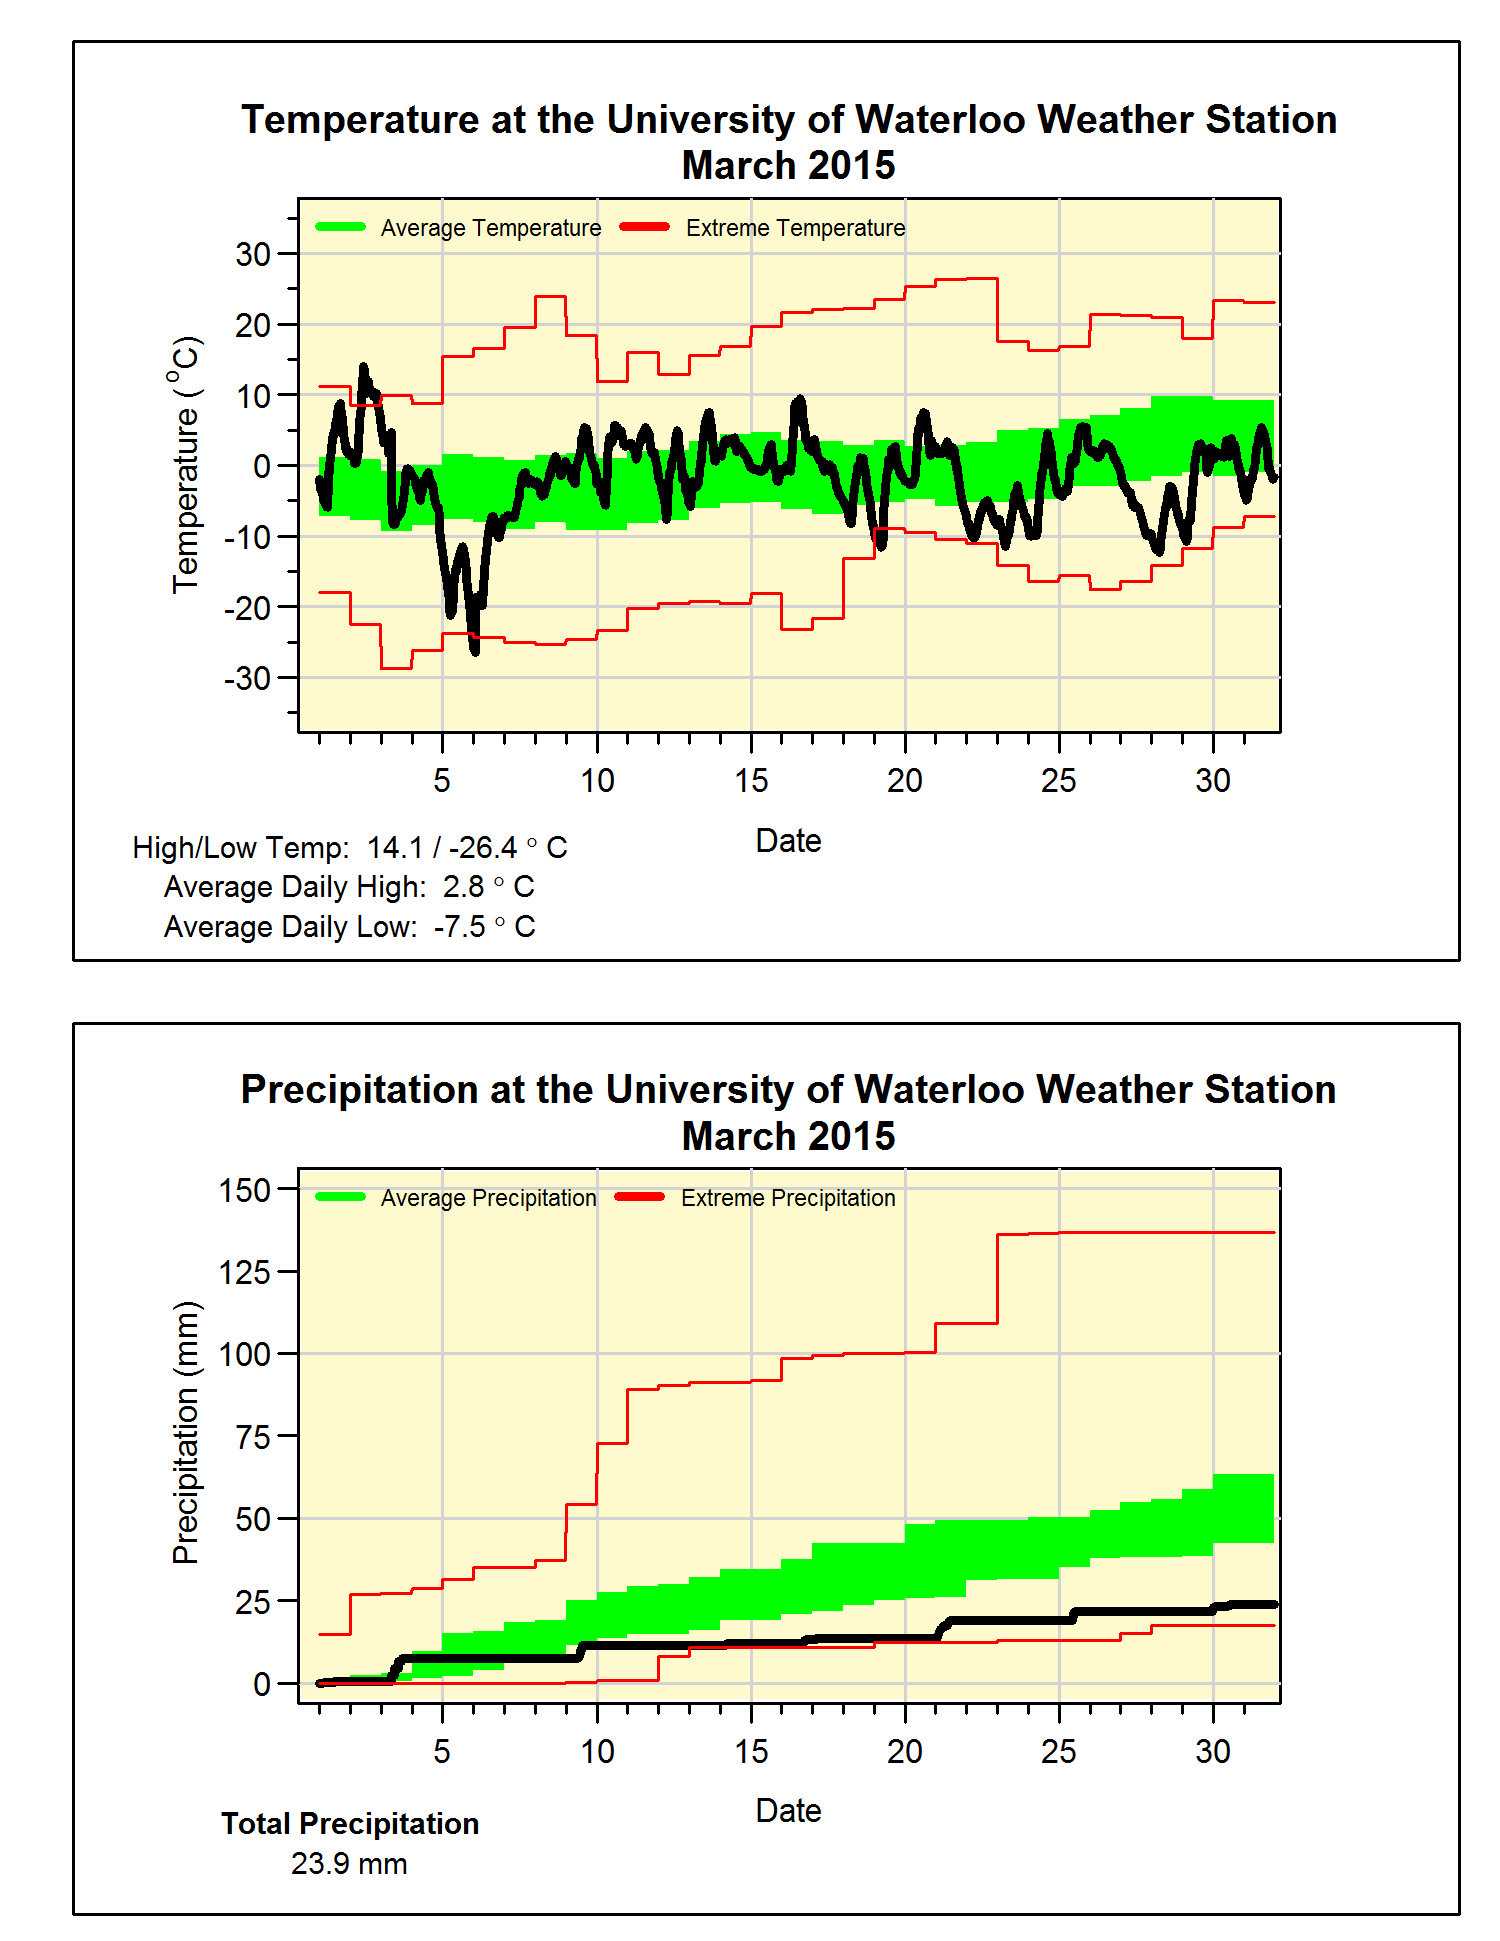
Click on the image below to see the temperature chart:


Click on the image below to see the precipitation chart:

Saturday, January 3, 2015

December 2014 Summary

A very warm and dry December (and the least snowiest ever)

The warm weather we saw around Christmas and the lack of really cold temperatures helped make it a very warm month overall.  For the entire month of December the temperature was 2.7 degrees higher than average.  This is a lot higher than average, however you only have to go back to 2012 to find a December that was even hotter.

With only 33.3 mm of precipitation, not only was it much less than the average of 80.4 mm, it was also the driest December since 1960 when there was 31.2 mm.  Of this precipitation, we only saw 5 cm of snow, this is the lowest December snowfall we have seen in the 100 years of records in the region.


Summary for December 2014:
Maximum Temperature 9.8°C
Minimum Temperature -10.3°C
Average Daily High Temperature 1.4°C (Long term average -0.4°C)
Average Daily Low Temperature -3.8°C (Long term average -7.5°C)
Total Precipitation 33.3 mm (Long term average 71.1 mm)


(Long term averages based on 1971-2000 data for the Waterloo Wellington Airport)