Sunday, December 1, 2019

November 2019 Summary


A dry November that was the coldest in almost 25 years

For the second year in a row we had a very cold November, with this one coming in at 2.5 degrees below average and almost half a degree colder than last year.  This put it at the 6th coldest in the over 100 year history of weather records in the region and the coldest since 1996. 

These cold temperatures were most prevalent during the first 20 days of the month and even a warm up during the last 10 days couldn’t bring the overall temperature back into the average range.  One fun fact from the month was that the high temperature of 10.4°C on the 27th was the lowest high temperature for November on record (the previous lowest high was 11.8°C in 1997).

Although there was a steady amount of precipitation throughout the month with a little bit coming every few days, the total of 52.8 mm was well below the average of 87.1 mm.  The total we have had so far this year of 866.0 mm is not that much above the average of 832.9 mm, which means we are setting up to have an average year for precipitation overall.

It isn’t that unusual to get some snow in early November or even late October, but usually those are smaller amounts.  So the 12.5 cm of snow that fell during the 11th was the earliest date for over 10 cm of snowfall since Oct 31, 1997 when there was 12 cm.

The total snowfall for November was 16 cm, which is a bit more than the average of 13 cm for the month.

Summary for November 2019:
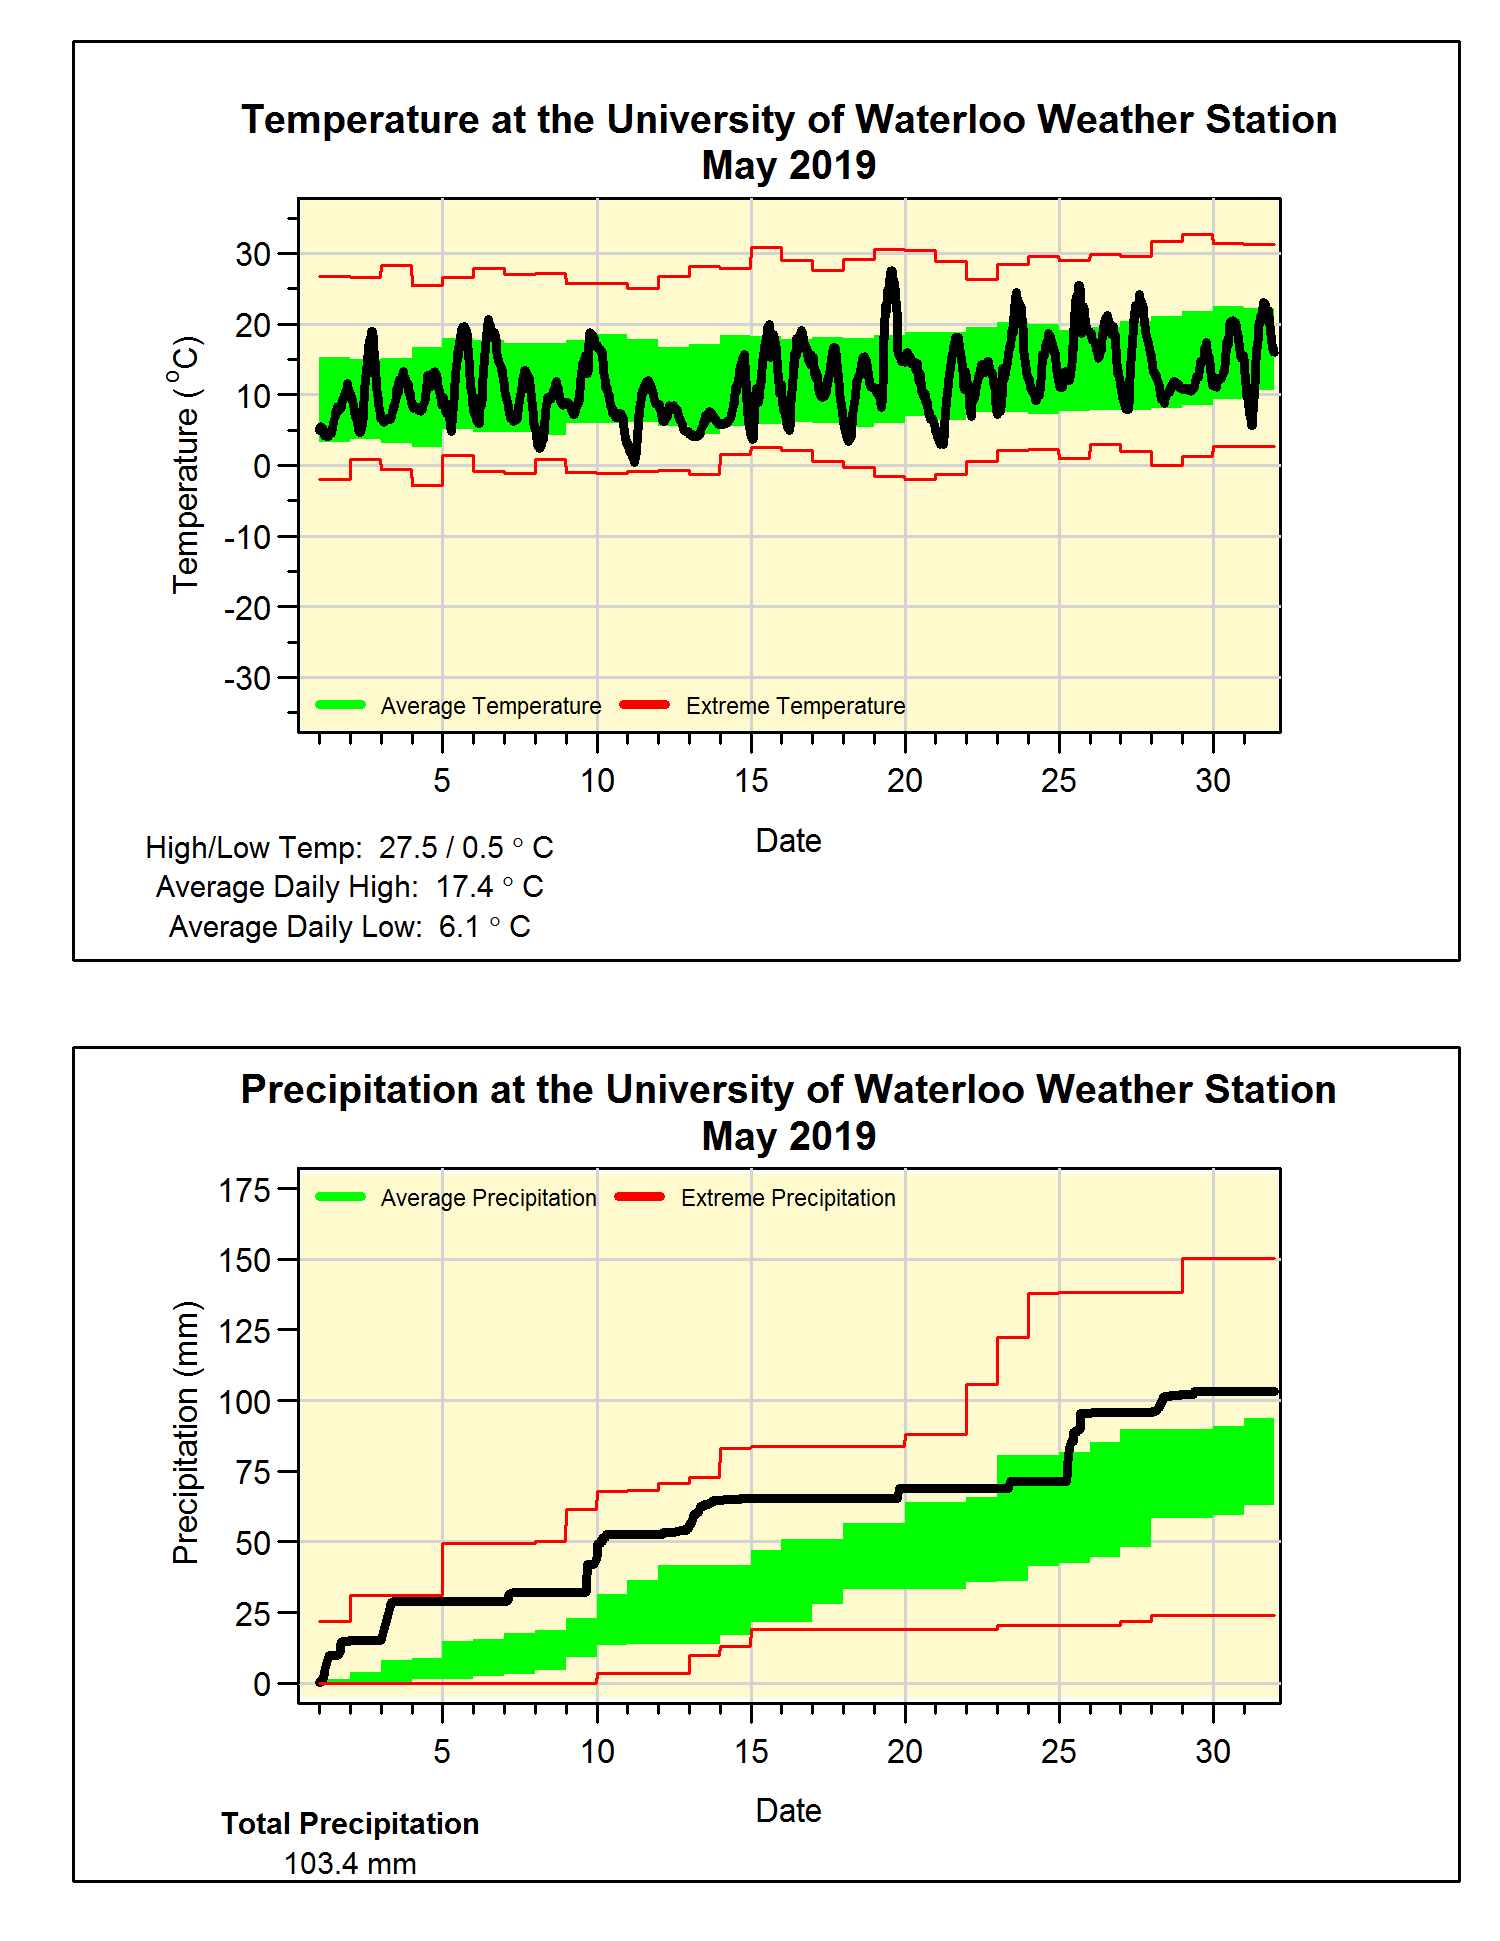
Maximum Temperature 10.4°C
Minimum Temperature -12.0°C
Average Daily High Temperature 3.4°C (Long term average 6.3°C)
Average Daily Low Temperature -3.6°C (Long term average -1.4°C)
Total Precipitation 52.8 mm (Long term average 87.1 mm)

(Long term averages based on 1981-2010 data for the Waterloo-Wellington Airport)


Sunday, November 3, 2019

October 2019 Summary


A warm and very wet October

The month started off with a daily high temperature near 30°C (29.6°C to be exact), which was only the third time there has been a day of at least 30°C during the month of October in the over 100 years of weather data in the region.  The others were: Oct 8, 2007 (30.3°C) and Oct 6, 1946 (31.1°C).

This was followed by almost a week of temperatures in the low 20s to high teens, which was still warmer than average for that time of year.  With the rest of the month seeing average temperatures, the overall temperature for October was 1.2 degrees higher than average and we have now seen 4 months in a row with above average temperatures.

The temperature first went below zero on October 19th at 12:45 am, which is about a week later than the average for the 20 years of the UW Weather Station.  It also puts the frost-free period for 2019 at 173 days, about 12 days longer than the average. 

During the last week of the month there were 3 days with over 20 mm of precipitation, in fact just that week would have resulted in average precipitation.  Combined with the rest of the month the total precipitation of 152.4 mm was more than twice the average of 67.4 mm and the most in the last 6 years.

This wet month resulted in the total precipitation for the year (813.2 mm) going well above the average for this time of year (750.6 mm).

Summary for October 2019:
Maximum Temperature 29.6°C
Minimum Temperature -2.6°C
Average Daily High Temperature 14.9°C (Long term average 13.5°C)
Average Daily Low Temperature 4.0°C (Long term average 2.9°C)
Total Precipitation 152.4 mm (Long term average 67.4 mm)

(Long term averages based on 1981-2010 data for the Waterloo-Wellington Airport)


Thursday, October 3, 2019

September 2019 Summary


Another hot and dry September

I always say there is never a sure thing when it comes to the weather, but for the past 20 years a really good bet has been that September will be warmer than average.  Although this was the least warm September in the past 6 years, it was still 2 degrees above the average. 

Apart from 3 days late in the month when the temperature was above 25°C there really weren’t any extended heat waves, just a lot of days a little warmer than average.  OK I know I’m really digging deep for this one, but the lowest temperature during the month was 5.7°C and I was not able to find another September with a higher minimum temperature in the 100 years of weather records in the region (the closest was 5.4°C in 2015).

A few storms during the first half of the month kept us moderately wet, but a week of no rain and only a few storms in the second half led to a total of just 44.8 mm, which is about half the average of 87.8 mm.  The last time we had a wetter than average September was back in 2014, in fact from 2010-2014 we had a streak of wetter than average Septembers and since then they have all been drier.

With this dry month, the total for the year of 660.8 mm is now slightly below the average of 683.5 mm for this time of year.

Summary for September 2019:
Maximum Temperature 29.0°C
Minimum Temperature 5.7°C
Average Daily High Temperature 22.2°C (Long term average 20.4°C)
Average Daily Low Temperature 10.8°C (Long term average 8.6°C)
Total Precipitation 44.8 mm (Long term average 87.8 mm)


(Long term averages based on 1981-2010 data for the Waterloo-Wellington Airport)


Monday, September 2, 2019

August 2019 Summary


A hot August with average precipitation

In contrast to last year when the overall August temperature was almost 3 degrees above average, this year it was only 0.9 degree higher than average, putting it just into the above average range.  There was a definite shift part way through the month with the average temperature dropping a degree before and after the 21st, this shift can be clearly seen in the graphs.

About three quarters of the month’s precipitation came during 5 very wet days during the middle of the month, with the rest of the month being relatively dry.  The total of 89.4 mm was not enough above the average of 83.9 mm to put it outside of the average range for August.

The total precipitation we have seen so far in 2019 of 616.0 mm is still above the average of 596.0 mm for this time of year.


Summary for August 2019:
Maximum Temperature 29.8°C
Minimum Temperature 7.6°C
Average Daily High Temperature 25.9°C (Long term average 24.8°C)
Average Daily Low Temperature 13.5°C (Long term average 12.9°C)
Total Precipitation 89.4 mm (Long term average 83.9 mm)


(Long term averages based on 1981-2010 data for the Waterloo-Wellington Airport)


Saturday, August 3, 2019

July 2019 Summary


A very hot and dry July

Although it wasn’t the hottest month ever (as has been reported for the global temperature), locally it was still over 2 degrees higher than average making the hottest month since July of 2012.  It was also the first above average month we have seen this year, as well the 9 days over 30°C was well above the average of only 3.5 days.

July was very dry with only 39.8 mm of rain which is less than half the average of 98.6 mm.  It also wasn’t spread out very well with over half of the total coming on the 17th, leaving only a little bit more to be spread over the rest of the month.

This dry month brought the total precipitation for the year of 526.6 mm back down closer the average of 509.0 mm.


Summary for July 2019:
Maximum Temperature 33.3°C
Minimum Temperature 10.4°C
Average Daily High Temperature 28.7°C (Long term average 26.0°C)
Average Daily Low Temperature 15.8°C (Long term average 14.0°C)
Total Precipitation 39.8 mm (Long term average 98.6 mm)

(Long term averages based on 1981-2010 data for the Waterloo-Wellington Airport)


Monday, July 1, 2019

June 2019 Summary


A very average June for both temperature and precipitation

In contrast to the last few years when there were lots of June days at or above 30°C (8 in 2016, 3 in 2017, and 4 in 2018), there was only one day this past June when it just barely made it to 30°C.  Despite this, there were enough warm days to put the overall temperature at almost exactly at the average (well 0.04 degrees above, but let’s say that rounds off to 0.0).   The also marks the first month this year that was not at least a little bit below average.

There was also a pretty regular series of moderate storms that came through during the month to keep the precipitation within the average range, although the total precipitation of 73.6 mm was below the long term 1981-2010 average of 82.4 mm.

For the first half of the year, the total precipitation we have seen of 486.8 mm is not that far above what we would expect for the halfway mark of 416.1 mm.


Summary for June 2019:
Maximum Temperature 30.0°C
Minimum Temperature 4.4°C
Average Daily High Temperature 23.6°C (Long term average 23.6°C)
Average Daily Low Temperature 11.6°C (Long term average 11.5°C)
Total Precipitation 73.6 mm (Long term average 82.4 mm)

(Long term averages based on 1981-2010 data for the Waterloo-Wellington Airport)


Monday, June 3, 2019

May 2019 Summary


A cooler May (but still barely average) with lots of rain

Last year after a cold April, May came back extremely warm, this year not so much.  The first half of the month was about a full degree below average, but the second half was warm enough to put us at 0.7 degrees less than average overall for the month.  This was just warm enough to keep it within the average range.

Also, unlike last year when we had 3 days above 30°C, the highest temperature for May this year was only 27.5°C.  You have to go back 10 years to find a lower highest temperature of the month.

On the other end of the termometer, we didn’t have a temperature below zero during May, so that means the last one occurred on April 29.  This is on the early end of the range of Apr 26 to May 23 for the last below zero temperature we have seen in 20+ years of data at the UW Weather Station.

It was a wet month with a pretty good soaking every week or so that put the total of 103.4 mm well above the average of 82.3 mm.  With 4 wetter than average months in a row, it is not surprising that the total for the year is now 413.2 mm is now much higher than the 340.2 mm that we would expect for this time of the year.

Summary for May 2019:
Maximum Temperature 27.5°C
Minimum Temperature 0.5°C
Average Daily High Temperature 17.4°C (Long term average 18.5°C)
Average Daily Low Temperature 6.1°C (Long term average 6.4°C)
Total Precipitation 103.4 mm (Long term average 82.3 mm)

(Long term averages based on 1981-2010 data for the Waterloo-Wellington Airport)


Thursday, May 2, 2019

April 2019 Summary


An April that was colder and wetter than average, but maybe not unexpected

The few warm days were more than offset by many more cooler days putting the month at one degree below average overall.  But those averages are based on the 1981-2010 long term values and one of the shifts we have seen the past 10 years has been for much cooler spring months.

So if you were to compare this past April with just the last 5 years it would have been just average for temperature.  That’s why I said although the month was colder than the long term average maybe it wasn’t wholly unexpected when compared to the most recent years.

The precipitation was following the average until halfway through the month, but then we saw a lot of rain in the second half including 2 days with over 20 mm.  The final total was 117.2 mm which is much above the average of 74.5 mm.

It has also been a wet year so far with the total precipitation for the year now of 309.8 mm which is much more than the 264.4 mm we would expect at the end of April.

We didn’t get any measurable snow during April (there were times when it fell from the sky but didn’t stick on the ground).  Thus the total of 133.5 cm for the snowfall season was well below the average of 159.7 cm.


Summary for April 2019:
Maximum Temperature 19.6°C
Minimum Temperature -9.1°C
Average Daily High Temperature 9.9°C (Long term average 11.5°C)
Average Daily Low Temperature 0.5°C (Long term average 0.8°C)
Total Precipitation 117.2 mm (Long term average 74.5 mm)

(Long term averages based on 1981-2010 data for the Waterloo-Wellington Airport)


Thursday, April 4, 2019

March 2019 Summary


A cold and wet March that was mostly warm and dry (how did that happen?)

March was a month with many different faces. 

Starting with temperature, the first 9 days of the month were very cold, there were some days where the high temperatures were lower than the average low temperatures for those days.  Starting on the 10th, the temperature really rebounded, in fact if you take out those first 9 days, the rest of the month was about a degree above average.  However, we have to consider all the days and those first ones were so cold that it brought the overall temperature for March down to almost 1.5 degrees below average.

For precipitation, the little we saw in the first 29 days was on the way to becoming one of the driest of all time.  But once again, March threw us a curveball and on the last two days of the month we saw 41.8 mm of the month’s total precipitation of 63.6 mm.  This was just barely enough to get the month into the above average range by less than half a millimetre.

Part of that precipitation in the last few days came in the form of snow with 13 cm coming down, while the total of the month was only 17 cm.  This puts us at 133.5 cm for the snowfall season and the question remains if there will we see any more to get us closer to the average of 159.7 cm for entire season.

Summary for March 2019:
Maximum Temperature 11.0°C
Minimum Temperature -21.2°C
Average Daily High Temperature 2.6°C (Long term average 3.6°C)
Average Daily Low Temperature -7.3°C (Long term average -5.6°C)
Total Precipitation 63.6 mm (Long term average 61.0 mm)

(Long term averages based on 1981-2010 data for the Waterloo-Wellington Airport)


Saturday, March 2, 2019

February 2019 Summary


A snowy February with average temperatures

The month saw some dramatic temperature swings, starting with some lows below -20°C followed a couple of days later with a high above 10°C.  Then a week of colder than average temperatures was followed by almost a week of highs above zero.  Cold weather returned at the end of February with its coldest temperature of -26.7°C.

As often happens in a month with temperature swings like this, everything balances out and the overall temperature comes out to being about average, this happened in February with the overall temperature coming in at just 0.05 degrees below the average.

Not only was the total precipitation amount of 74.6 mm well above the average of 54.9 mm, there were also 20 days that showed some precipitation.  This is the highest number of days of precipitation in February since 2003.

A series of storms brought a lot of snow during February, 41.5 cm of snow fell which is much more than the average of 30.3 cm.  However, as we had a slow start to the snowfall season, even with this snowy month, the total we have seen far of 116.5 cm is still below the average of 125.6 for this point in the season.

Finally, if you haven’t already, there is still time to enter the annual UW Weather Station Contest.  We are looking for your guess for the first time the temperature will go above 20°C this spring.  Find out all the details and enter here: http://weather.uwaterloo.ca/contest/contest.html


Summary for February 2019:
Maximum Temperature 10.9°C
Minimum Temperature -26.7°C
Average Daily High Temperature -0.4°C (Long term average -1.2°C)
Average Daily Low Temperature -10.6°C (Long term average -9.7°C)
Total Precipitation 74.6 mm (Long term average 54.9 mm)

(Long term averages based on 1981-2010 data for the Waterloo-Wellington Airport)


Friday, February 1, 2019

January 2019 Summary


A cold January with average precipitation 

January was a month that had a lot of variations, there were days much above average in the beginning of the month and many much below average in the second half.  In fact, over half of the days of the month were 5 degrees or more either above or below the average.

The very cold end of the month brought the overall average temperature down to 1.7 degrees below average.  The high temperature on the 30th only got up to -17.2°C, this was the lowest daily high temperature since Feb 19, 2015 and only the 10th time there was such a cold day in the last 50 years.

The total precipitation that fell was 54.4 mm, less than the average of the 65.2 mm but within the above average range.  We had 40.5 cm of snowfall in January, which is just a little less than the average of 43.7 cm for the month.  The total snowfall since the beginning of the fall is 75 cm, this is less than the average of 95.3 cm for this point in the snowfall season.

Summary for January 2019:
Maximum Temperature 8.0°C
Minimum Temperature -25.7°C
Average Daily High Temperature -3.5°C (Long term average -2.6°C)
Average Daily Low Temperature -12.7°C (Long term average -10.3°C)
Total Precipitation 54.4 mm (Long term average 65.2 mm)

(Long term averages based on 1981-2010 data for the Waterloo-Wellington Airport)


Saturday, January 12, 2019

2018 Summary

University of Waterloo Weather Station Annual Summary - 2018

Missing Seasons Alert!
If anyone knows the whereabouts of the Spring and Fall of 2018
please contact the UW Weather Station

Although this is a bit of an exaggeration, the year 2018 saw a rapid transition both between colder and warmer temperatures in May and then back again in mid-October.  Typically, both the Spring and Fall see times when the temperatures will swing between warmer and colder episodes, but this year it seemed like the transitions happened within a day.  It is hard to quantify just how unique this is, but by looking over the temperature graphs from the past 10 years I couldn’t see anything like it.

The year started out really cold, in fact the coldest temperatures of the 2018 occurred in the first few hours of the year on New Year’s Day.  These were followed by days with lows in the minus 20s, however just a week later there were days with highs over 10°C.  This oscillation of temperatures continued into February and included the high of 15.6°C on the 20th which was not only the highest February temperature in over 100 years of weather data in the region, it was also the highest temperature we saw until April 12th. 

Then came a good example of weather whiplash, with April setting the record for the coldest April in the region’s records followed by May which was the warmest.  Summer really started in May, a month which saw 8 days above 25°C (something that has only happened one other time during May) and another streak of 3 days over 30°C.

The warmer than average temperatures continued in June and July including the warmest June day since 2005 (on the 17th when it was 33.4°C) and 10 days in July over 30°C (the average is only 3.5).

But the real heat was still to come, as August was almost 3 degrees higher than average and the second warmest in the past 20 years.  This was followed by a September that was 3.5 degrees higher than average (the 5th warmest in the historical record) and gave us one heat wave with 5 days over 30°C followed by a second one with 5 more days that were over 25°C.

All this heat came to a crashing halt in mid-October with temperatures dropping by 10 degrees after the 12th.  The cold continued in November, which was the coldest since 1996 and the 5th coldest in the region’s history.  This colder pattern continued into mid-December after which we saw a bit of a warm up, resulting in the overall December temperature coming in at 2 degrees above average.

The 2018 overall average temperature was 0.9 degrees above the 1981-2010 average, but only just a little above the average for the last 10 years.

As for precipitation, the first few months of the year were wet with only March coming in drier than average.  One highlight was a period of 3 days in April with 72.6 mm of precipitation, which is almost as much as the average for the month.  This wet start to 2018 turned around in June which saw 12 dry days and a dry first half of July.  This brought the total for the year back into the average range where it pretty much stayed for the rest of the year except for a wet few weeks at the end of October.

The final total precipitation for 2018 of 950.1 mm was only a little over the average of 916.3 mm and well within the average range.

Frank Seglenieks
weather@uwaterloo.ca
University of Waterloo Weather Station Coordinator

Summary for 2018:
Average Daily High Temperature: 12.71°C (average 12.05ºC)
Average Daily Low Temperature: 3.03°C  (average 1.94ºC)
Total Precipitation: 950.1 mm (average 916.3 mm)


(averages are calculated from 1981-2010 data for the Waterloo-Wellington Airport)

Click on the image below to see the temperature chart:

Click on the image below to see the precipitation chart:

Tuesday, January 1, 2019

December 2018 Summary


A warm December with average precipitation and low snowfall

After a start to the month that was a bit colder than average (except for the 2nd when it shot up to 13.5°C, the high temperature for the month), it was generally a bit warmer than average for the rest of December.  The overall average temperature came in at 2 degrees above the average.

A very rainy last few hours of the month pushed the total to just a half a mm above the average of 71.2 mm.  It shouldn’t be surprising with the higher temperatures that December only saw 11.5 cm of snow, much less than the average of 37.2 cm for the month.

Summary for December 2018:
Maximum Temperature 13.5°C
Minimum Temperature -12.7°C
Average Daily High Temperature 1.7°C (Long term average 0.2°C)
Average Daily Low Temperature -4.2°C (Long term average -6.8°C)
Total Precipitation 71.6 mm (Long term average 71.2 mm)

(Long term averages based on 1981-2010 data for the Waterloo-Wellington Airport)