Monday, June 3, 2019

May 2019 Summary


A cooler May (but still barely average) with lots of rain

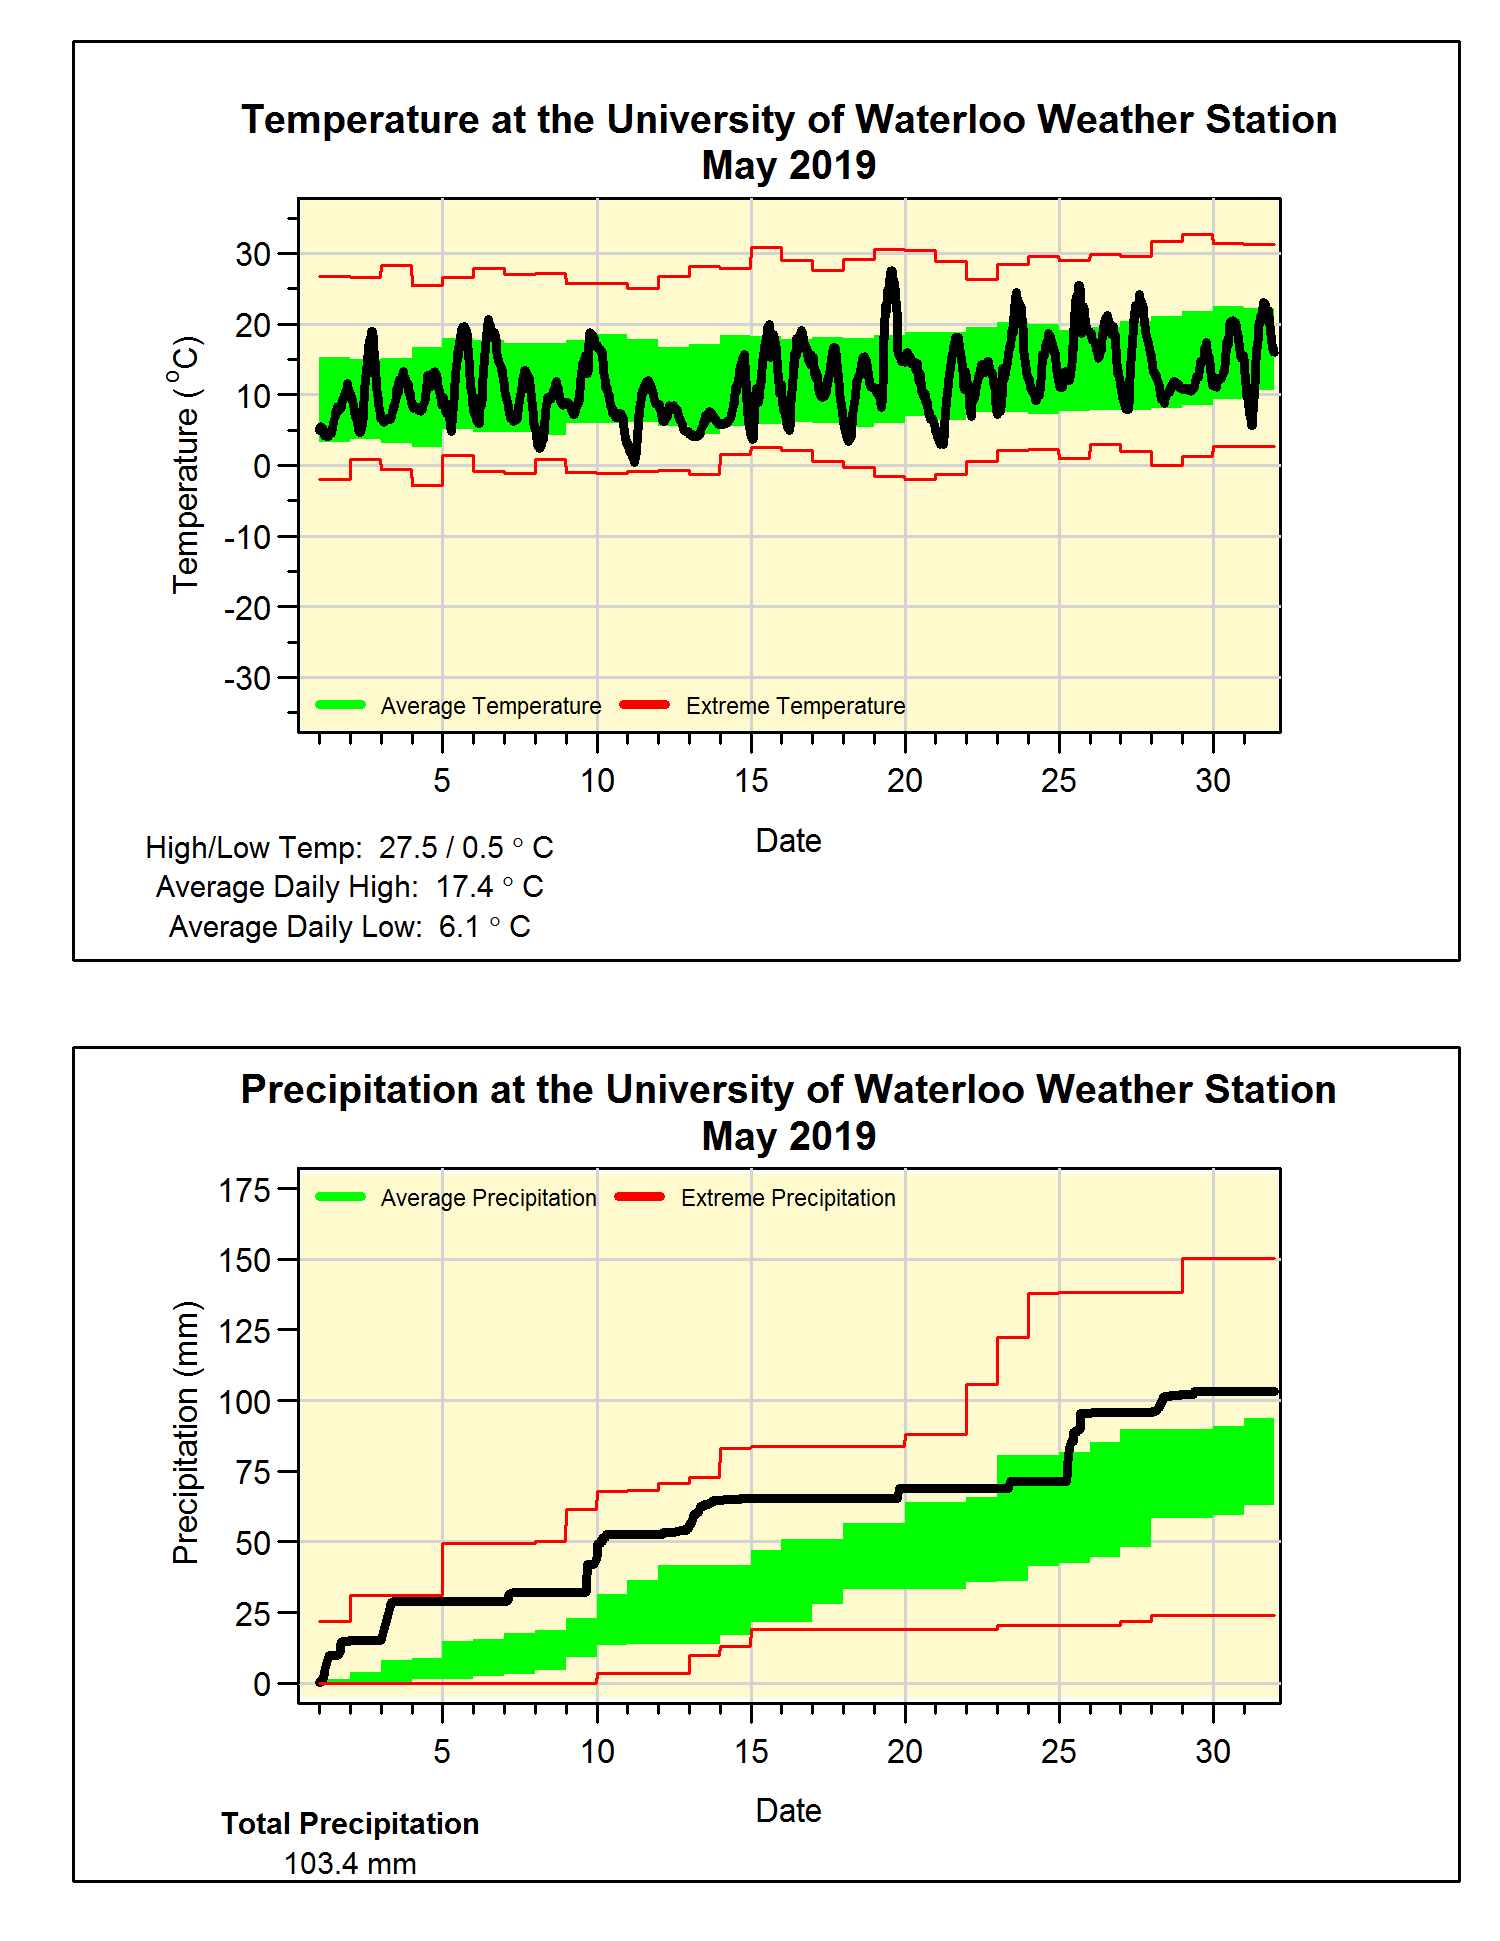
Last year after a cold April, May came back extremely warm, this year not so much.  The first half of the month was about a full degree below average, but the second half was warm enough to put us at 0.7 degrees less than average overall for the month.  This was just warm enough to keep it within the average range.

Also, unlike last year when we had 3 days above 30°C, the highest temperature for May this year was only 27.5°C.  You have to go back 10 years to find a lower highest temperature of the month.

On the other end of the termometer, we didn’t have a temperature below zero during May, so that means the last one occurred on April 29.  This is on the early end of the range of Apr 26 to May 23 for the last below zero temperature we have seen in 20+ years of data at the UW Weather Station.

It was a wet month with a pretty good soaking every week or so that put the total of 103.4 mm well above the average of 82.3 mm.  With 4 wetter than average months in a row, it is not surprising that the total for the year is now 413.2 mm is now much higher than the 340.2 mm that we would expect for this time of the year.

Summary for May 2019:
Maximum Temperature 27.5°C
Minimum Temperature 0.5°C
Average Daily High Temperature 17.4°C (Long term average 18.5°C)
Average Daily Low Temperature 6.1°C (Long term average 6.4°C)
Total Precipitation 103.4 mm (Long term average 82.3 mm)

(Long term averages based on 1981-2010 data for the Waterloo-Wellington Airport)

Thursday, May 2, 2019

April 2019 Summary


An April that was colder and wetter than average, but maybe not unexpected

The few warm days were more than offset by many more cooler days putting the month at one degree below average overall.  But those averages are based on the 1981-2010 long term values and one of the shifts we have seen the past 10 years has been for much cooler spring months.

So if you were to compare this past April with just the last 5 years it would have been just average for temperature.  That’s why I said although the month was colder than the long term average maybe it wasn’t wholly unexpected when compared to the most recent years.

The precipitation was following the average until halfway through the month, but then we saw a lot of rain in the second half including 2 days with over 20 mm.  The final total was 117.2 mm which is much above the average of 74.5 mm.

It has also been a wet year so far with the total precipitation for the year now of 309.8 mm which is much more than the 264.4 mm we would expect at the end of April.

We didn’t get any measurable snow during April (there were times when it fell from the sky but didn’t stick on the ground).  Thus the total of 133.5 cm for the snowfall season was well below the average of 159.7 cm.


Summary for April 2019:
Maximum Temperature 19.6°C
Minimum Temperature -9.1°C
Average Daily High Temperature 9.9°C (Long term average 11.5°C)
Average Daily Low Temperature 0.5°C (Long term average 0.8°C)
Total Precipitation 117.2 mm (Long term average 74.5 mm)

(Long term averages based on 1981-2010 data for the Waterloo-Wellington Airport)


Thursday, April 4, 2019

March 2019 Summary


A cold and wet March that was mostly warm and dry (how did that happen?)

March was a month with many different faces. 

Starting with temperature, the first 9 days of the month were very cold, there were some days where the high temperatures were lower than the average low temperatures for those days.  Starting on the 10th, the temperature really rebounded, in fact if you take out those first 9 days, the rest of the month was about a degree above average.  However, we have to consider all the days and those first ones were so cold that it brought the overall temperature for March down to almost 1.5 degrees below average.

For precipitation, the little we saw in the first 29 days was on the way to becoming one of the driest of all time.  But once again, March threw us a curveball and on the last two days of the month we saw 41.8 mm of the month’s total precipitation of 63.6 mm.  This was just barely enough to get the month into the above average range by less than half a millimetre.

Part of that precipitation in the last few days came in the form of snow with 13 cm coming down, while the total of the month was only 17 cm.  This puts us at 133.5 cm for the snowfall season and the question remains if there will we see any more to get us closer to the average of 159.7 cm for entire season.

Summary for March 2019:
Maximum Temperature 11.0°C
Minimum Temperature -21.2°C
Average Daily High Temperature 2.6°C (Long term average 3.6°C)
Average Daily Low Temperature -7.3°C (Long term average -5.6°C)
Total Precipitation 63.6 mm (Long term average 61.0 mm)

(Long term averages based on 1981-2010 data for the Waterloo-Wellington Airport)


Saturday, March 2, 2019

February 2019 Summary


A snowy February with average temperatures

The month saw some dramatic temperature swings, starting with some lows below -20°C followed a couple of days later with a high above 10°C.  Then a week of colder than average temperatures was followed by almost a week of highs above zero.  Cold weather returned at the end of February with its coldest temperature of -26.7°C.

As often happens in a month with temperature swings like this, everything balances out and the overall temperature comes out to being about average, this happened in February with the overall temperature coming in at just 0.05 degrees below the average.

Not only was the total precipitation amount of 74.6 mm well above the average of 54.9 mm, there were also 20 days that showed some precipitation.  This is the highest number of days of precipitation in February since 2003.

A series of storms brought a lot of snow during February, 41.5 cm of snow fell which is much more than the average of 30.3 cm.  However, as we had a slow start to the snowfall season, even with this snowy month, the total we have seen far of 116.5 cm is still below the average of 125.6 for this point in the season.

Finally, if you haven’t already, there is still time to enter the annual UW Weather Station Contest.  We are looking for your guess for the first time the temperature will go above 20°C this spring.  Find out all the details and enter here: http://weather.uwaterloo.ca/contest/contest.html


Summary for February 2019:
Maximum Temperature 10.9°C
Minimum Temperature -26.7°C
Average Daily High Temperature -0.4°C (Long term average -1.2°C)
Average Daily Low Temperature -10.6°C (Long term average -9.7°C)
Total Precipitation 74.6 mm (Long term average 54.9 mm)

(Long term averages based on 1981-2010 data for the Waterloo-Wellington Airport)


Friday, February 1, 2019

January 2019 Summary


A cold January with average precipitation 

January was a month that had a lot of variations, there were days much above average in the beginning of the month and many much below average in the second half.  In fact, over half of the days of the month were 5 degrees or more either above or below the average.

The very cold end of the month brought the overall average temperature down to 1.7 degrees below average.  The high temperature on the 30th only got up to -17.2°C, this was the lowest daily high temperature since Feb 19, 2015 and only the 10th time there was such a cold day in the last 50 years.

The total precipitation that fell was 54.4 mm, less than the average of the 65.2 mm but within the above average range.  We had 40.5 cm of snowfall in January, which is just a little less than the average of 43.7 cm for the month.  The total snowfall since the beginning of the fall is 75 cm, this is less than the average of 95.3 cm for this point in the snowfall season.

Summary for January 2019:
Maximum Temperature 8.0°C
Minimum Temperature -25.7°C
Average Daily High Temperature -3.5°C (Long term average -2.6°C)
Average Daily Low Temperature -12.7°C (Long term average -10.3°C)
Total Precipitation 54.4 mm (Long term average 65.2 mm)

(Long term averages based on 1981-2010 data for the Waterloo-Wellington Airport)