Monday, November 2, 2020

October 2020 Summary

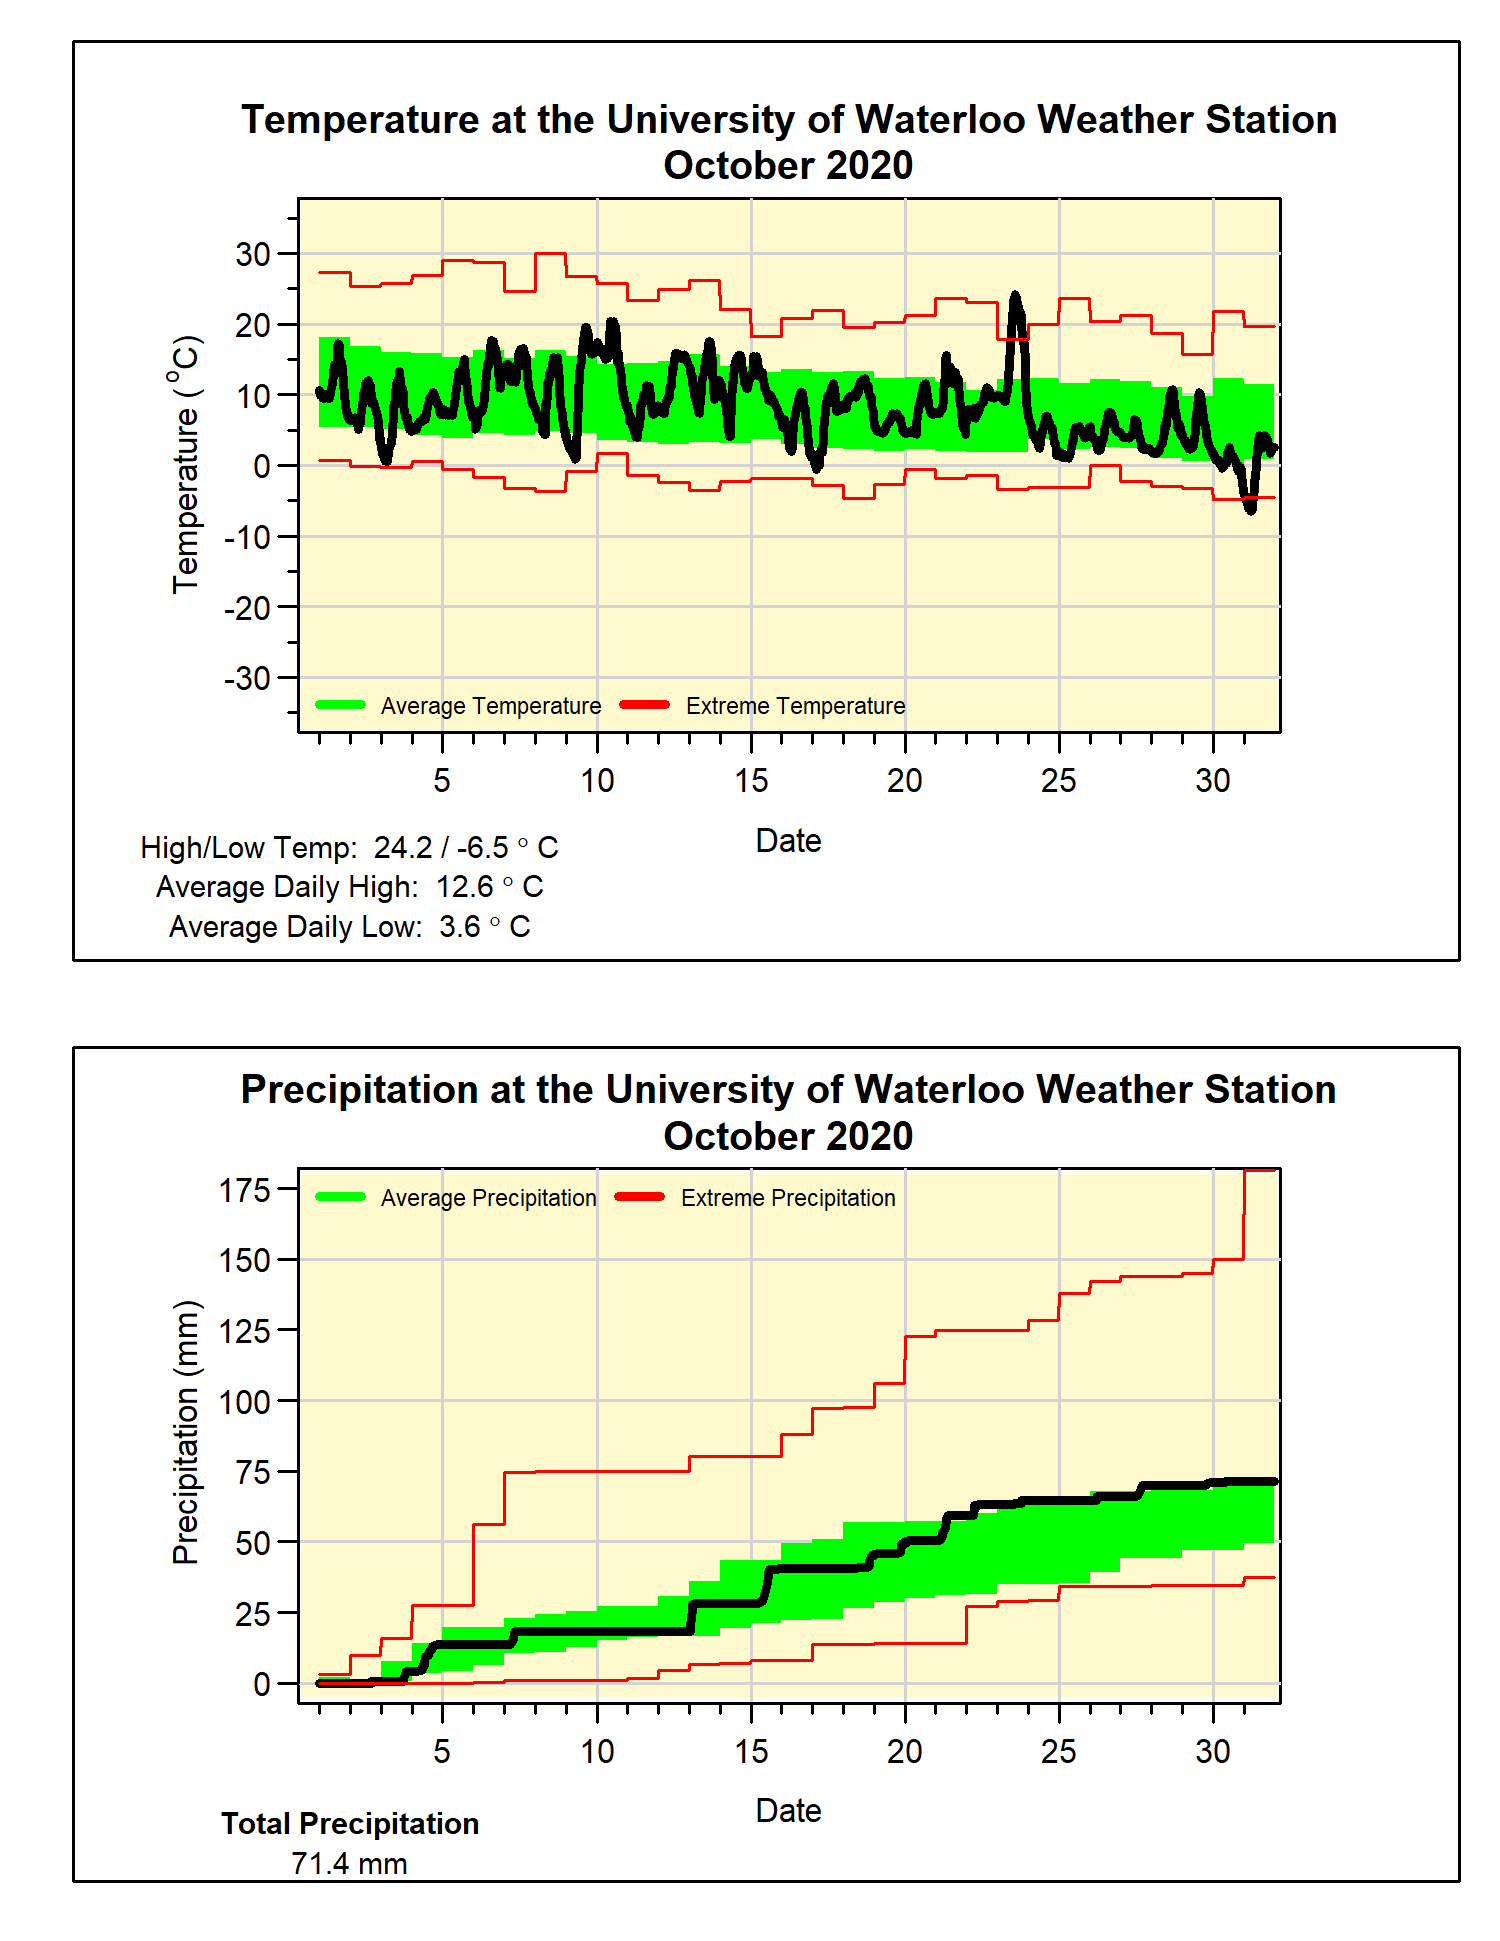
An average October for both temperature and precipitation

Although this was the coldest October in over 10 years, it was still only 0.1 degrees below the average, putting it well within the average range.  This is because October has been one of the most above average months in the past decade, after both September and August.

Looking at the graph, you can see just how much the high of 24.2°C on the 23rd was a blip compared to the rest of the month.  As the average temperature goes down a lot between the beginning and end of the month, it is rare that the highest temperature would occur that late.  In fact, that was the warmest day in the second half of October since 1968 when it was 24.4°C on the 17th.

The month started off with pretty average precipitation, got a bit wetter in the middle an ended off dry.  The total was 71.4 mm, a bit above the average of 67.4 mm and just within the average range for the month.

Random fact: we have only had one October that was drier than average in the past 10 years.

This slightly above average month resulted in the total precipitation since January (825.1 mm) staying above the average for this time of year (750.6 mm).


Summary for October 2020:
Maximum Temperature 24.2°C
Minimum Temperature -6.5°C
Average Daily High Temperature 12.6°C (Long term average 13.5°C)
Average Daily Low Temperature 3.6°C (Long term average 2.9°C)
Total Precipitation 71.4 mm (Long term average 67.4 mm)

(Long term averages based on 1981-2010 data for the Waterloo-Wellington Airport)


Sunday, October 4, 2020

September 2020 Summary

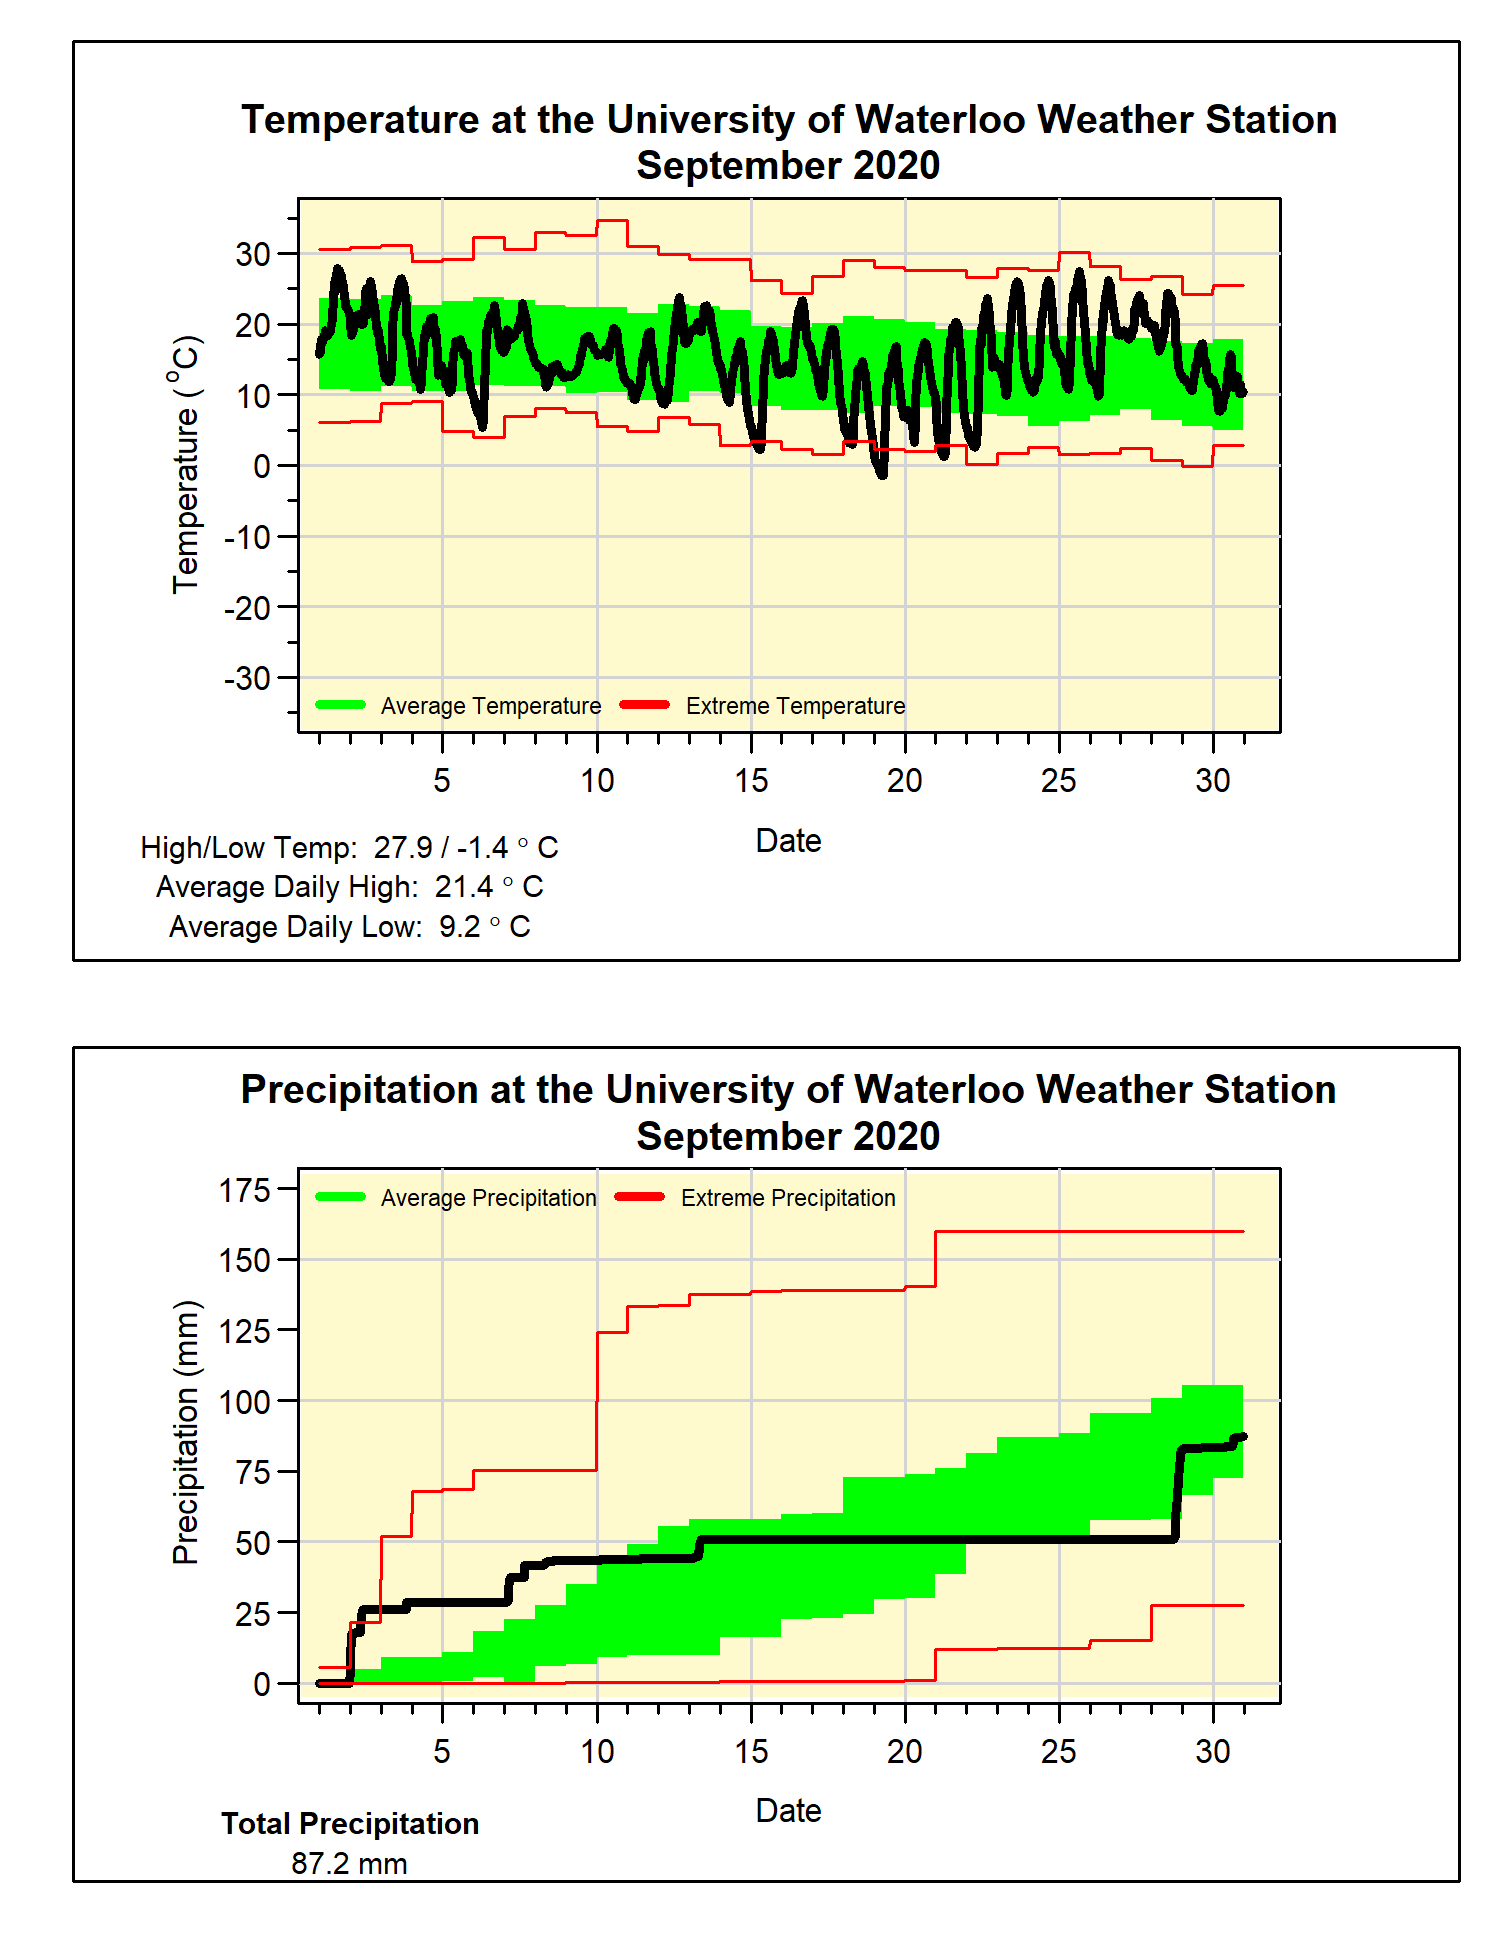
Another warm September with average precipitation

I know it seems that every September I talk about how consistently warm the month is compared to the other months of the year.  Well it turns out it is not just my imagination, here is a map (albeit for the US) of which month has warmed the most in the last 30 years:

https://twitter.com/Climatologist49/status/1307864627452149760

and you can see that around the Great Lakes that month is consistently September.

Although we saw some cooler temperatures, the pattern continued as the overall temperature was 0.8 degrees above average.  There were some cold nights during the month, but these were offset by almost a week that got to the mid-20s at the end of the month.

One of those cold nights happened on the 19th when the temperature actually went below zero for the first time since the spring.  This is the earliest it has happened in the 22 year history of the weather station and the coldest September temperature since September 30, 1993.

And now a riddle: What is wet on both ends and dry in the middle? 

Answer: September 2020.  

We saw 28.6 mm in the first 3 days of the month and 36.2 mm in the last 3 days, and only 22.4 mm in the other 24 days.  This included a stretch of 2 weeks with no rain at all between the 14th and 27th.  The total of 87.2 mm was just a little below the average of 87.8 mm for the month.

For the year so far, we have seen 753.7 mm of precipitation which is above the average of 683.5 mm for this time of year.

Summary for September 2020:
Maximum Temperature 27.9°C
Minimum Temperature -1.4°C
Average Daily High Temperature 21.4°C (Long term average 20.4°C)
Average Daily Low Temperature 9.2°C (Long term average 8.6°C)
Total Precipitation 87.8 mm (Long term average 87.8 mm)

(Long term averages based on 1981-2010 data for the Waterloo-Wellington Airport)


Wednesday, September 2, 2020

August 2020 Summary

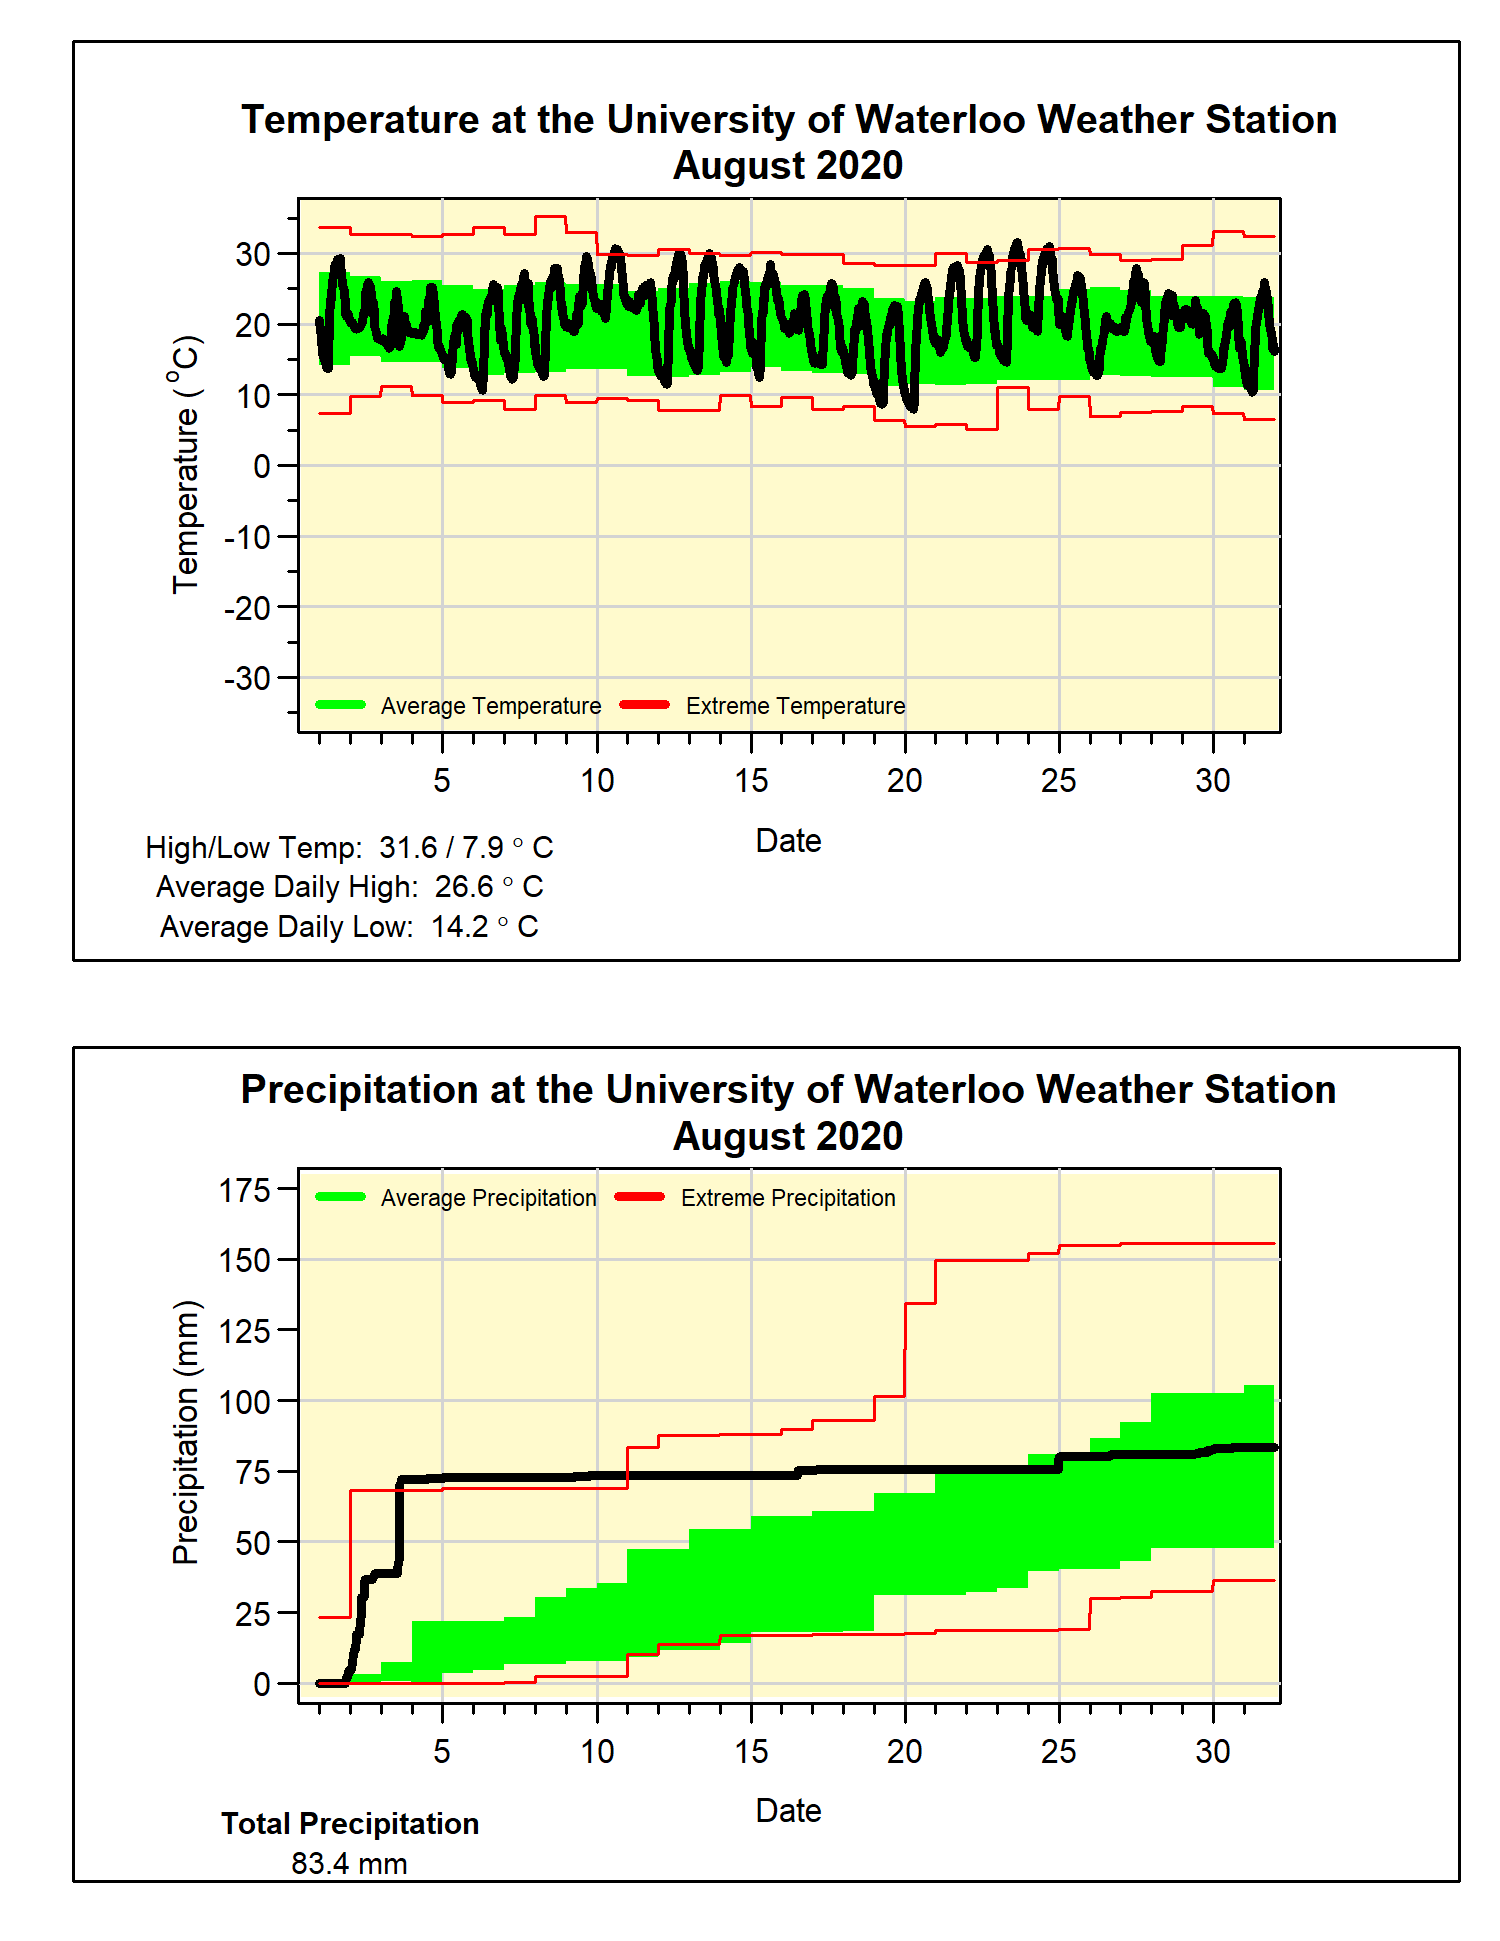
A hot August that was both wet but also dry

Although it wasn’t as hot as July, August did continue the pattern of hot summer temperatures.  The heat was consistent with the longest stretch of colder than average temperatures being only 3 days.  Overall it was 1.5 degrees above average, contributing to that were 6 days above 30°C, a lot more than the 2 we usually see.

Why did the headline say it was both wet and dry?  In the first three days of the month we saw 72.2 mm of precipitation (more than the average total for 5 months of the year) but then only 11.2 mm the rest of the month.  So both wet and dry.  The total precipitation for the month of 83.4 mm was just a smidge lower than the average of 83.9 mm.

The total precipitation we have seen so far in 2020 of 666.5 mm is still above the average of 596.0 mm for this time of year.

Summary for August 2020:
Maximum Temperature 31.6°C
Minimum Temperature 7.9°C
Average Daily High Temperature 26.6°C (Long term average 24.8°C)
Average Daily Low Temperature 14.2°C (Long term average 12.9°C)
Total Precipitation 83.4 mm (Long term average 83.9 mm)

(Long term averages based on 1981-2010 data for the Waterloo-Wellington Airport)


Monday, August 3, 2020

July 2020 Summary

The third hottest July on record with average precipitation

The month started with a string of 10 days above 30°C, followed by days that were either at or above average (only one day was below average).  So it shouldn’t be a surprise that it was the third hottest July we have seen in the over 100 years of records in the region, 1.3 degrees away from the hottest back in 1955.

Other notes from the month: 

- the 15 days over 30°C was well above the July average of only 3.5 days
- the 10 days in a row over 30°C was the longest streak for any month since the 11 days from August 25th to September 4th 1953
- the 34.5°C reported on July 9th was the hottest July temperature since the 35.7°C on July 21, 2011 and the hottest day of any month since Sept 10, 2013 when it was 34.7°C

Although the total precipitation of 80.0 mm was just within the average range, almost all of it came during just 3 days of the month.  This means that there were also a few long dry streaks during the month, so it might have felt like it was drier than average.

The total precipitation so far this year of 583.1 mm is still above the average of 509.0 mm.

Summary for July 2020:
Maximum Temperature 34.5°C
Minimum Temperature 12.0°C
Average Daily High Temperature 29.6°C (Long term average 26.0°C)
Average Daily Low Temperature 16.6°C (Long term average 14.0°C)
Total Precipitation 80.0 mm (Long term average 98.6 mm)

(Long term averages based on 1981-2010 data for the Waterloo-Wellington Airport)


Wednesday, July 1, 2020

June 2020 Summary


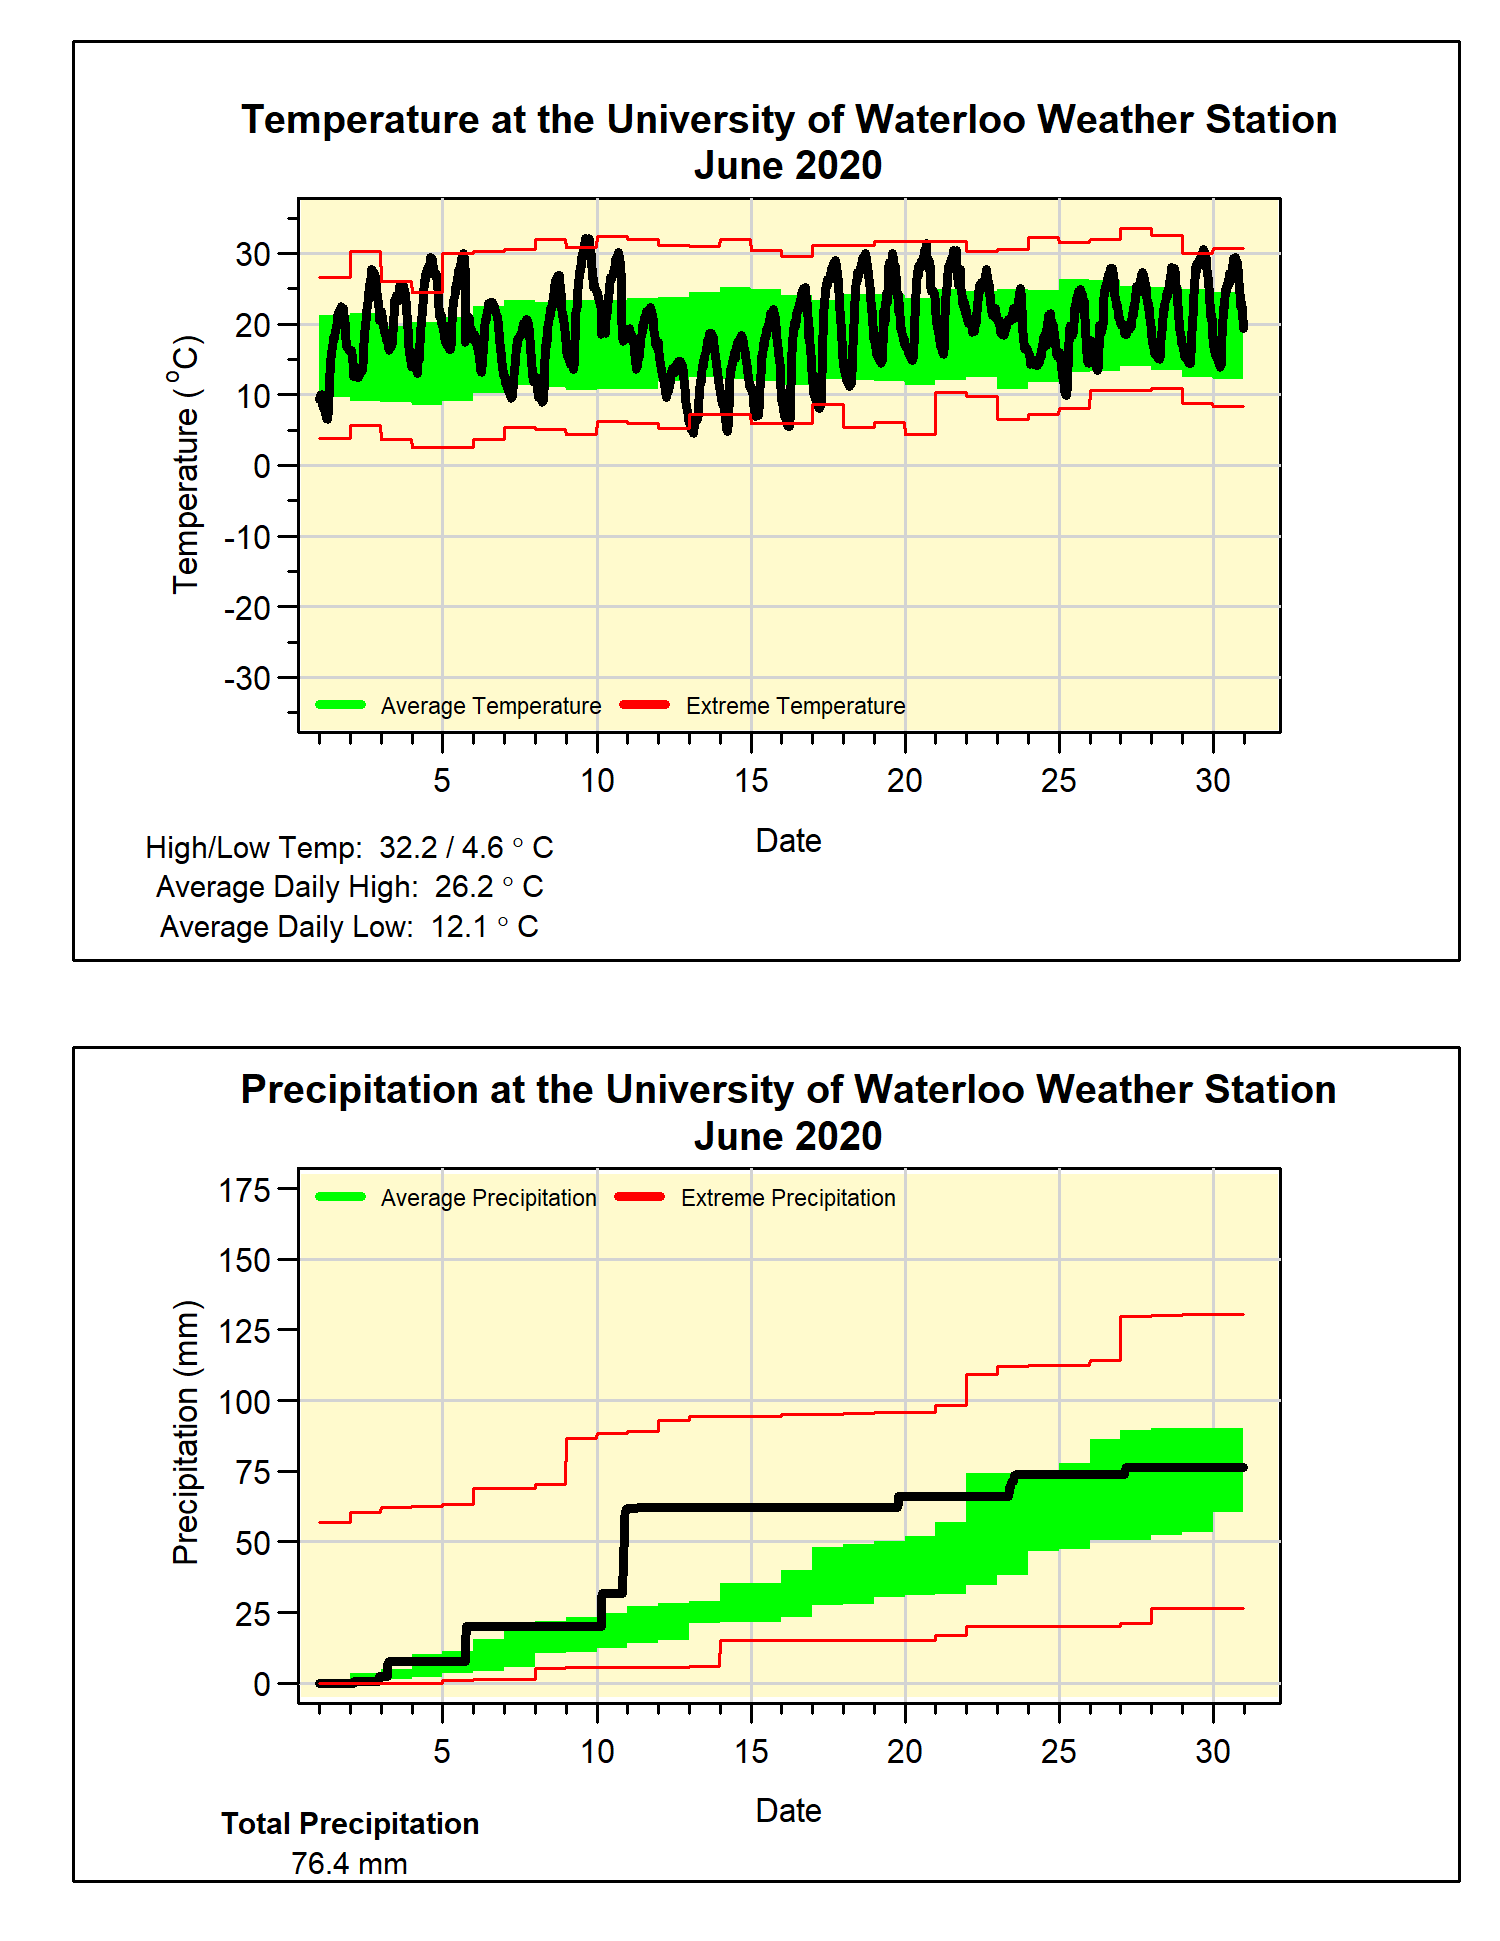
A hot June with average precipitation 

There were lots of really hot days in June, including 8 days above 30°C, while we typically average only 2 of those days.  With only one cool spell that lasted just 3 days, the average overall temperature was 1.6 degrees above average.  This made it the hottest June since 2005.

Although the total precipitation of 76.4 mm was only a little below the average of 82.4 mm, this masks the fact that it was really a very dry month.  This discrepancy is a result of over half the month’s precipitation coming in one day (41.8 mm on June 10th), but only about 15 mm came down the rest of the month. 

For the first half of the year, the total precipitation we have seen of 503.1 mm is well above the average total of 416.1 mm at the halfway mark.  Most of this above average total is still a result of the very wet January.


Summary for June 2020:
Maximum Temperature 32.2°C
Minimum Temperature 4.6°C
Average Daily High Temperature 26.2°C (Long term average 23.6°C)
Average Daily Low Temperature 12.2°C (Long term average 11.5°C)
Total Precipitation 76.4 mm (Long term average 82.4 mm)

(Long term averages based on 1981-2010 data for the Waterloo-Wellington Airport)