University of Waterloo Weather Station Annual Summary - 2020
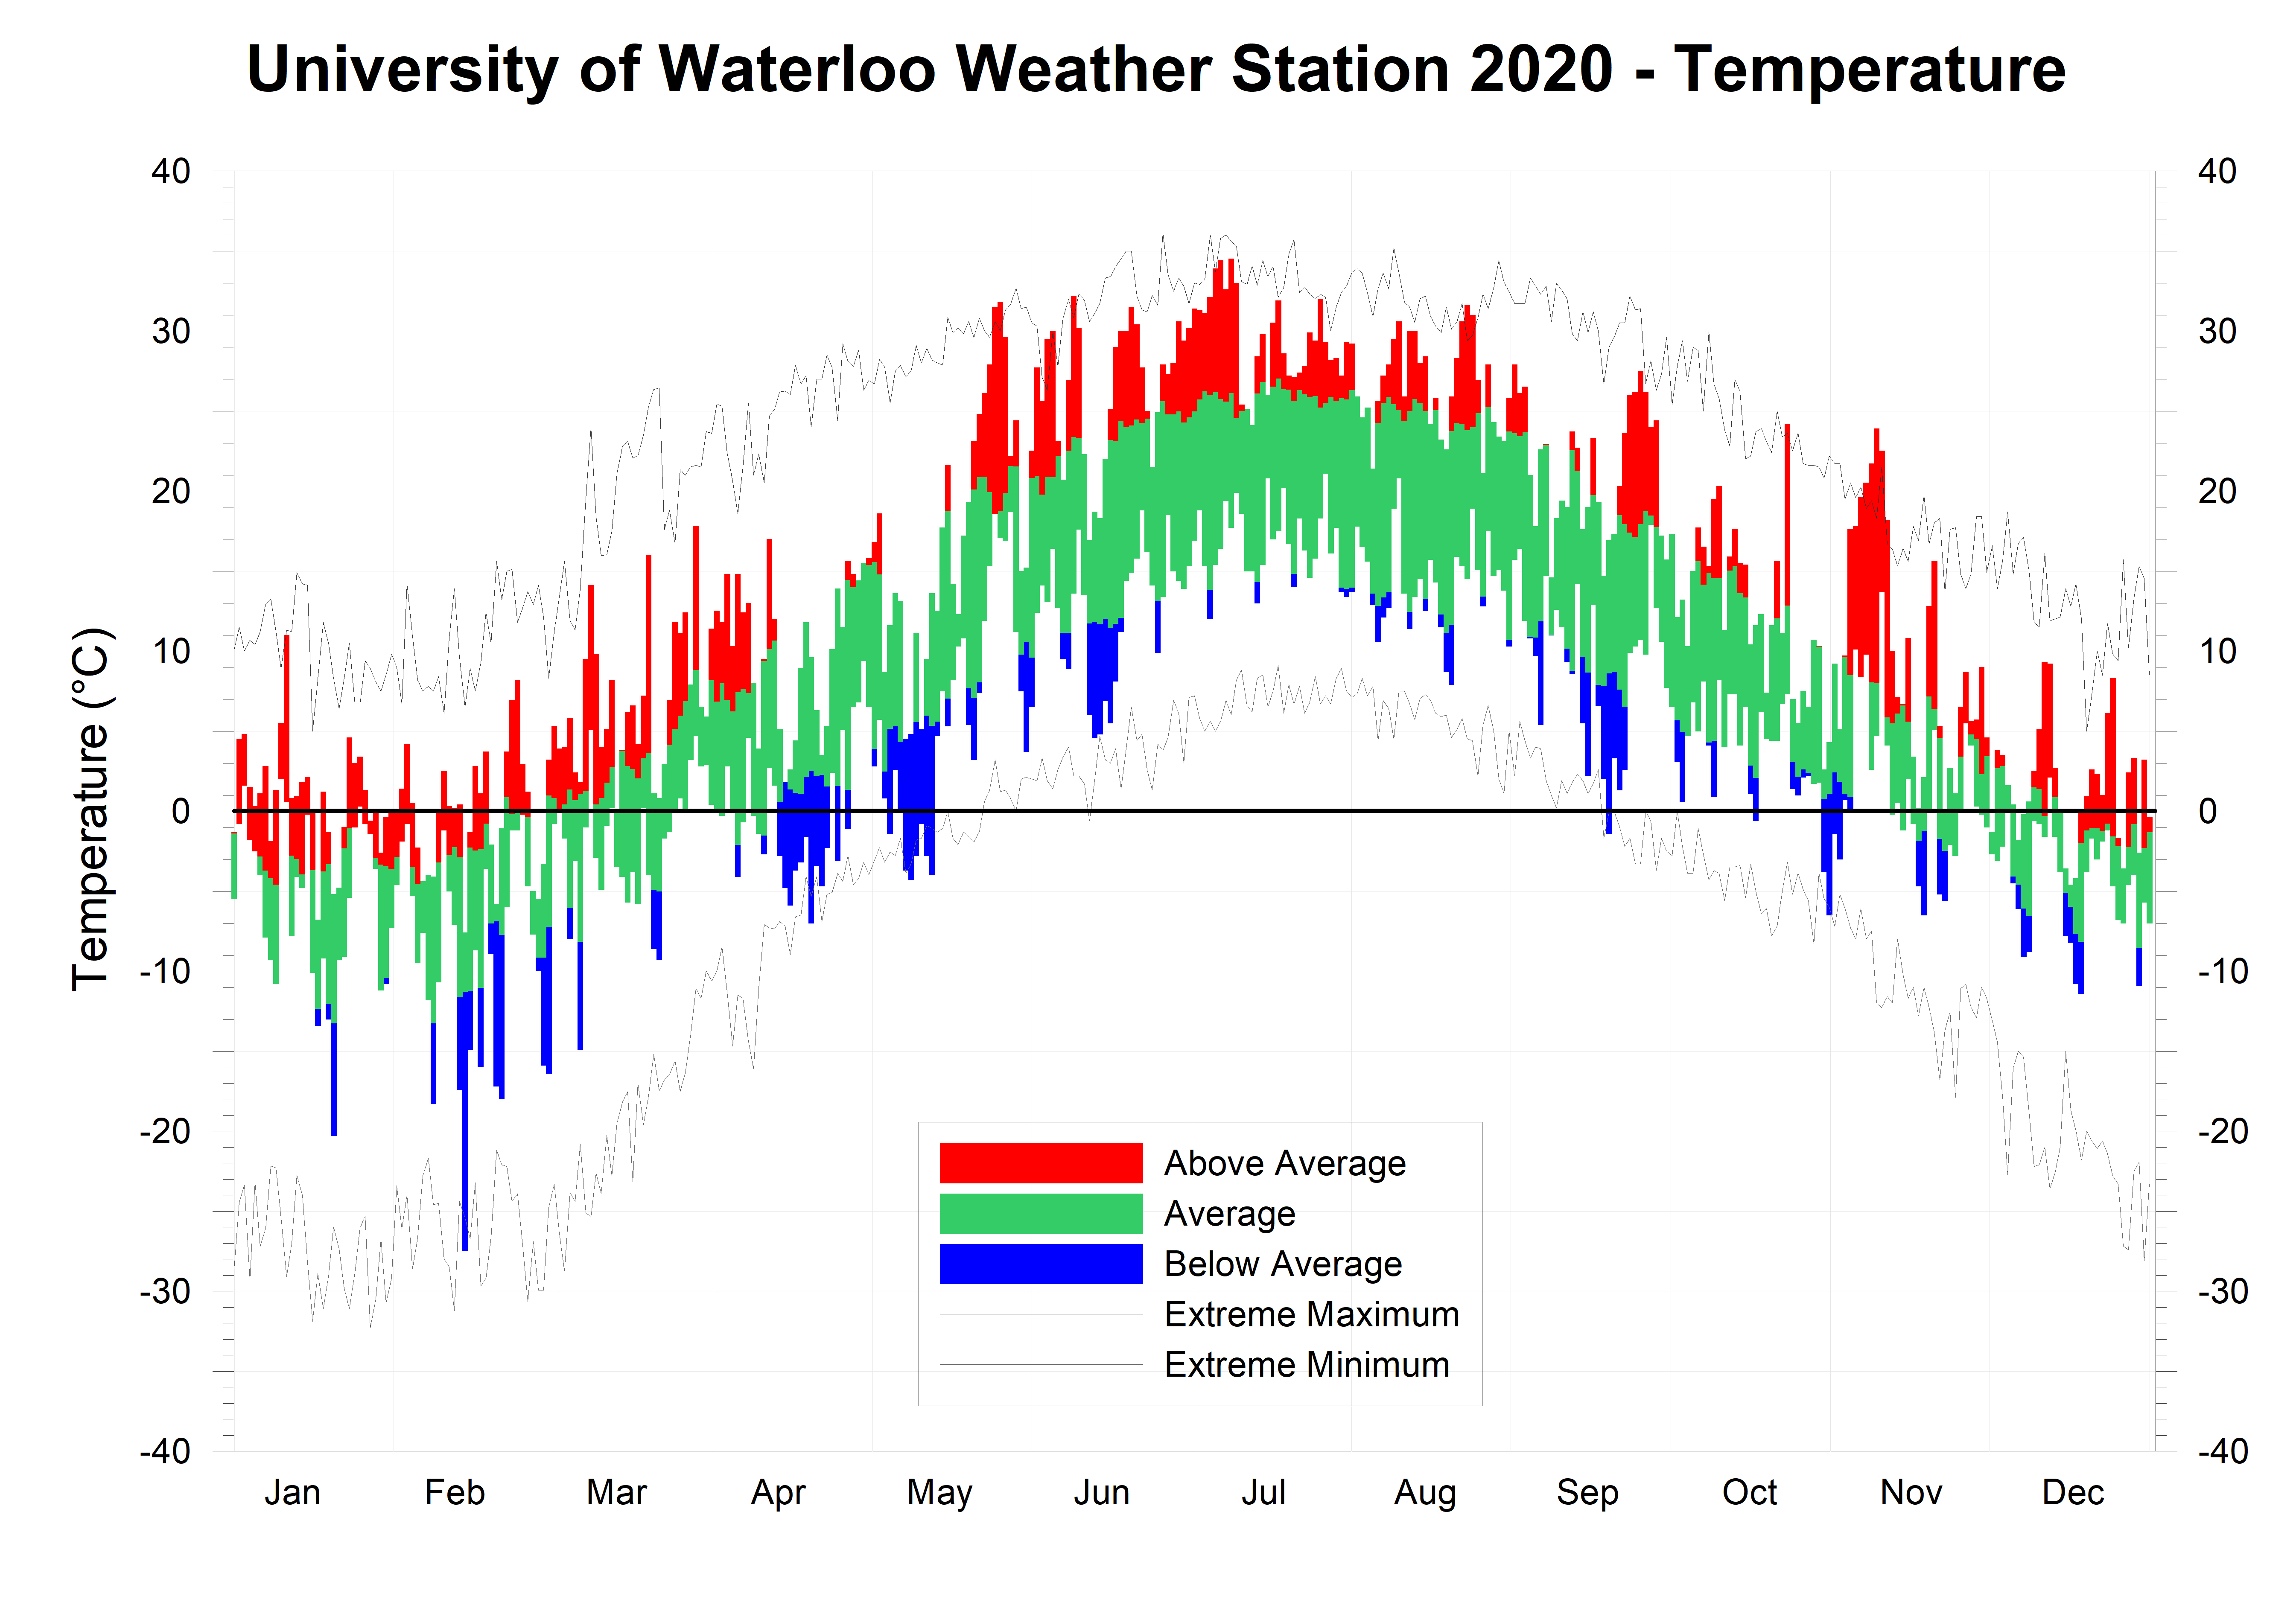
The year 2020 saw some really warm months, many others that were just pretty warm and only two that were colder than average. There were a couple of historic streaks of warm temperatures, one in July that included the hottest day in almost 7 years, and the other was the warm start of November, that saw the second highest ever November temperature. Averaged over the entire year, the temperature was 1.5 degrees above average which puts it at the eighth warmest in the over 100 years of weather records in the region which started in 1914.
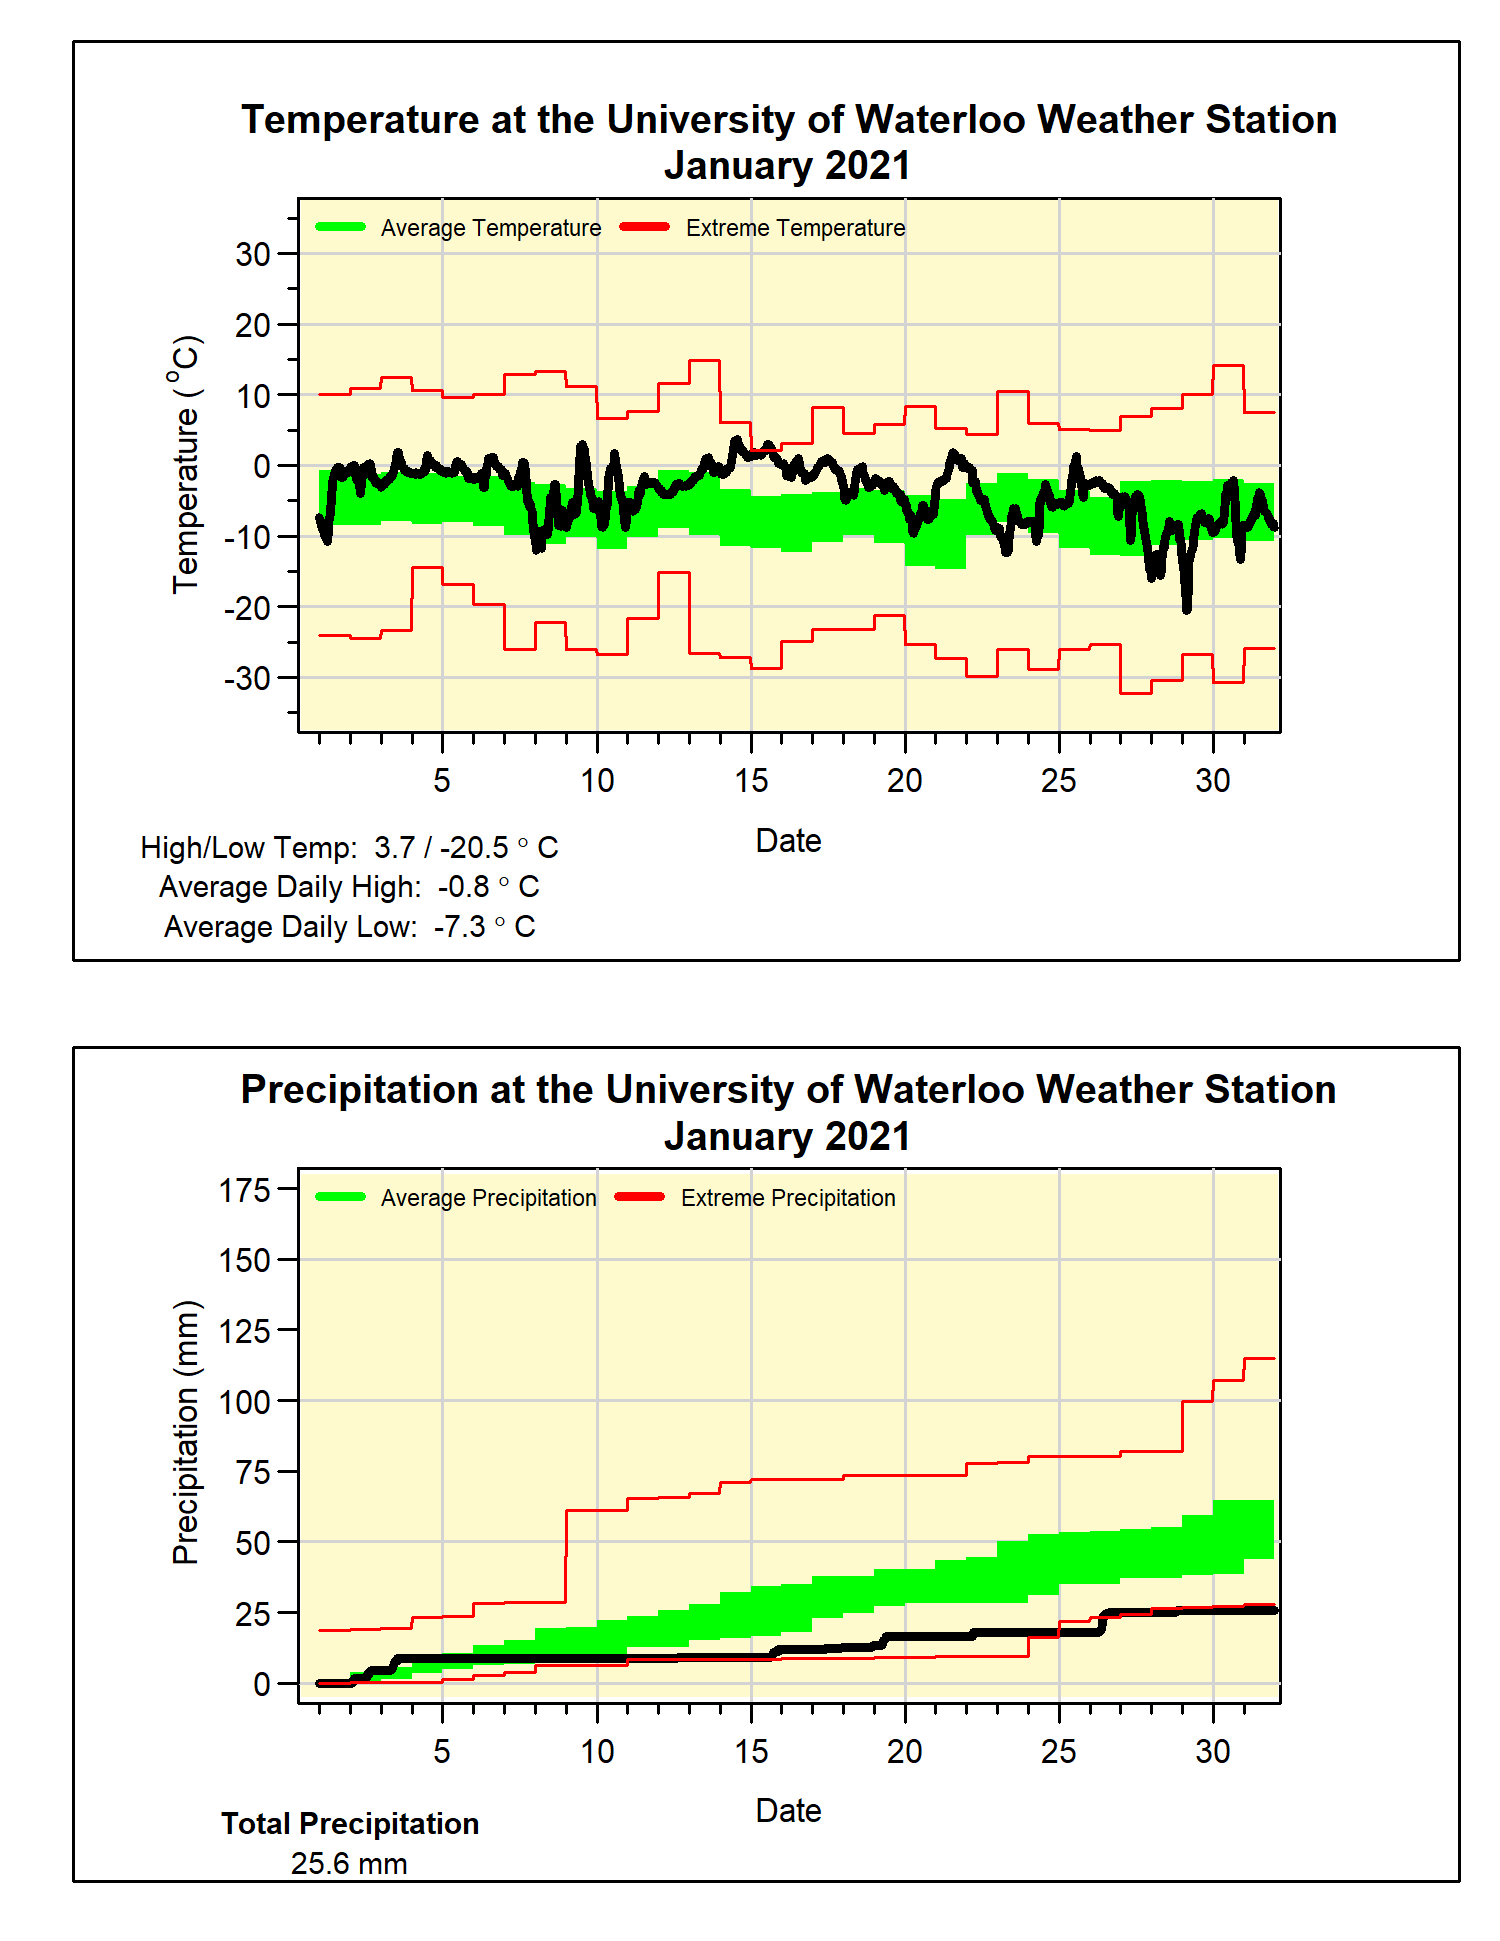
The year started off really warm, with January coming in at almost 4 degrees above average, which was the 6th warmest January in our region’s weather history and the warmest January since 2006. Although it was just a bit warmer than average in February, the warmth really came back in March when for only the second time in our weather history the temperature went above zero every day during the month.
Then came April and May, which were the only two colder than average months of the year. There were a few historical temperatures in May including: the low of -4.3°C on May 9, which was tied for the 3rd lowest May temperature in our weather history; the month saw not only the latest date (May 16) for the winner of the UW Weather Station Contest (when the temperature goes above 20°C), but this was also the latest 20°C day in the last 100 years; on the other end of the scale, on May 26, the high temperature of 31.8°C, was the 5th warmest day in May on record.
The summer months of June, July, and August were all much above average. There were lots of really hot days in June, including 8 days above 30°C, while we typically average only 2 of those days. July started with a string of 10 days above 30°C, which was the longest streak for any month since 1953, and the 34.5°C reported on July 9th was the hottest day of any month since Sept 10, 2013. So it shouldn’t be a surprise that it was the third hottest July we have seen in the region’s weather history. Although it wasn’t as hot as July, August did continue the pattern of high summer temperatures at 1.5 degrees above average, contributing to that were 6 days above 30°C, a lot more than the 2 we usually see.
Overall, September was 0.8 degrees above average, but on the 19th the temperature went below zero for the first time since the spring. This is the earliest it has happened in the 22 year history of the weather station and the coldest daily September temperature since September 30, 1993.
The month of October was just barely (0.1 degrees) below average, but an interesting day was the high of 24.2°C on the 23rd which was the warmest day in the second half of October since 1968.
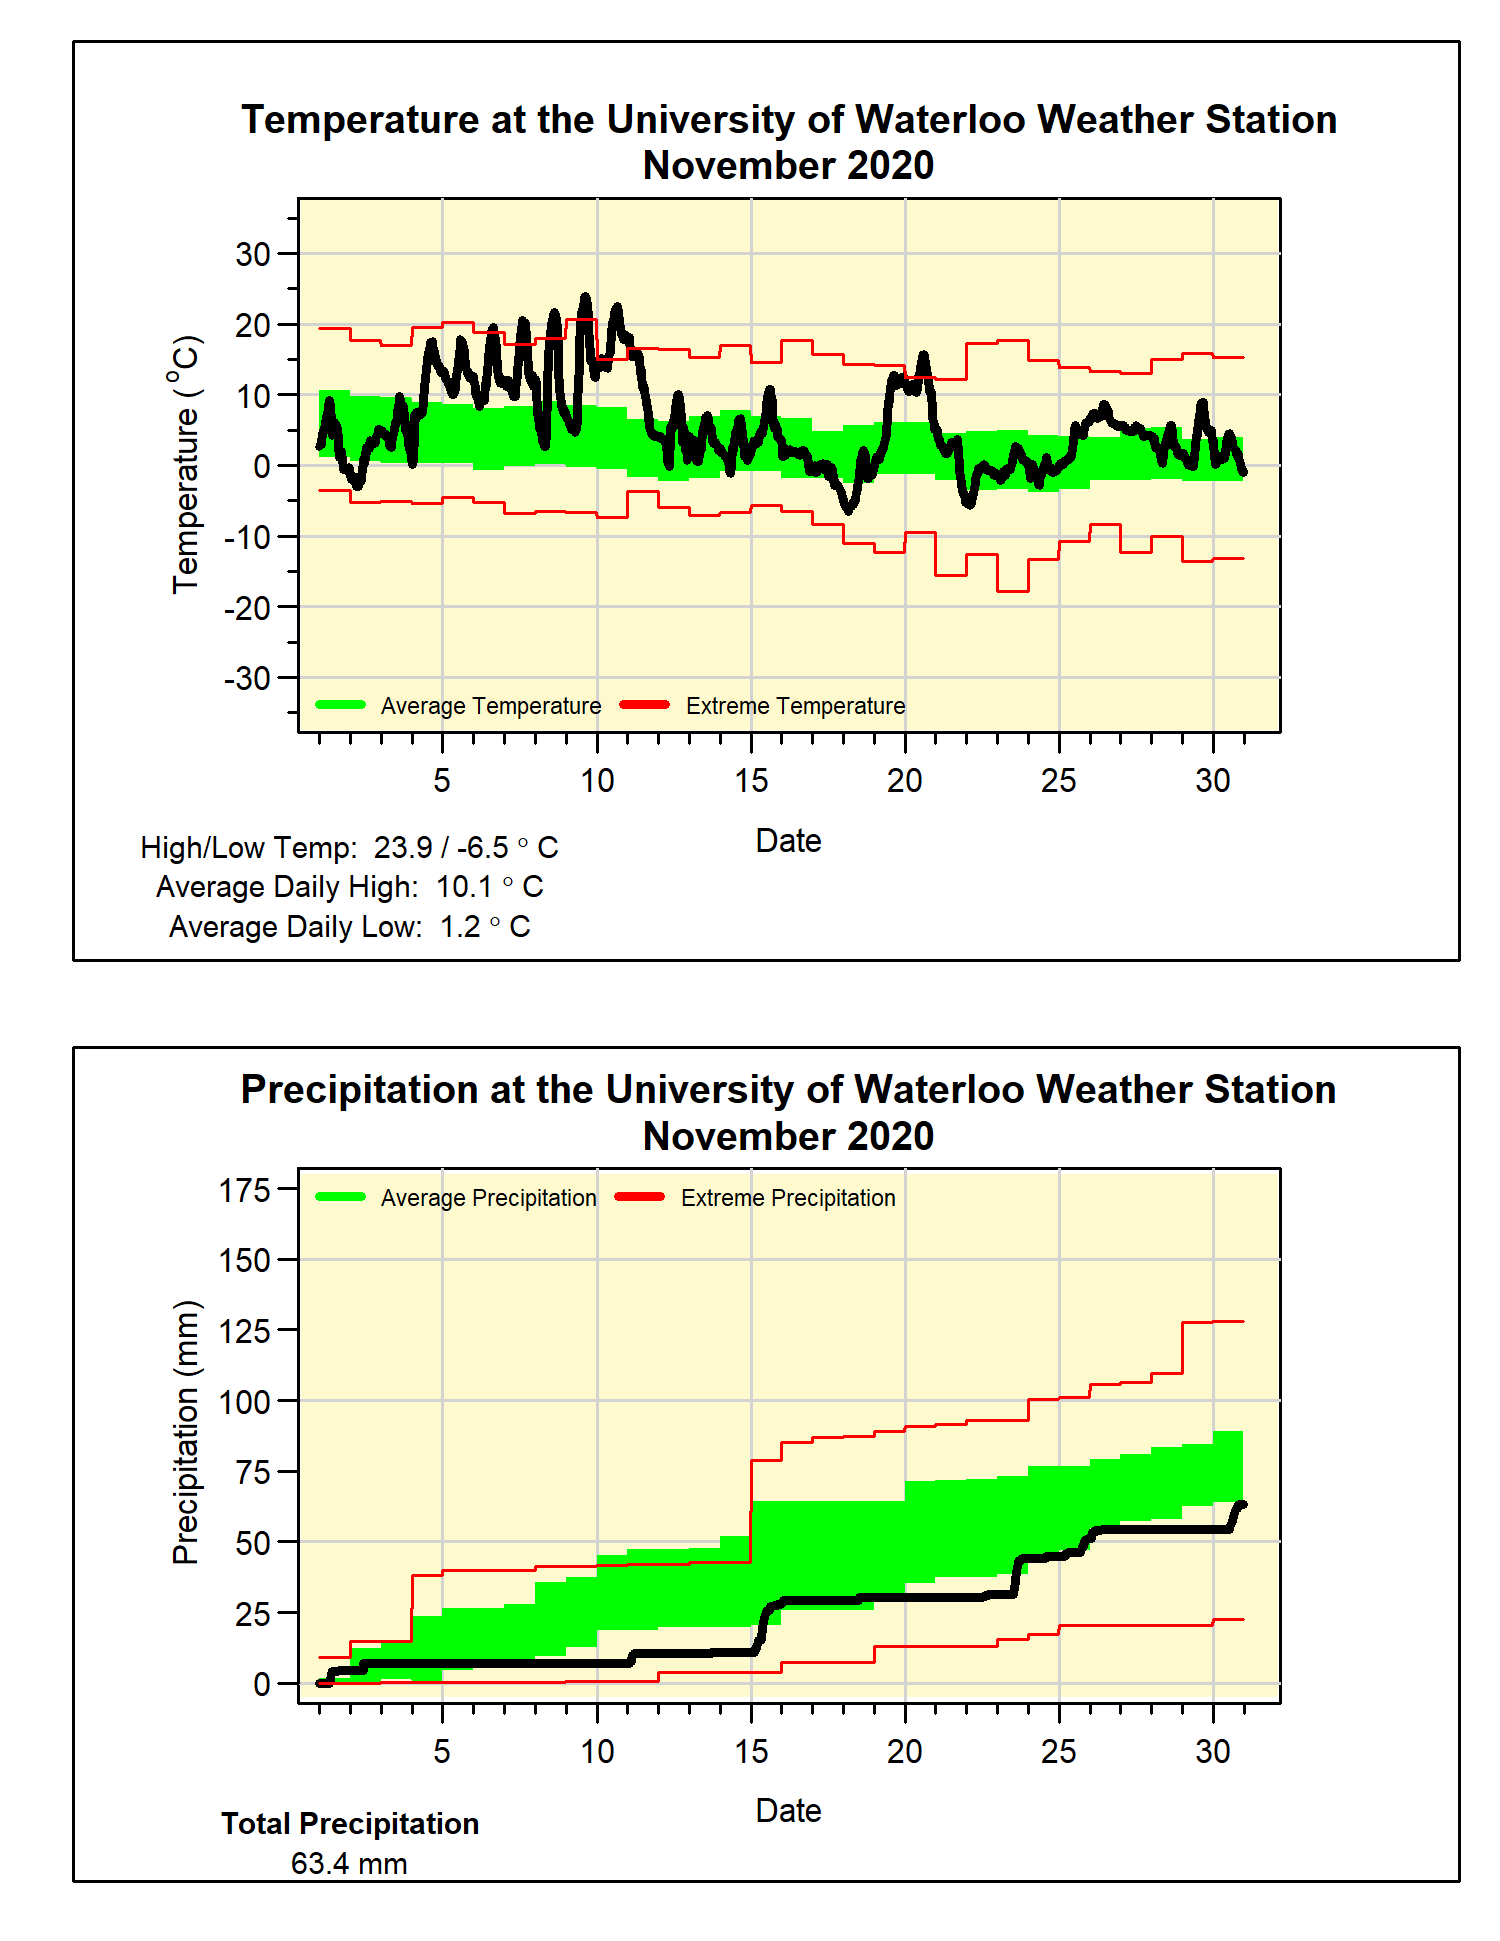
The warmer than average temperatures returned in November when it was more than 3 degrees above average, the 5th warmest November in our weather history. This was a result of a week of record breaking temperatures at the start of the month. The records that fell include: the high on the 9th of 23.9°C was the second highest November temperature for the region, we had 4 days in a row over 20°C which was the longest such streak in November, and finally the 8 days in a row above 15°C beat the previous longest streak of 7 days.
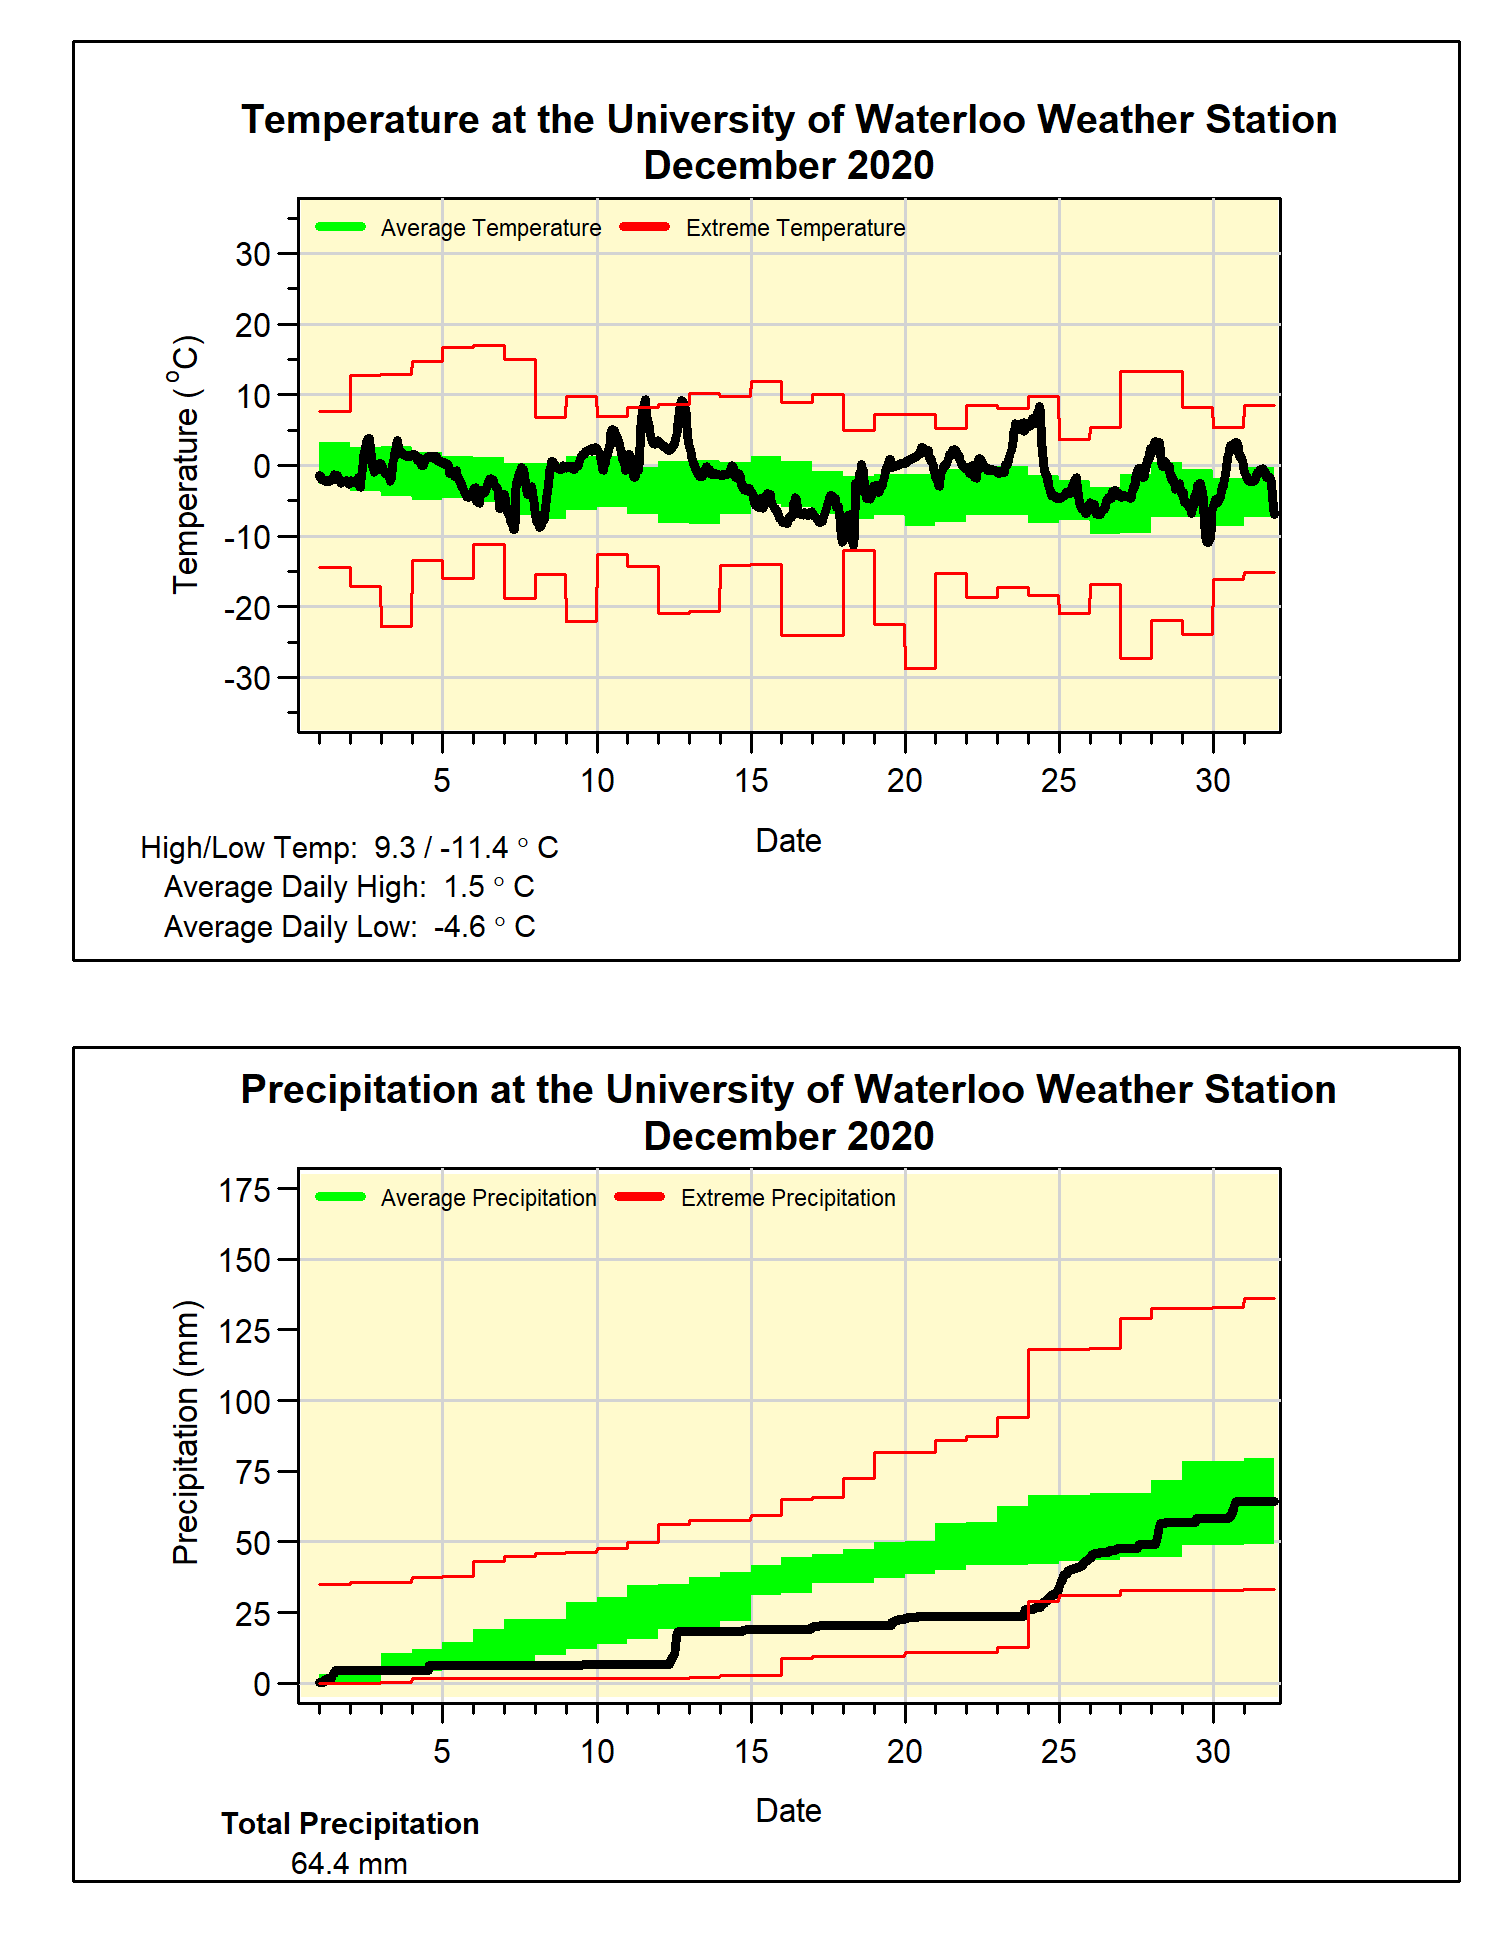
The year ended with a warm December, that was 1.7 degrees higher than average with only a few cold days during the month.
The biggest story for precipitation was the heavy rain that fell on January 11th, it started in the morning and lasted the entire day, ending with a total of 79.6 mm. This was almost double the previous record single day’s precipitation in January of 43.0 mm and more than the average for the entire month. Not only that, it was the wettest day for any month since July 7, 1991 when 82.0 mm came down. This resulted in it being the wettest January on record in the region.
The other record that fell was the highest 15 minute precipitation in the history of the UW Weather Station, when we experienced 24.8 mm of rain at 6:45 pm on July 10th. Note that before the establishment of the UW Weather station in 1998 there were no measurements of 15 minute precipitation in the region.
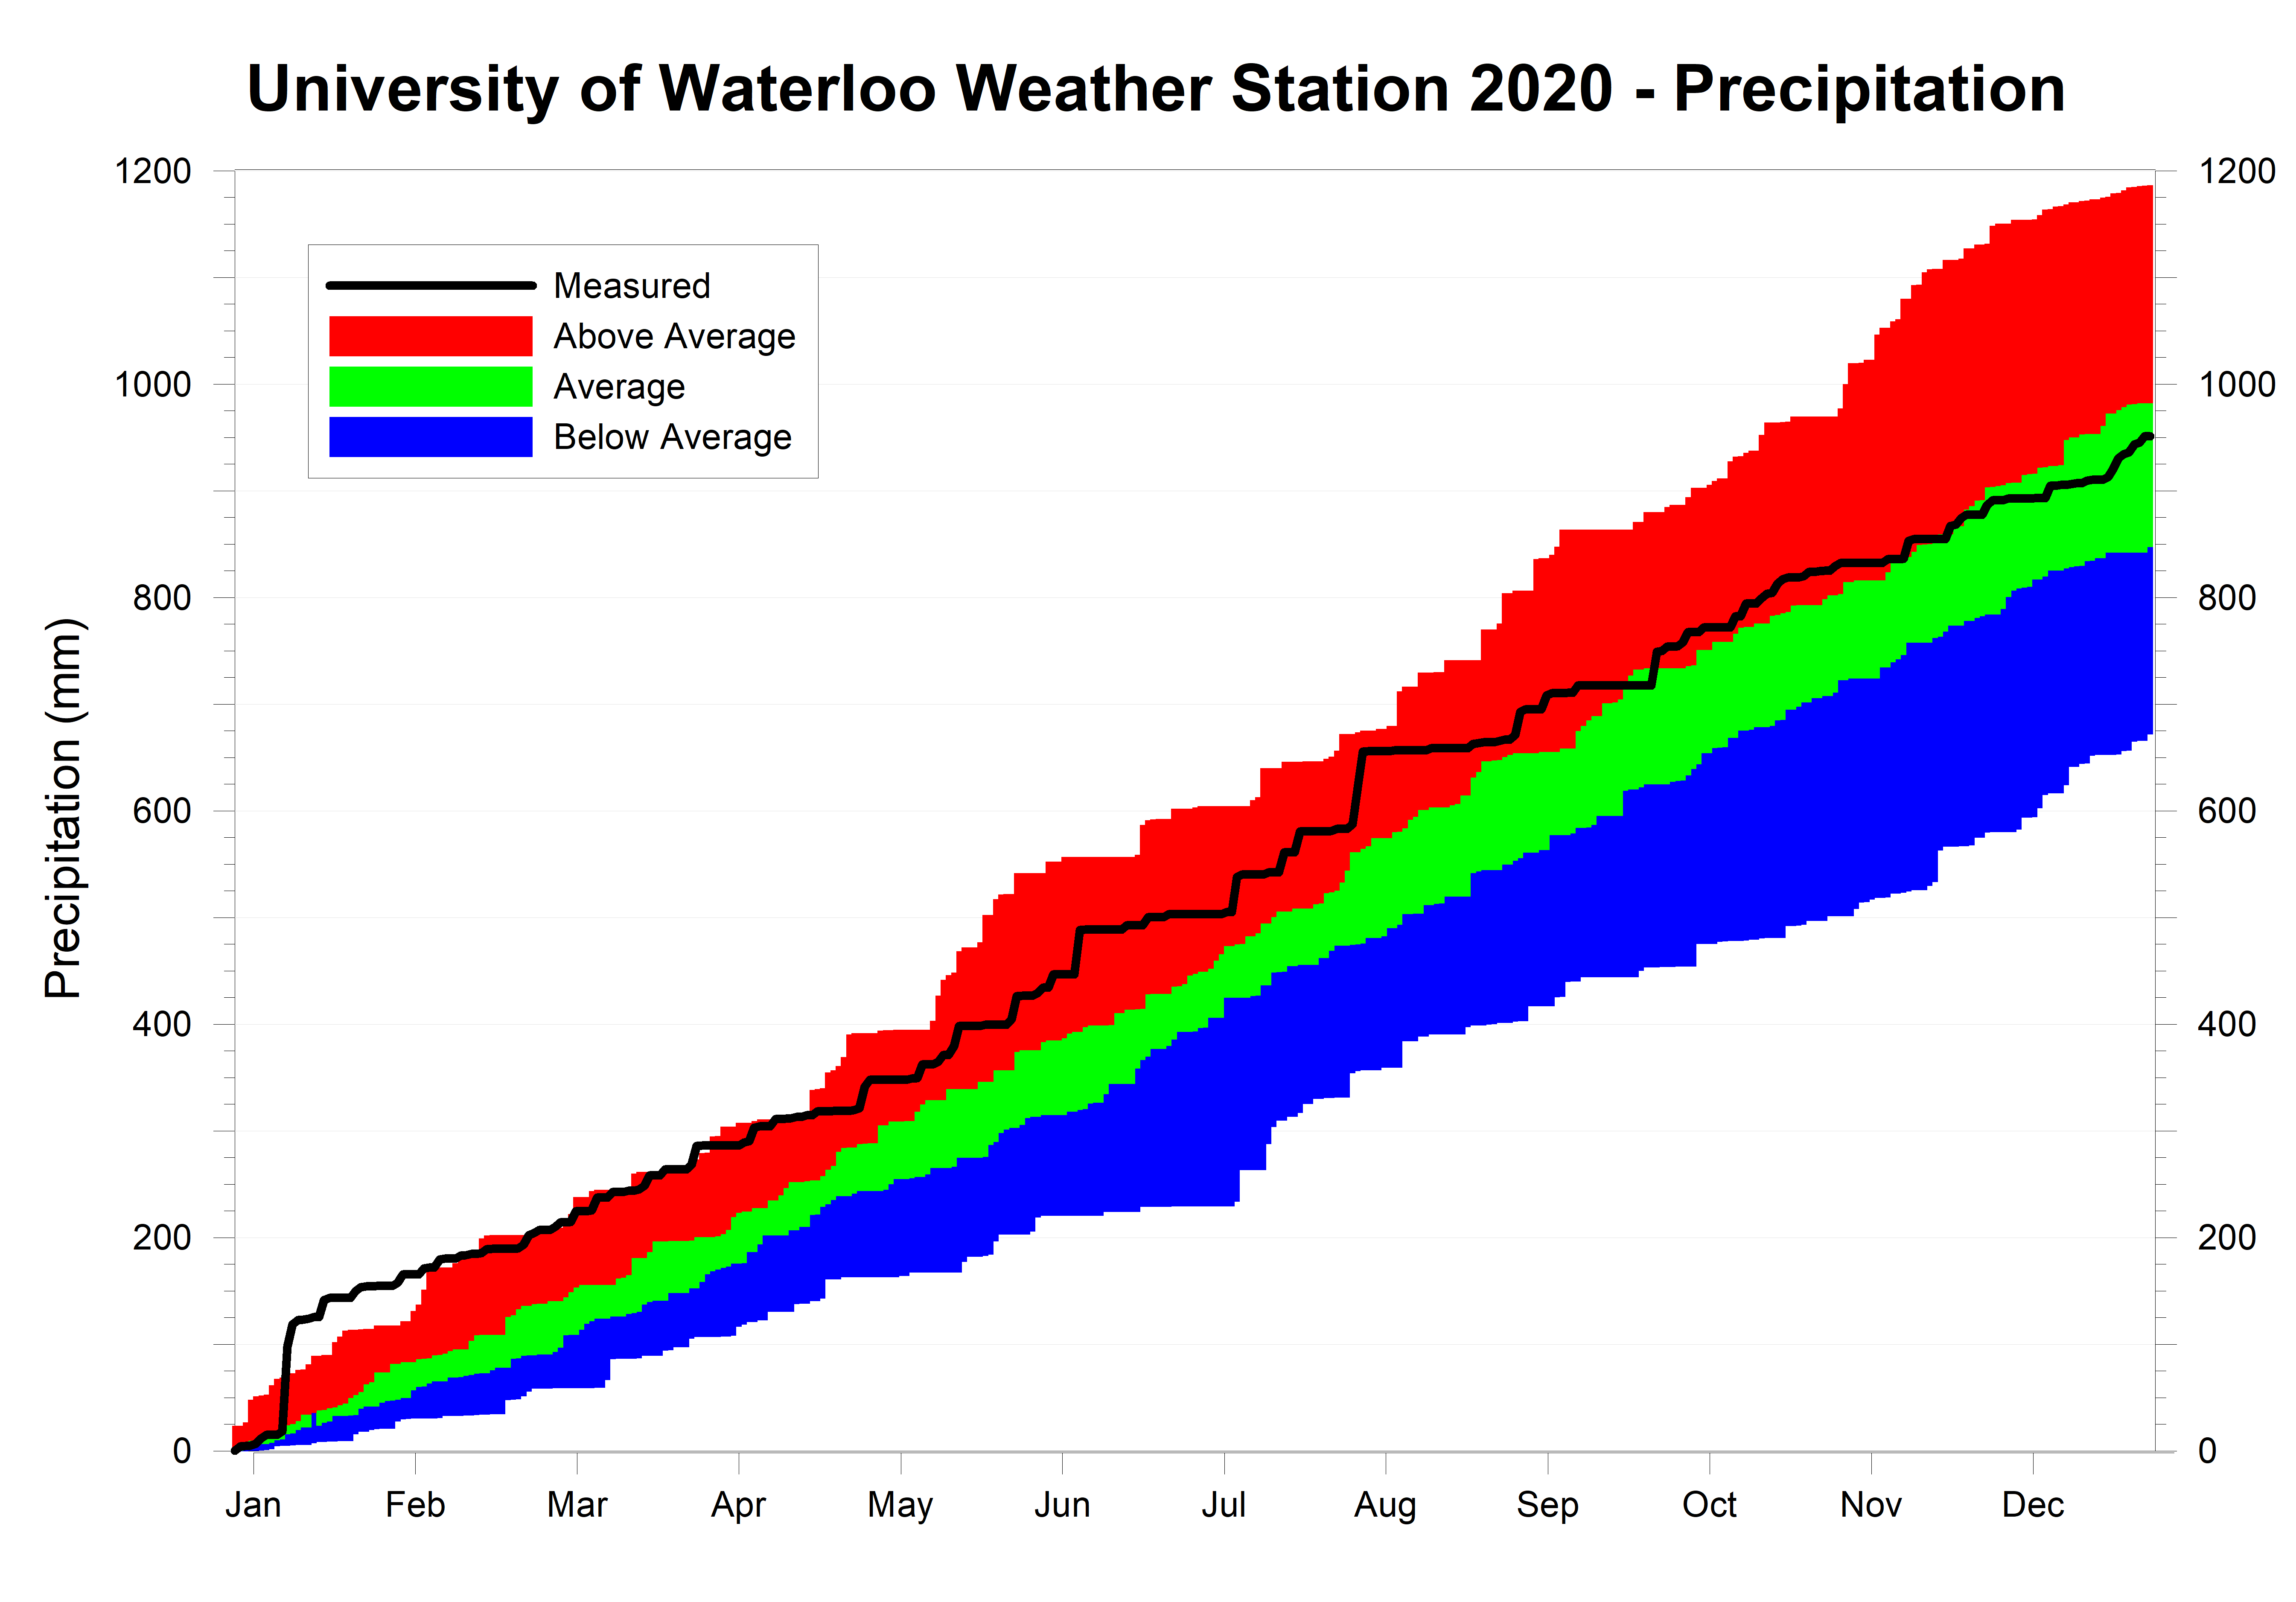
After January, the rest of the year didn’t see any other extreme high or low months for precipitation, with the rest of the year (apart from March) seeing average precipitation. Not surprisingly, the total precipitation was 950.9 mm, which is just a little over the average of 916.3 mm.
Frank Seglenieks
weather@uwaterloo.ca
University of Waterloo Weather Station Coordinator
Summary for 2020 (averages from 1981-2010 data for the Waterloo-Wellington Airport):
Average Daily High Temperature: 13.59°C (average 12.05ºC)
Average Daily Low Temperature: 3.40°C (average 1.94ºC)
Total Precipitation: 950.9 mm (average 916.3 mm)
Extremes for 2020 (all time UW weather station extreme in brackets):
Highest temperature:
34.4°C Jul 9 4:00 pm (35.7 °C July 21, 2011 3:00 pm)
Highest humidex:
43.3 Jul 10 12:30 pm (47.6 July 17, 2013 5:00 pm)
Lowest temperature:
-27.5°C Feb 14 6:30 am (-35.5 °C Feb 16, 2015 7:00 am)
Lowest windchill:
-26.2 Feb 15 2:00 am (-47.3 Feb 15, 2015 6:15 am)
Greatest temperature drop in 15 minutes:
-6.6°C Jun 5 5:15 pm (-9.5 °C July 19, 2013 5:00 pm)
Greatest temperature drop in 60 minutes:
-9.9°C Jun 05 4:45-5:45 pm (-11.8 °C July 19, 2013 4:45-5:45 pm)
Greatest temperature rise in 15 minutes:
4.0°C Feb 17 8:45 am (8.6 °C Jan 2, 2001 6:15 am)
Greatest temperature rise in 60 minutes:
6.7°C Feb 14 8:00 - 9:00 am (12.2 °C Jan 2, 2001 4:45-5:45 am)
Highest precipitation in 15 minutes:
24.8 mm Jul 10 6:45-7:00 pm (New record)
Highest precipitation in 60 minutes:
29.2 mm Jul 10 6:45-7:45 pm (36.7 mm Jun 16, 1998 3:30-4:30 pm)
Highest Precipitation in 1 day:
79.6 mm Aug 18 (New record)
Highest 15 minute average wind speed:
20.8 km/h Nov 15 3:45 pm (44.6 km/h Mar 9, 2002 6:30 pm)
Highest wind gust (only available since 2015):
36.7 km/h Nov 15 4:30 pm (44.4 km/h Apr 13, 2015 2:30 pm)
Last time the temperature went below 0 before the summer:
May 13 6:45 am (Has ranged between Apr 26- May 23)
First time the temperature went below 0 after the summer:
Sep 19 3:00 am (Has ranged between Oct 2-29, earliest date on record)
Length of frost-free season:
129 Days (Has ranged between 146-175 days, smallest on record)
Highest daily low temperature:
21.1°C Jul 27 (25.3 °C Aug 1, 2006)
Lowest daily high temperature:
-7.6°C Jan 30 (-20.6 °C Feb 15, 2015)
Largest daily temperature range:
21.0°C Mar 1 (29.6 °C Feb 19, 2007)
Smallest daily temperature range:
0.80°C Feb 11 (0.45 °C Dec 7, 2005)
(averages are calculated from 1981-2010 data for the Waterloo-Wellington Airport)
Click on the image below to see the temperature chart:
Click on the image below to see the precipitation chart:




 Posts
Posts

