University of Waterloo Weather Station Annual Summary - 2019
First half of 2019: cold and wet
Second half of 2019: (mostly) warm and (mostly) dry
Overall for 2019: average temperature and precipitation
As you can see above, there were really two parts to the weather story for 2019 in the Waterloo Region. The first half of the year didn’t have any above average months for temperature or below average months for precipitation. In the second half of the year, 5 of the 6 months were above average for temperature and only 1 month that was wetter than average. When you put that all together, you come up with a year that was very average.
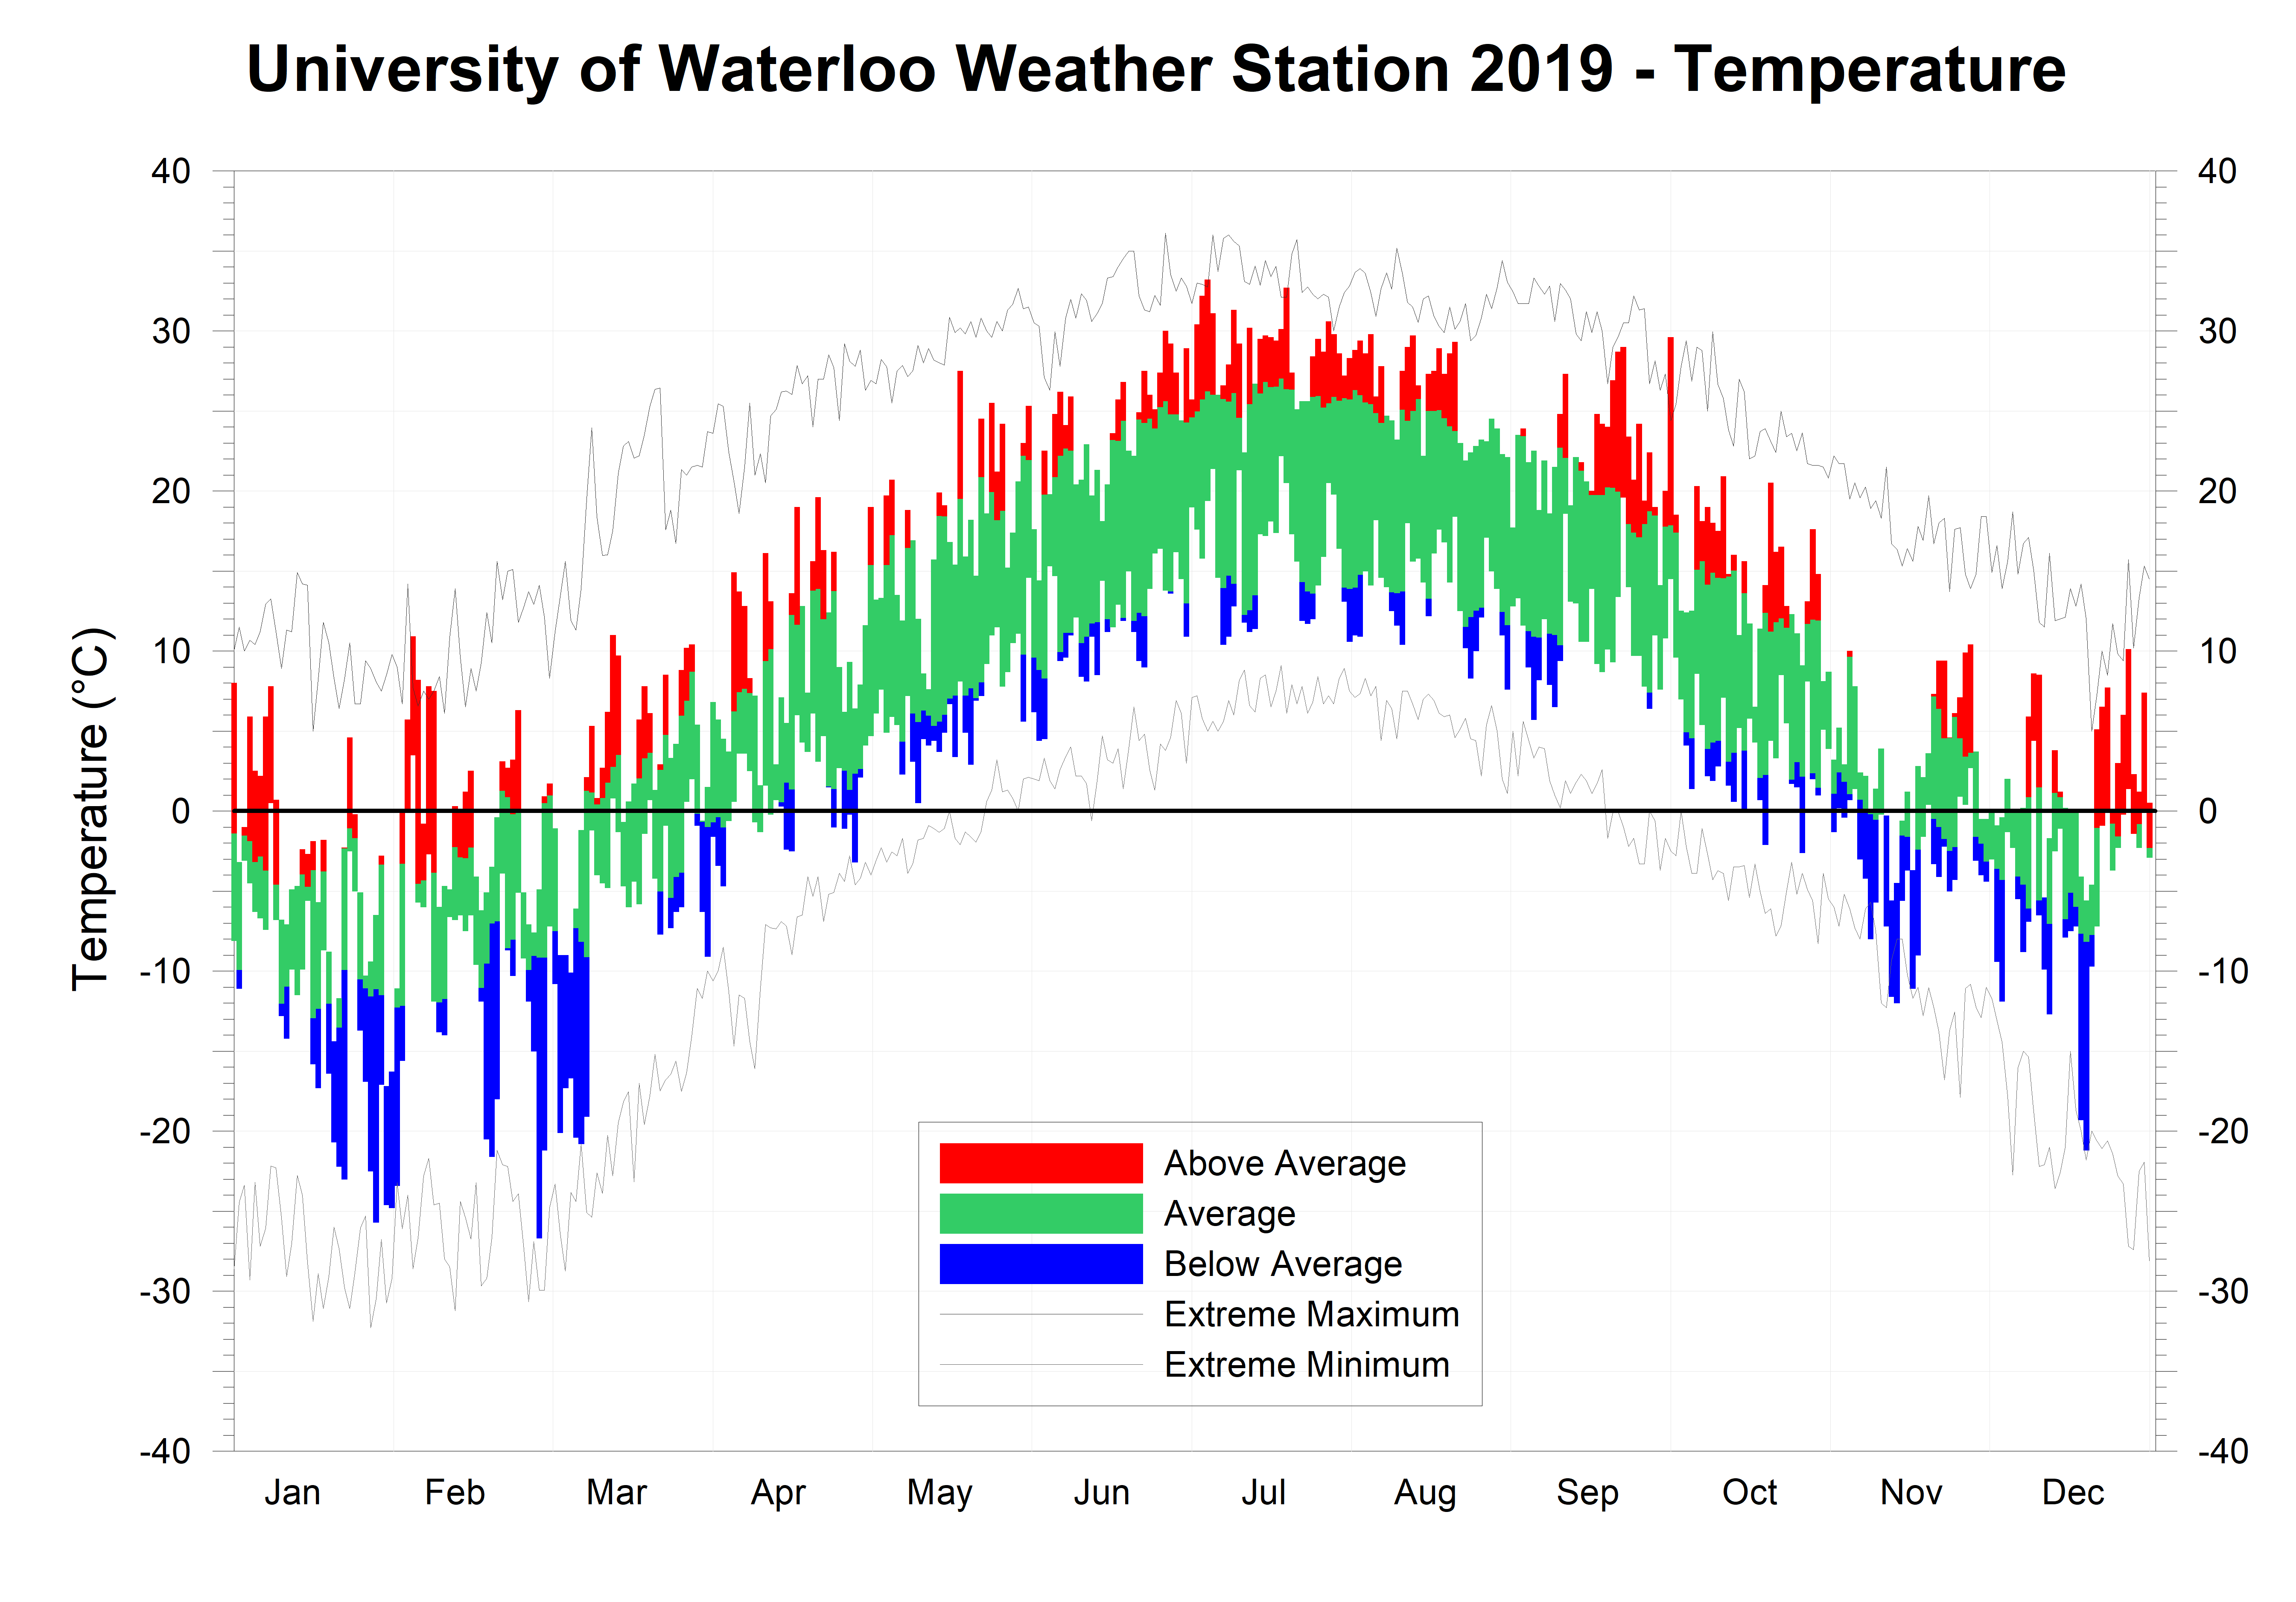
At 1.5 degrees below average, January started off the year cold including the 30th when it only got up to -17.2°C, this was the lowest daily high temperature since Feb 19, 2015. February and early March saw a lot of variation in the temperature with some warmer spells and cold patches. It wasn’t until about mid-March before we experienced a few weeks of generally average temperatures.
Then we had what has been typical in the last few years, with colder than average Spring temperatures, particularly in April. Although it was never really extremely cold during this time, there were a lot of days enough below average to result in a colder than average April and May.
June was the first month of year that was at least a little bit higher than average (even if it was just by 0.04 degrees). This started off the warm summer, which peaked in July when it was over 2 degrees higher than average, making the hottest month since July of 2012, also that month had 9 days over 30°C which is well above the average of only 3.5 days.
Continuing the pattern we have seen for the last 20 years, September was warmer than average, even though it was the least warm September in the previous 6 years, it was still 2 degrees above average. October started off with a daily high temperature near 30°C, which was only the third time there has been a day of at least 30°C during the month of October in the over 100 years of weather data in the region. Overall October was 1.2 degrees above average.
November was definitely the anomaly for the second half of the year, coming in at 2.5 degrees colder than average, enough to make it the coldest in the past 25 years, while the high temperature of 10.4°C on the 27th was the lowest daily high temperature for November on record. It then turned around in December with a generally warm month that was 1.5 degrees above average.
So when you combine the colder first half of the year with the warmer second half, it not surprising that the result is an overall temperature just 0.1 degrees above the average, which is the least warm overall temperature since 2014.
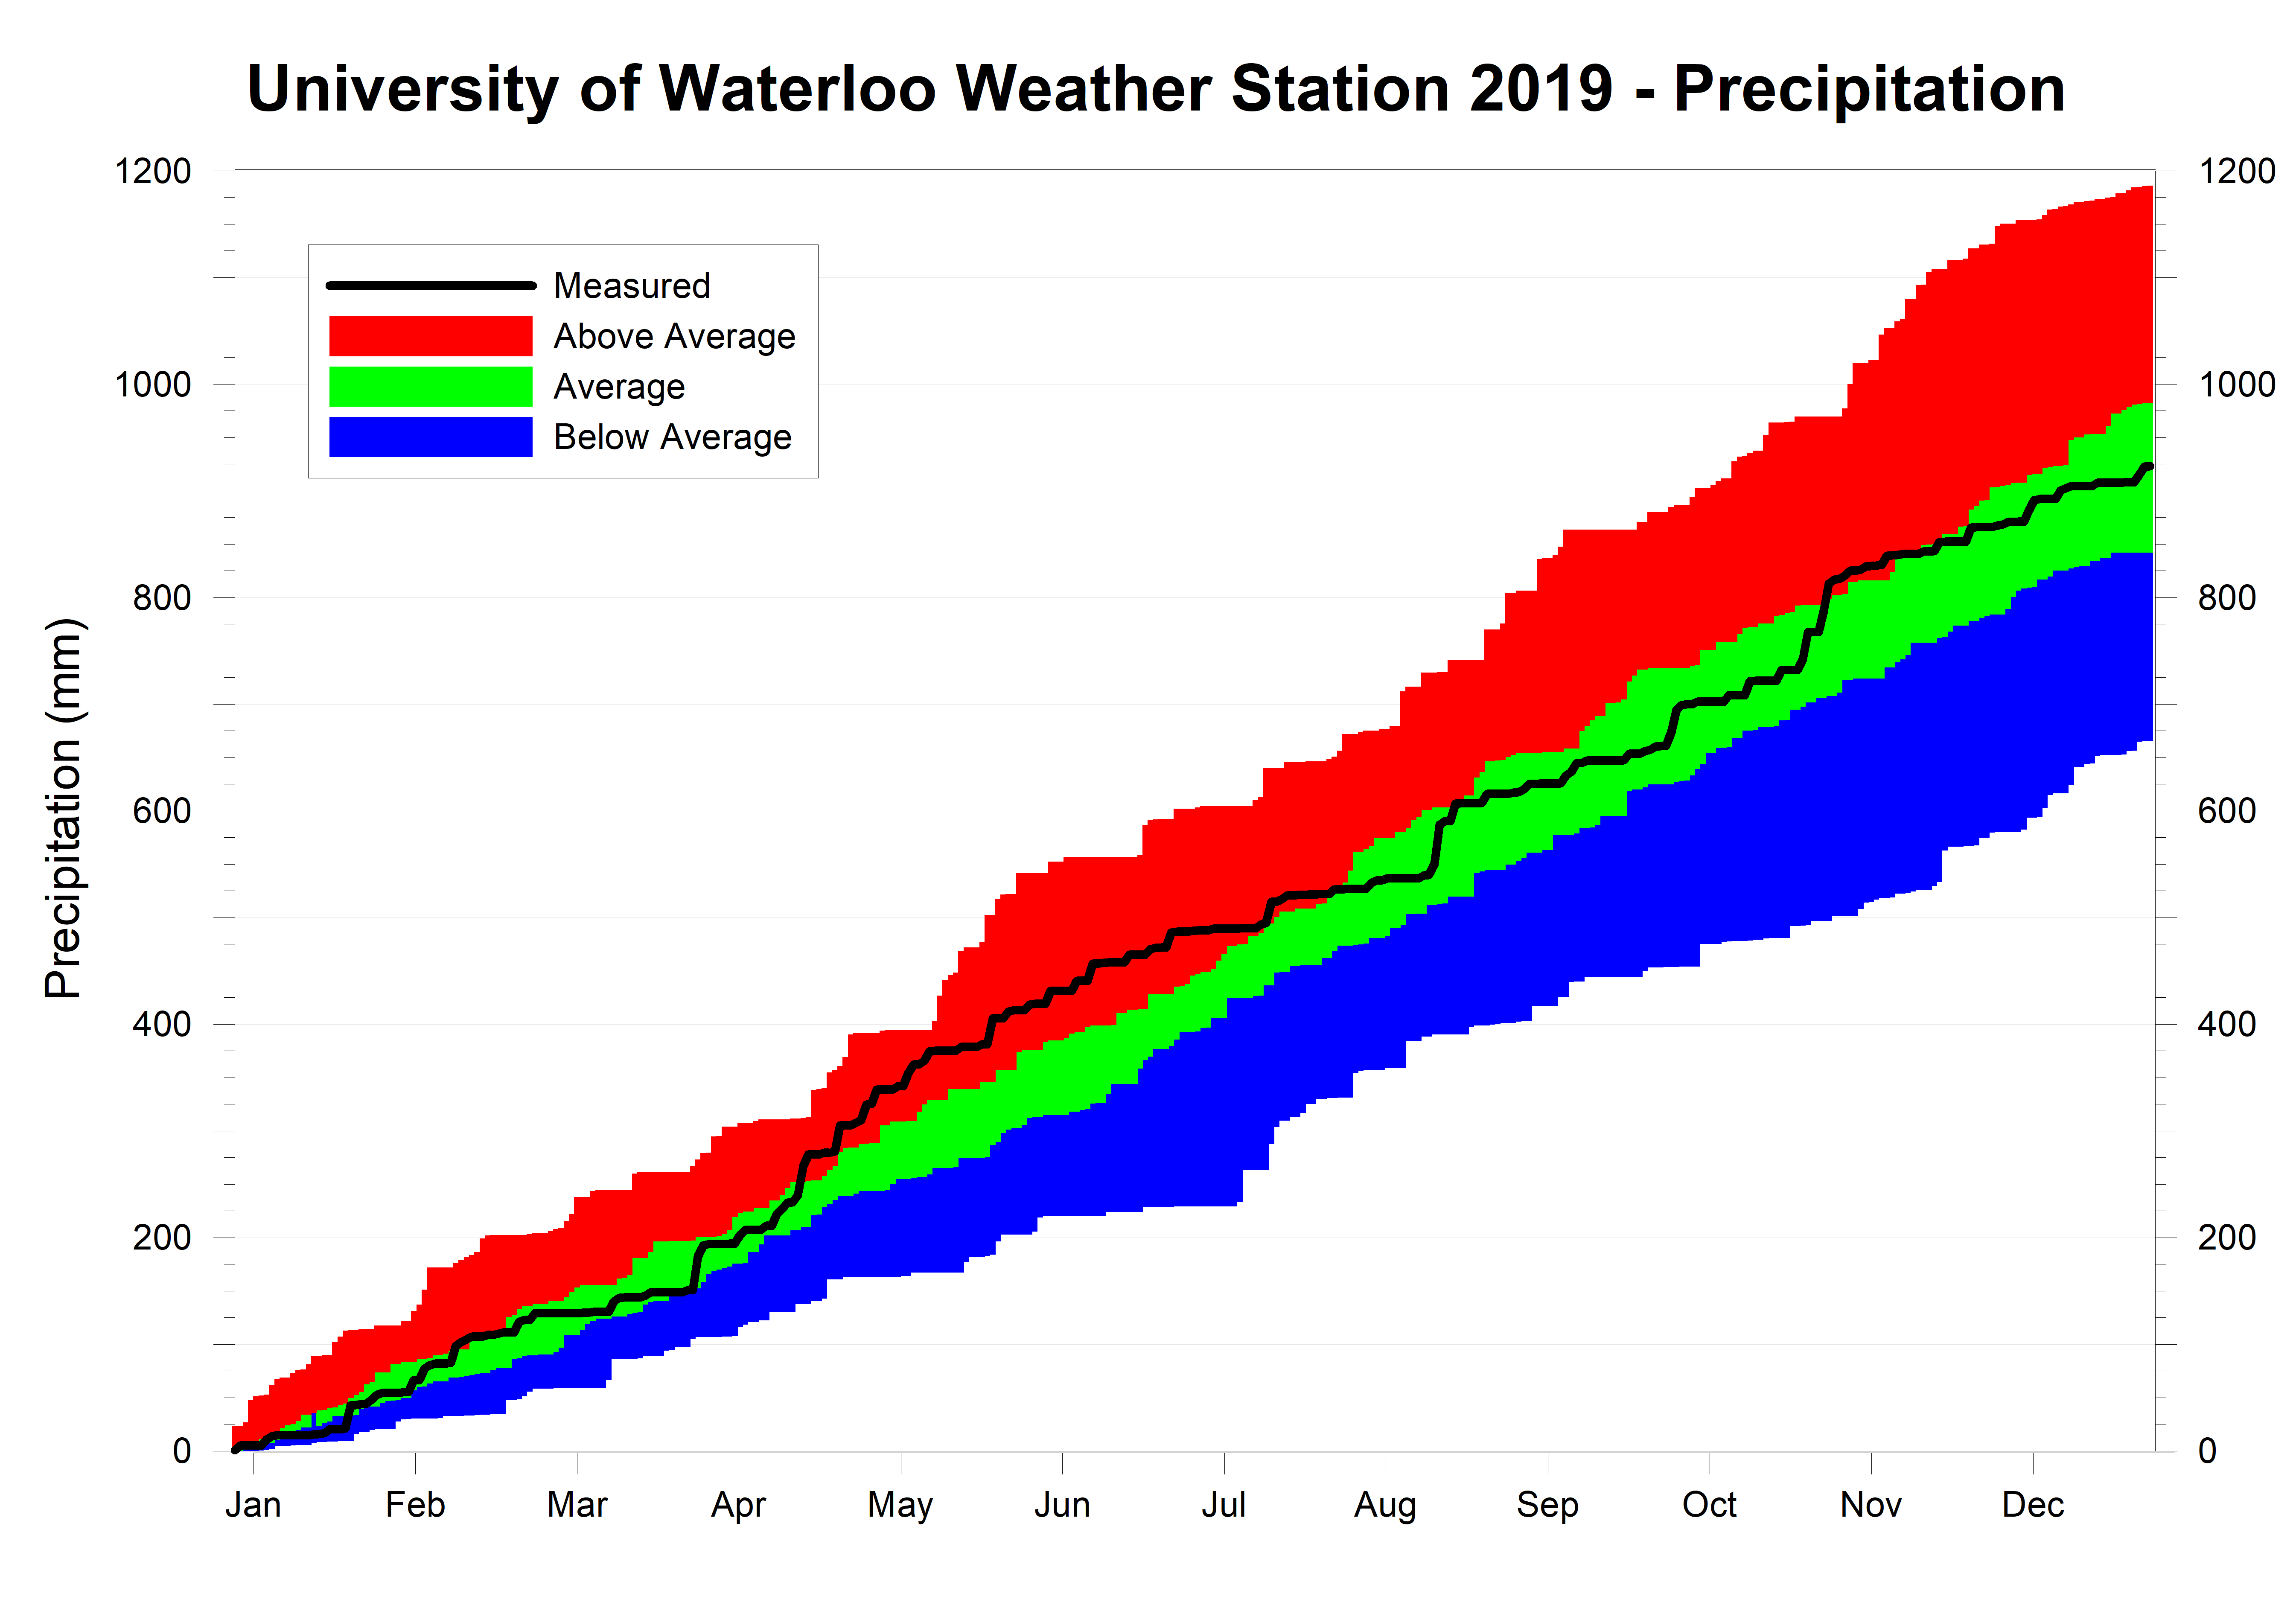
As for precipitation, it was above average from February to May, but then it got a little bit drier, with July the driest month of the year with only 39.8 mm. Although the wettest month was October (152.4 mm) it was an outlier in an otherwise drier than average second half of the year.
The final total precipitation for 2019 of 923.0 mm was only a little over the average of 916.3 mm and well within the average range. Fun fact, this was the closest final total to the average in the 20 year history of the UW weather station.
Frank Seglenieks
weather@uwaterloo.ca
University of Waterloo Weather Station Coordinator
Summary for 2019 (averages from 1981-2010 data for the Waterloo-Wellington Airport):
Average Daily High Temperature: 12.28°C (average 12.05ºC)
Average Daily Low Temperature: 1.95°C (average 1.94ºC)
Total Precipitation: 923.0 mm (average 916.3 mm)
Extremes for 2019 (all time UW weather station extreme in brackets):
Highest temperature:
33.2°C Jul 5 4:00 pm (35.7 °C July 21, 2011 3:00 pm)
Highest humidex:
43.4 Jul 5 4:15 pm (47.6 July 17, 2013 5:00 pm)
Lowest temperature:
-26.7°C Feb 28 6:45 am (-35.5 °C Feb 16, 2015 7:00 am)
Lowest windchill:
-39.1 Jan 31 7:45 am (-47.3 Feb 15, 2015 6:15 am)
Greatest temperature drop in 15 minutes:
-5.2°C Jun 28 12:00 pm (-9.5 °C July 19, 2013 5:00 pm)
Greatest temperature drop in 60 minutes:
-8.6°C Jun 28 12:00-1:00 pm (-11.8 °C July 19, 2013 4:45-5:45 pm)
Greatest temperature rise in 15 minutes:
3.8°C Jan 1 8:00 am (8.6 °C Jan 2, 2001 6:15 am)
Greatest temperature rise in 60 minutes:
8.0°C Feb 28 8:00 - 9:00 am (12.2 °C Jan 2, 2001 4:45-5:45 am)
Highest precipitation in 15 minutes:
12.8 mm Aug 18 4:45-5:00 pm (23.0 mm Jul 22, 2008 1:45-2:00 pm)
Highest precipitation in 60 minutes:
14.8 mm Aug 18 4:30-5:30 pm (36.7 mm Jun 16, 1998 3:30-4:30 pm)
Highest Precipitation in 1 day:
36.6 mm Aug 18 (78.0 mm July 11, 2008)
Highest 15 minute average wind speed:
22.5 km/h Feb 24 12:15 pm (44.6 km/h Mar 9, 2002 6:30 pm)
Highest wind gust (only available since 2015):
36.9 km/h Feb 24 12:15 pm (44.4 km/h Apr 13, 2015 2:30 pm)
Last time the temperature went below 0 before the summer:
Apr 29 6:30 am (Has ranged between Apr 26- May 23)
First time the temperature went below 0 after the summer:
Oct 19 12:45 am (Has ranged between Oct 2-29)
Length of frost-free season
173 Days (Has ranged between 146-175 days)
Highest daily low temperature:
22.2°C Jul 19 (25.3 °C Aug 1, 2006)
Lowest daily high temperature:
-17.2°C Jan 30 (-20.6 °C Feb 15, 2015)
Largest daily temperature range:
22.1°C Mar 1 (29.6 °C Feb 19, 2007)
Smallest daily temperature range:
1.7°C Feb 11 (0.45 °C Dec 7, 2005)
First half of 2019: cold and wet
Second half of 2019: (mostly) warm and (mostly) dry
Overall for 2019: average temperature and precipitation
As you can see above, there were really two parts to the weather story for 2019 in the Waterloo Region. The first half of the year didn’t have any above average months for temperature or below average months for precipitation. In the second half of the year, 5 of the 6 months were above average for temperature and only 1 month that was wetter than average. When you put that all together, you come up with a year that was very average.
At 1.5 degrees below average, January started off the year cold including the 30th when it only got up to -17.2°C, this was the lowest daily high temperature since Feb 19, 2015. February and early March saw a lot of variation in the temperature with some warmer spells and cold patches. It wasn’t until about mid-March before we experienced a few weeks of generally average temperatures.
Then we had what has been typical in the last few years, with colder than average Spring temperatures, particularly in April. Although it was never really extremely cold during this time, there were a lot of days enough below average to result in a colder than average April and May.
June was the first month of year that was at least a little bit higher than average (even if it was just by 0.04 degrees). This started off the warm summer, which peaked in July when it was over 2 degrees higher than average, making the hottest month since July of 2012, also that month had 9 days over 30°C which is well above the average of only 3.5 days.
Continuing the pattern we have seen for the last 20 years, September was warmer than average, even though it was the least warm September in the previous 6 years, it was still 2 degrees above average. October started off with a daily high temperature near 30°C, which was only the third time there has been a day of at least 30°C during the month of October in the over 100 years of weather data in the region. Overall October was 1.2 degrees above average.
November was definitely the anomaly for the second half of the year, coming in at 2.5 degrees colder than average, enough to make it the coldest in the past 25 years, while the high temperature of 10.4°C on the 27th was the lowest daily high temperature for November on record. It then turned around in December with a generally warm month that was 1.5 degrees above average.
So when you combine the colder first half of the year with the warmer second half, it not surprising that the result is an overall temperature just 0.1 degrees above the average, which is the least warm overall temperature since 2014.
As for precipitation, it was above average from February to May, but then it got a little bit drier, with July the driest month of the year with only 39.8 mm. Although the wettest month was October (152.4 mm) it was an outlier in an otherwise drier than average second half of the year.
The final total precipitation for 2019 of 923.0 mm was only a little over the average of 916.3 mm and well within the average range. Fun fact, this was the closest final total to the average in the 20 year history of the UW weather station.
Frank Seglenieks
weather@uwaterloo.ca
University of Waterloo Weather Station Coordinator
Summary for 2019 (averages from 1981-2010 data for the Waterloo-Wellington Airport):
Average Daily High Temperature: 12.28°C (average 12.05ºC)
Average Daily Low Temperature: 1.95°C (average 1.94ºC)
Total Precipitation: 923.0 mm (average 916.3 mm)
Extremes for 2019 (all time UW weather station extreme in brackets):
Highest temperature:
33.2°C Jul 5 4:00 pm (35.7 °C July 21, 2011 3:00 pm)
Highest humidex:
43.4 Jul 5 4:15 pm (47.6 July 17, 2013 5:00 pm)
Lowest temperature:
-26.7°C Feb 28 6:45 am (-35.5 °C Feb 16, 2015 7:00 am)
Lowest windchill:
-39.1 Jan 31 7:45 am (-47.3 Feb 15, 2015 6:15 am)
Greatest temperature drop in 15 minutes:
-5.2°C Jun 28 12:00 pm (-9.5 °C July 19, 2013 5:00 pm)
Greatest temperature drop in 60 minutes:
-8.6°C Jun 28 12:00-1:00 pm (-11.8 °C July 19, 2013 4:45-5:45 pm)
Greatest temperature rise in 15 minutes:
3.8°C Jan 1 8:00 am (8.6 °C Jan 2, 2001 6:15 am)
Greatest temperature rise in 60 minutes:
8.0°C Feb 28 8:00 - 9:00 am (12.2 °C Jan 2, 2001 4:45-5:45 am)
Highest precipitation in 15 minutes:
12.8 mm Aug 18 4:45-5:00 pm (23.0 mm Jul 22, 2008 1:45-2:00 pm)
Highest precipitation in 60 minutes:
14.8 mm Aug 18 4:30-5:30 pm (36.7 mm Jun 16, 1998 3:30-4:30 pm)
Highest Precipitation in 1 day:
36.6 mm Aug 18 (78.0 mm July 11, 2008)
Highest 15 minute average wind speed:
22.5 km/h Feb 24 12:15 pm (44.6 km/h Mar 9, 2002 6:30 pm)
Highest wind gust (only available since 2015):
36.9 km/h Feb 24 12:15 pm (44.4 km/h Apr 13, 2015 2:30 pm)
Last time the temperature went below 0 before the summer:
Apr 29 6:30 am (Has ranged between Apr 26- May 23)
First time the temperature went below 0 after the summer:
Oct 19 12:45 am (Has ranged between Oct 2-29)
Length of frost-free season
173 Days (Has ranged between 146-175 days)
Highest daily low temperature:
22.2°C Jul 19 (25.3 °C Aug 1, 2006)
Lowest daily high temperature:
-17.2°C Jan 30 (-20.6 °C Feb 15, 2015)
Largest daily temperature range:
22.1°C Mar 1 (29.6 °C Feb 19, 2007)
Smallest daily temperature range:
1.7°C Feb 11 (0.45 °C Dec 7, 2005)
(averages are calculated from 1981-2010 data for the Waterloo-Wellington Airport)
Click on the image below to see the temperature chart:
Click on the image below to see the precipitation chart:


No comments:
Post a Comment