Sunday, November 22, 2015

El Nino effect in our region

You have probably heard a lot of talk lately about the very strong El Nino which is current occurring in the Pacific Ocean.  If you are interested in the El Nino Southern Oscillation (or ENSO as it is called), this is a great resource for information:

https://www.climate.gov/news-features/department/8443/all

However, it is always important to keep in mind exactly just how much effect El Ninos generally have in our region.  Generally, the further away from the Pacific, the less direct effect El Nino will have on an area.  Thus you can imagine that around Waterloo it isn't exactly a slam dunk that an El Nino will always be the dominant factor in what we see.  For example, a less predictable and more variable factor called the Arctic Oscillation (AO) will usually have a great effect on what we see during a typical winter.  See the recent variations in the AO here:

http://www.cpc.noaa.gov/products/precip/CWlink/daily_ao_index/ao.shtml

So the real question is just how much of a difference does El Nino make for us?

To answer this question I did a quick plot of the average temperature, total precipitation and total snowfall for each winter between 1950 and 2010 in our region.  The winters with the seven strongest El Ninos are shown as red dots in the plot below (don't worry about the units of the plots, it is really just the patterns that are important here, the dark line at zero would be the average 1981-2010 value):


From the plot you can get an idea of the general variability of the different factors as well as how they are affected by El Nino.  Looking at the temperature, strong El Ninos are not uniformly all well above average, but it could be said they are all average to above average.  Thus you get the idea that El Nino will encourage warmer winters, but even the strong ones don't guarantee it.

Interestingly, for total precipitation it seems that El Ninos tend to not have either very wet or very dry overall winters (keep in mind total precipitation consists of both rainfall and snowfall).  Most of the strong El Ninos have resulted in very average overall wetness.

The strongest El Nino effect appears to be in the total snowfall as all the red dots are either a little or a lot below the average line and none are above. 

I have never been one who likes to make seasonal weather predictions (you can see why here: http://uwweatherstation.blogspot.ca/2014/12/what-is-winter-going-to-be-like-you.html ) and of course there are no guarantees when it comes to the weather.  However, based on the pattern from past strong El Ninos, it would seem that there is a "good chance" that we will see less total snowfall this winter, above average temperatures, and about average total precipitation. But as always, mother nature will have the final say.

Frank Seglenieks
University of Waterloo Weather Station Coordinator

PS For full disclosure I have to say that I totally stole the idea for the graph from NOAA's ENSO blog, they created a similar graph for different regions of the US, I just adopted it for our region.

Sunday, November 1, 2015

October 2015 Summary

A very wet and warm October

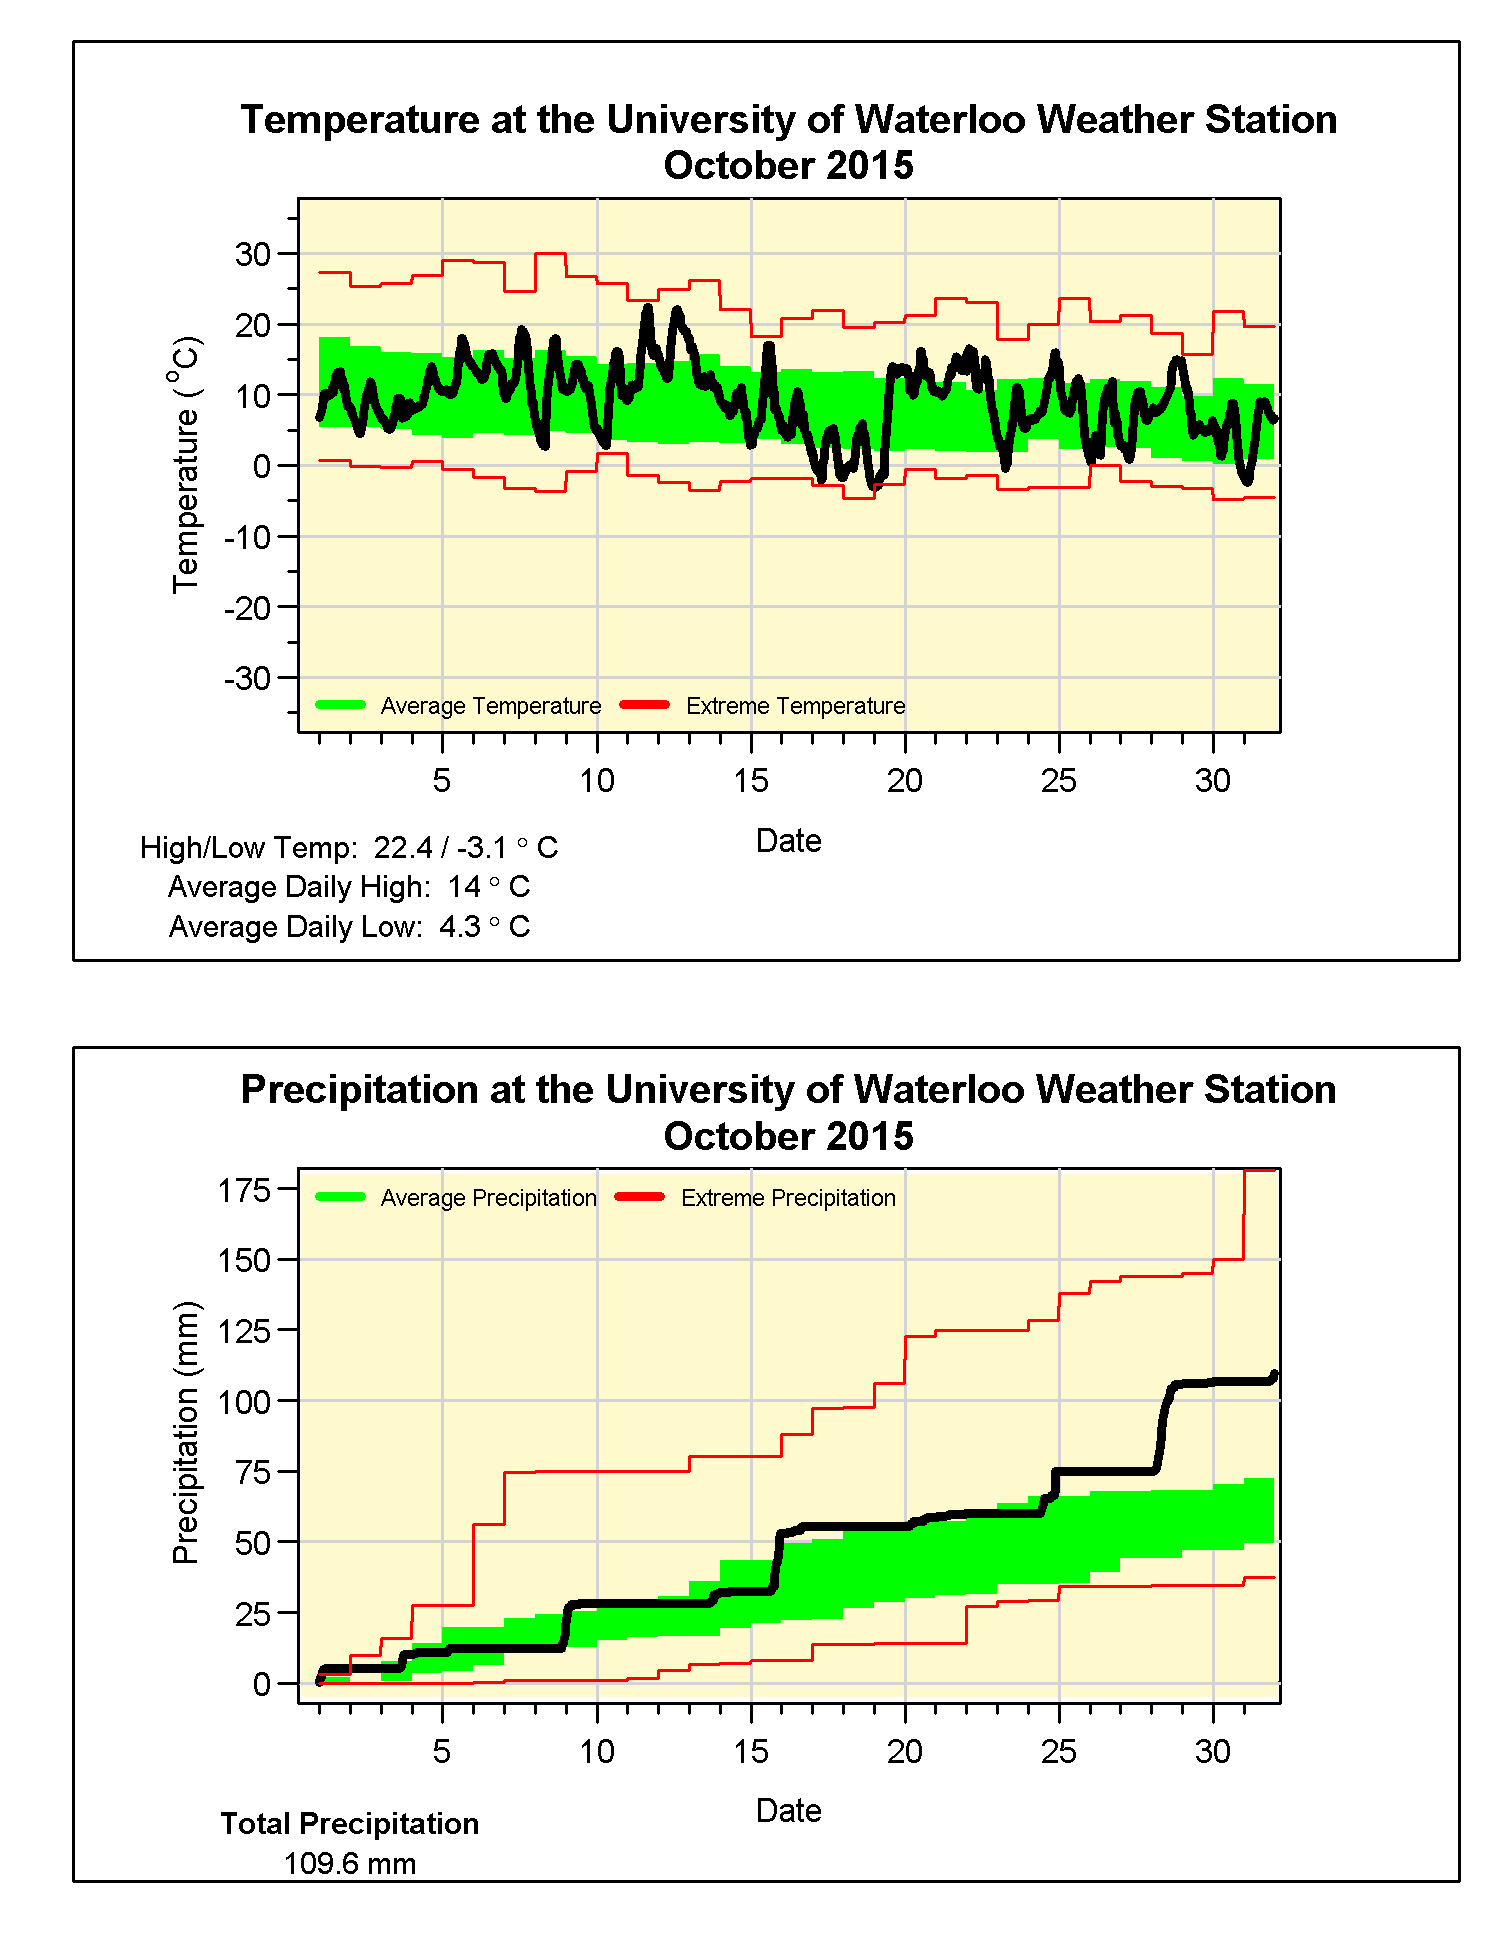
Although it never really got that hot, there were only a couple of days over 20 C, the overall temperature for the month was almost a degree above average. But incredibly this makes it the coldest October in the last 6 years as in those years it has consistently been more than a degree above average. On the graph you can also see when the temperature went up over 15 degrees in just under 6 hours on the 19th.

We saw a lot of precipitation late in the month with 30.8 mm on the 28th, however it still would have been an above average month even if that had not have happened. The total of 109.6 mm was well above the average of 67.4 mm.

A wetter month puts the total so far this year of 679.8 mm a little closer to the average for the end of October of 750.6 mm.

Summary for October 2015:
Maximum Temperature 22.4°C
Minimum Temperature -3.1°C
Average Daily High Temperature 14.0°C (Long term average 13.2°C)
Average Daily Low Temperature 4.3°C (Long term average 2.9°C)
Total Precipitation 109.6 mm (Long term average 67.4 mm)
(Long term averages based on 1981-2010 data for the Waterloo Wellington Airport)


Monday, October 5, 2015

September 2015 Summary

The second hottest September we have seen in 100 years

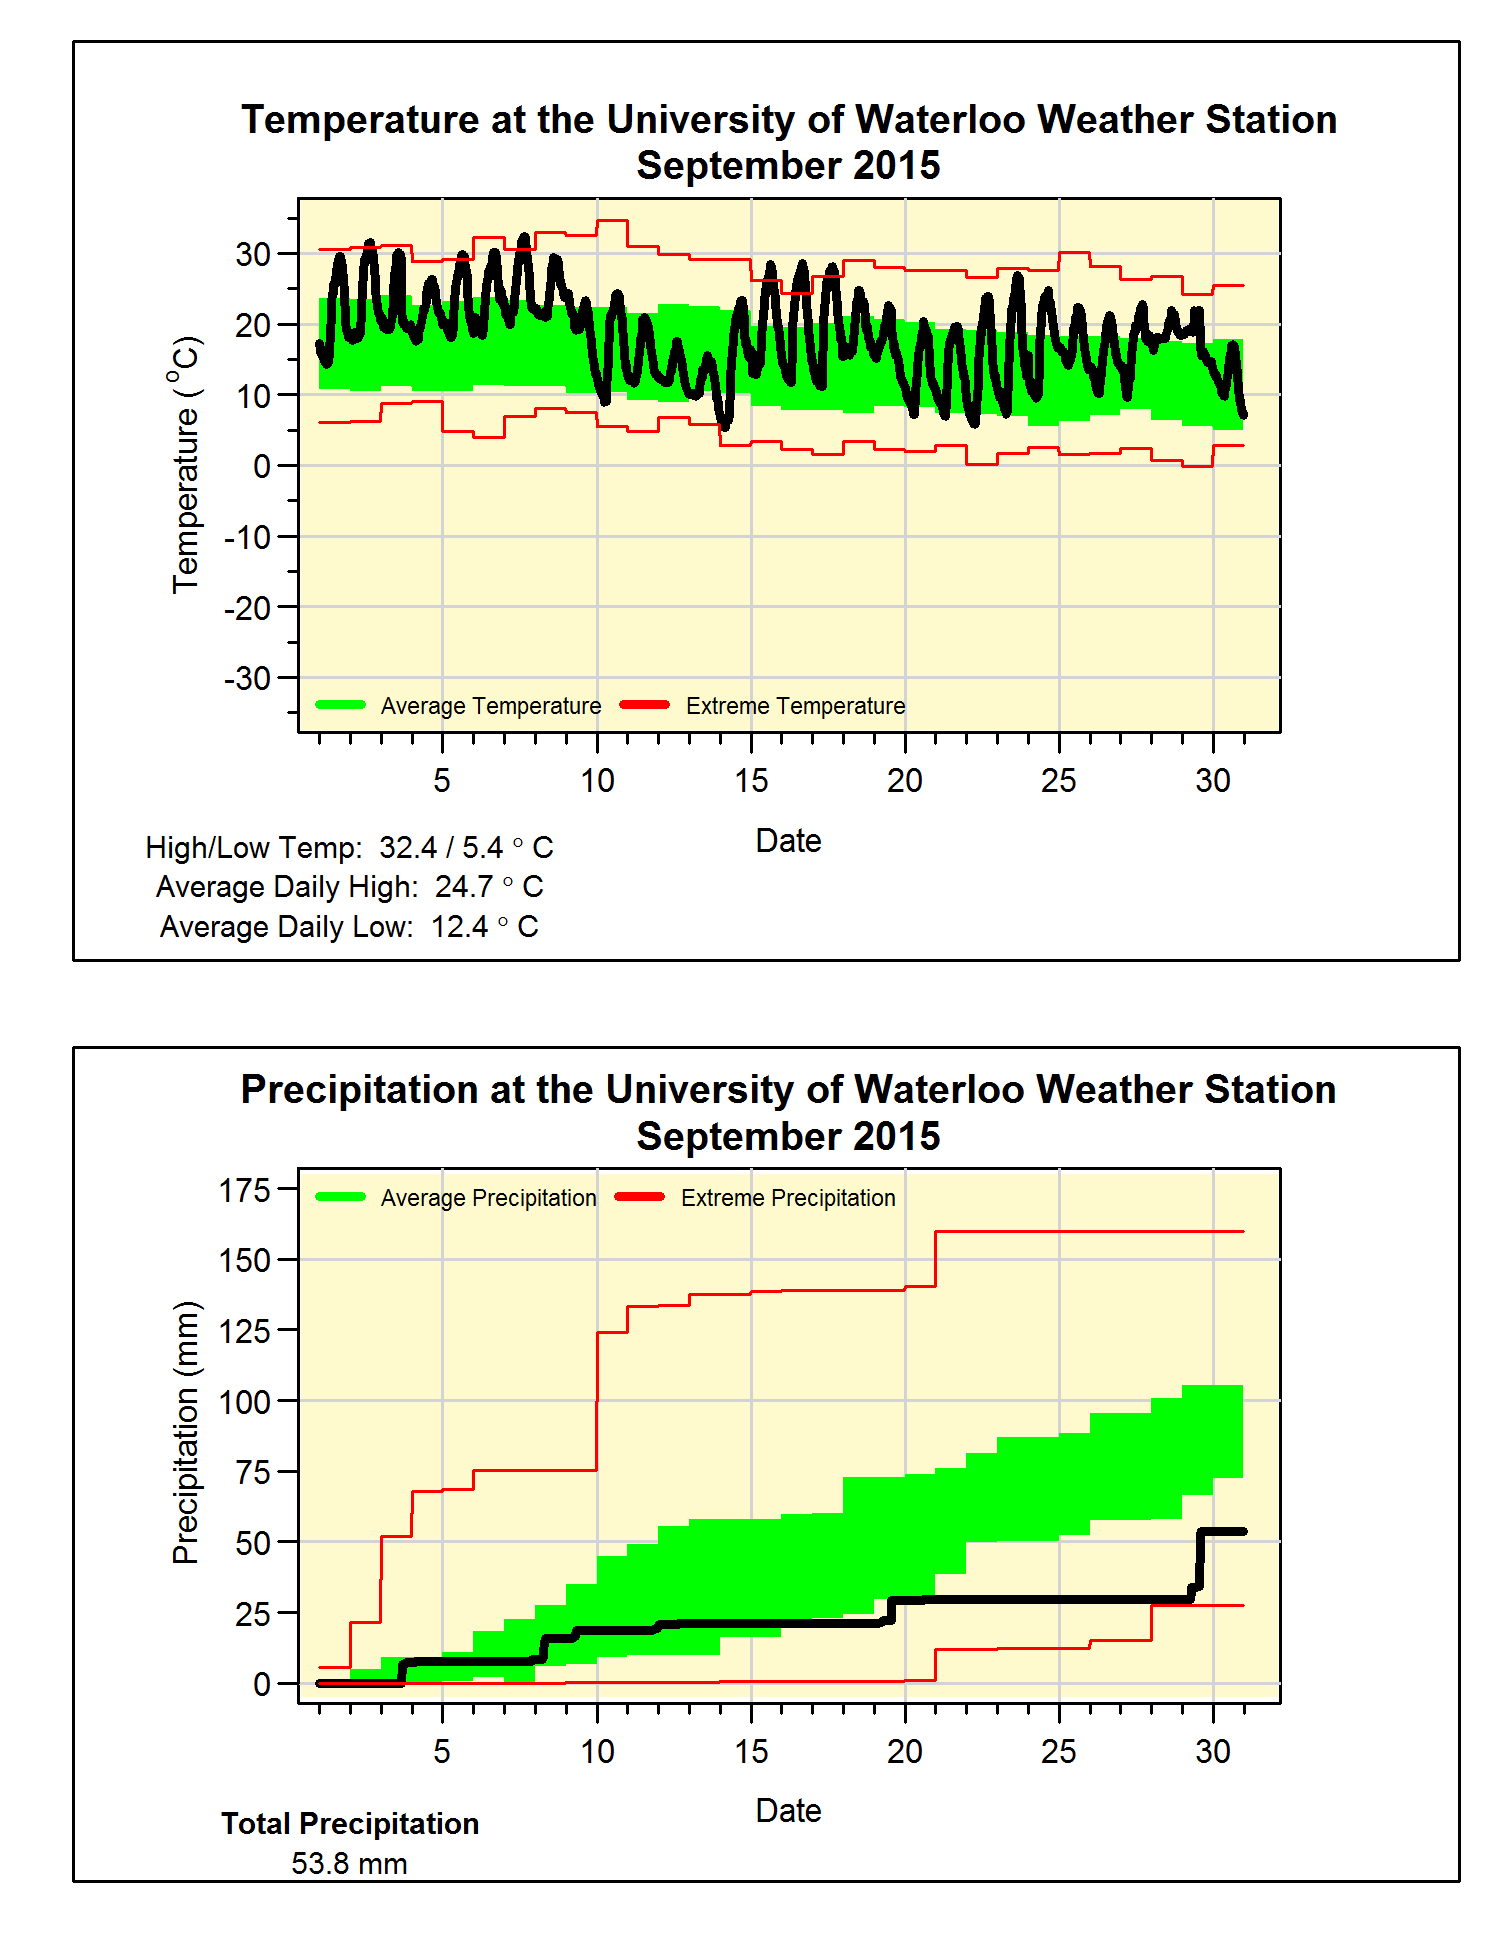
With only 3 colder than average days and the very warm start to the month, it isn’t surprising that this was the second hottest September we have seen in the 100 years of measurements in the region (only 1961 was warmer).  Overall it was 4 degrees above the average which is the most above average month since that crazy March of 2012.

What really set the month apart was the summer-like weather at the beginning with a string of temperatures near 30, this resulted in the average daily high temperature for September only a fraction of a degree below those of August.

We saw some, but not a lot of precipitation in September, in fact it would have been amongst the lowest if not for 24 mm on the 29th.  The total of only 53.8 mm was well below the average of 87.8 mm and puts the total for the year (570.2 mm) a little further away from what we would expect at this time of year (683.5 mm).


Summary for September 2015:
Maximum Temperature 32.4°C
Minimum Temperature 5.4°C
Average Daily High Temperature 24.7°C (Long term average 20.4°C)
Average Daily Low Temperature 12.4°C (Long term average 8.6°C)
Total Precipitation 53.8 mm (Long term average 87.8 mm)


(Long term averages based on 1981-2010 data for the Waterloo Wellington Airport)


Wednesday, September 2, 2015

August 2015 Summary

An average August for both temperature and precipitation

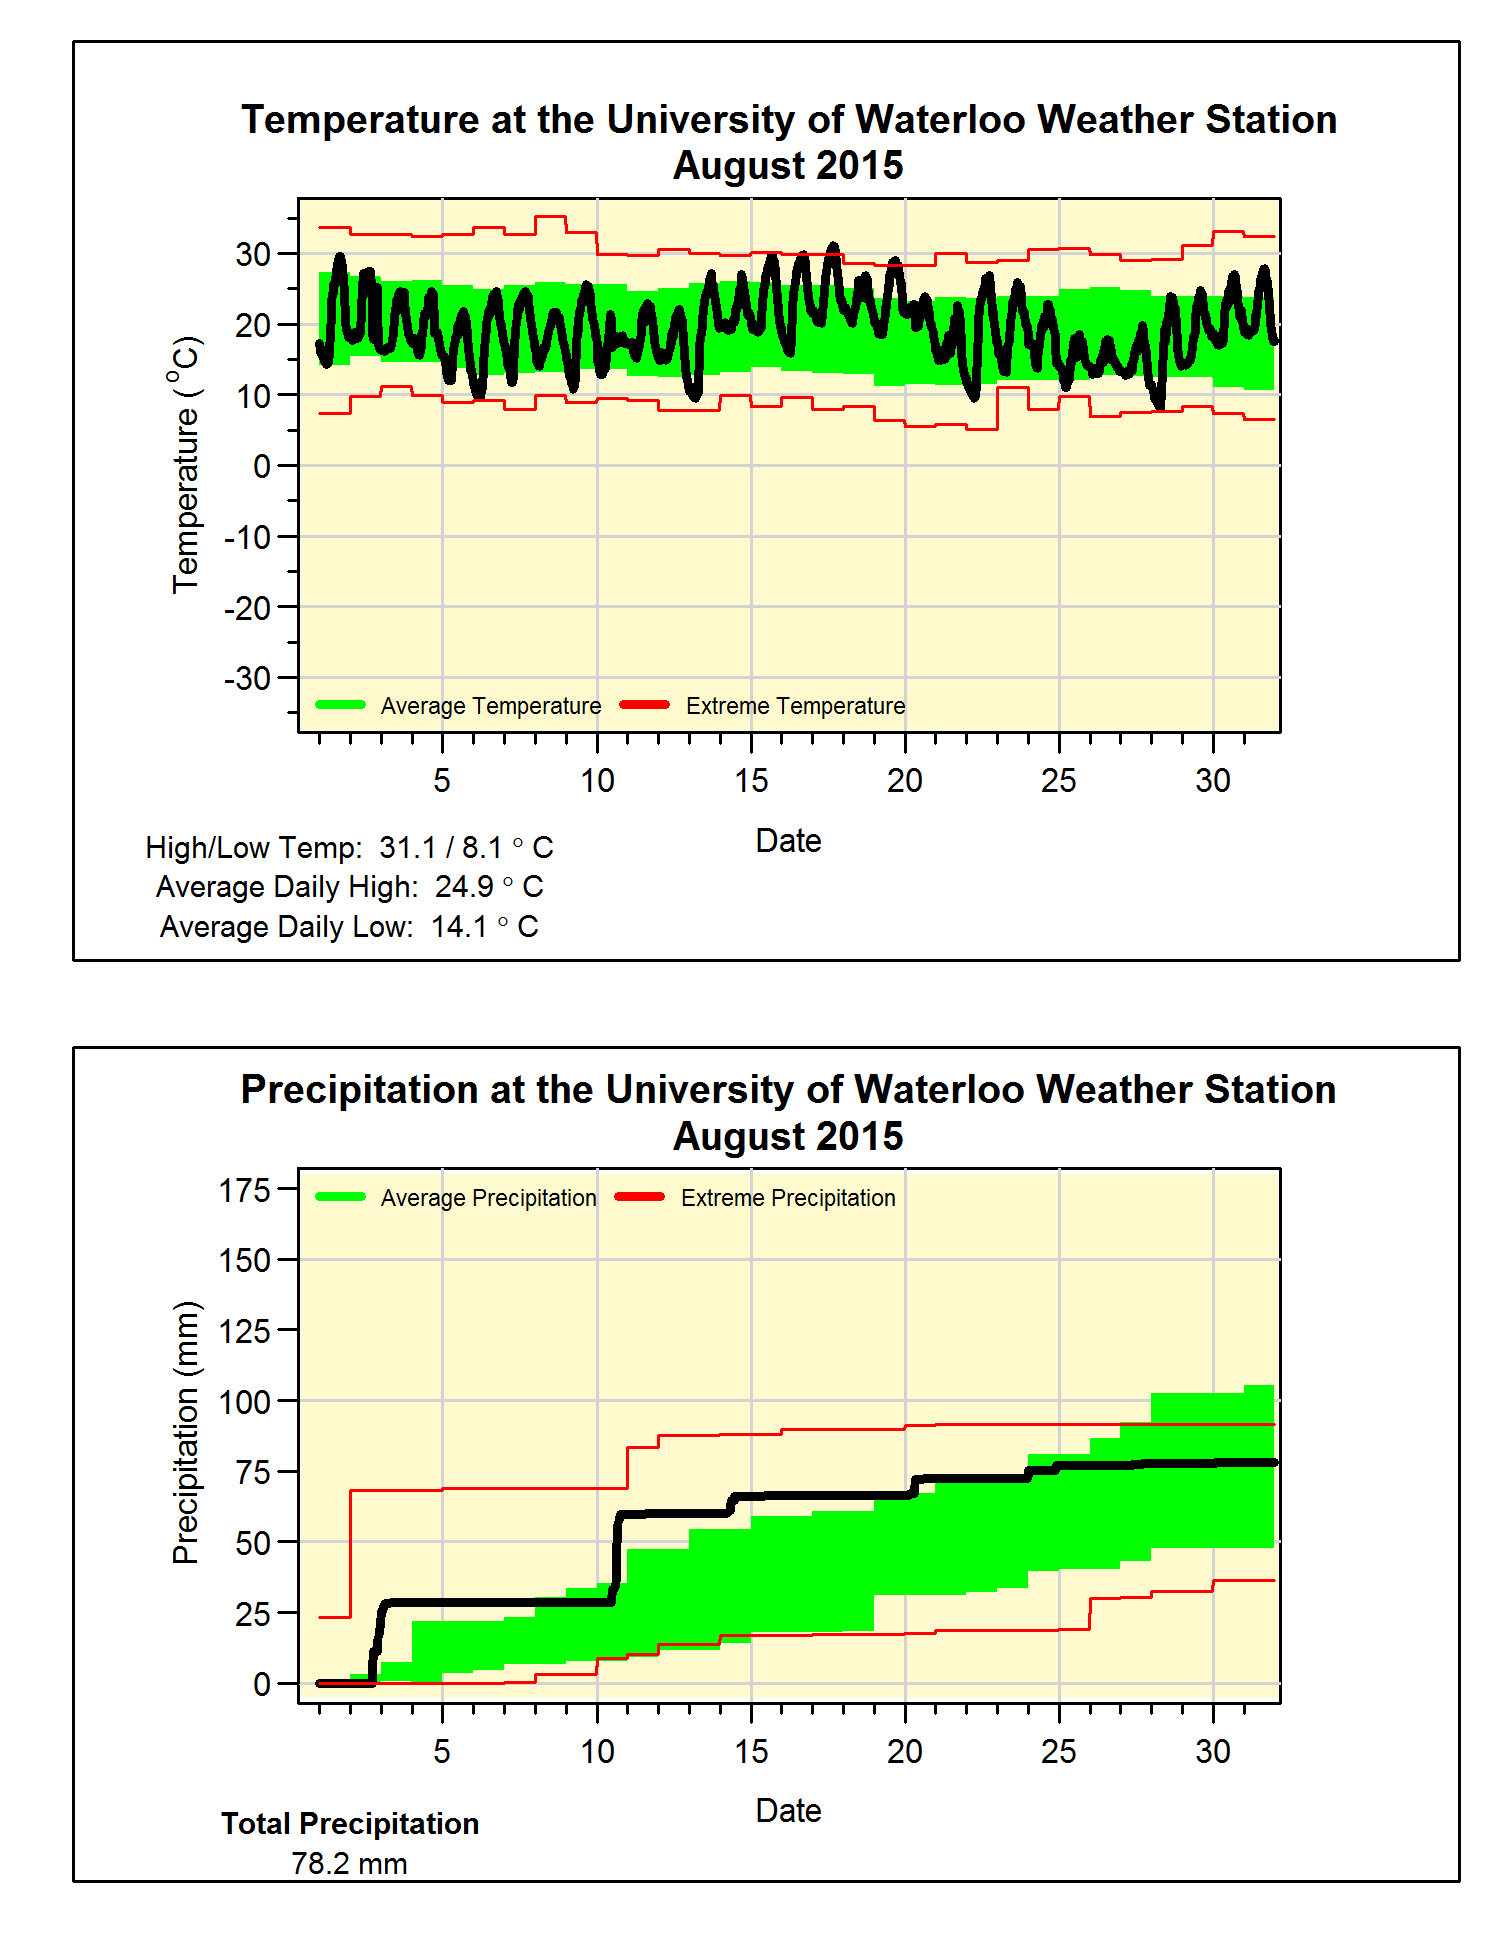
Even though we had 3 days in a row where the high temperature didn’t go above 20°C (the first time that has happened in August since 2000), overall it was a little over half a degrees hotter than average which is on the high end of the average range.  As sometimes happens, there was a big difference between the daily high temperature (just 0.2 degrees above average) and the daily low temperature (1.2 degrees above average).

About 60 mm of the month’s 78.2 mm of precipitation came during the first 10 days of the month and most of that came during just 2 days (23.0 mm on the 2nd and 31.2 mm on the 10th).  It has been pretty dry since then, but it was enough to make the total close to the average of 83.9 mm.

This pretty average month kept the total precipitation for the year (516.4 mm) pretty much the same distance from what we would expect at this time of year (596.0 mm).


Summary for August 2015:
Maximum Temperature 31.1°C
Minimum Temperature 8.1°C
Average Daily High Temperature 25.0°C (Long term average 24.8°C)
Average Daily Low Temperature 14.1°C (Long term average 12.9°C)
Total Precipitation 78.2 mm (Long term average 83.9 mm)

(Long term averages based on 1981-2010 data for the Waterloo Wellington Airport)


Thursday, August 6, 2015

July 2015 Summary

July was dry with average temperature

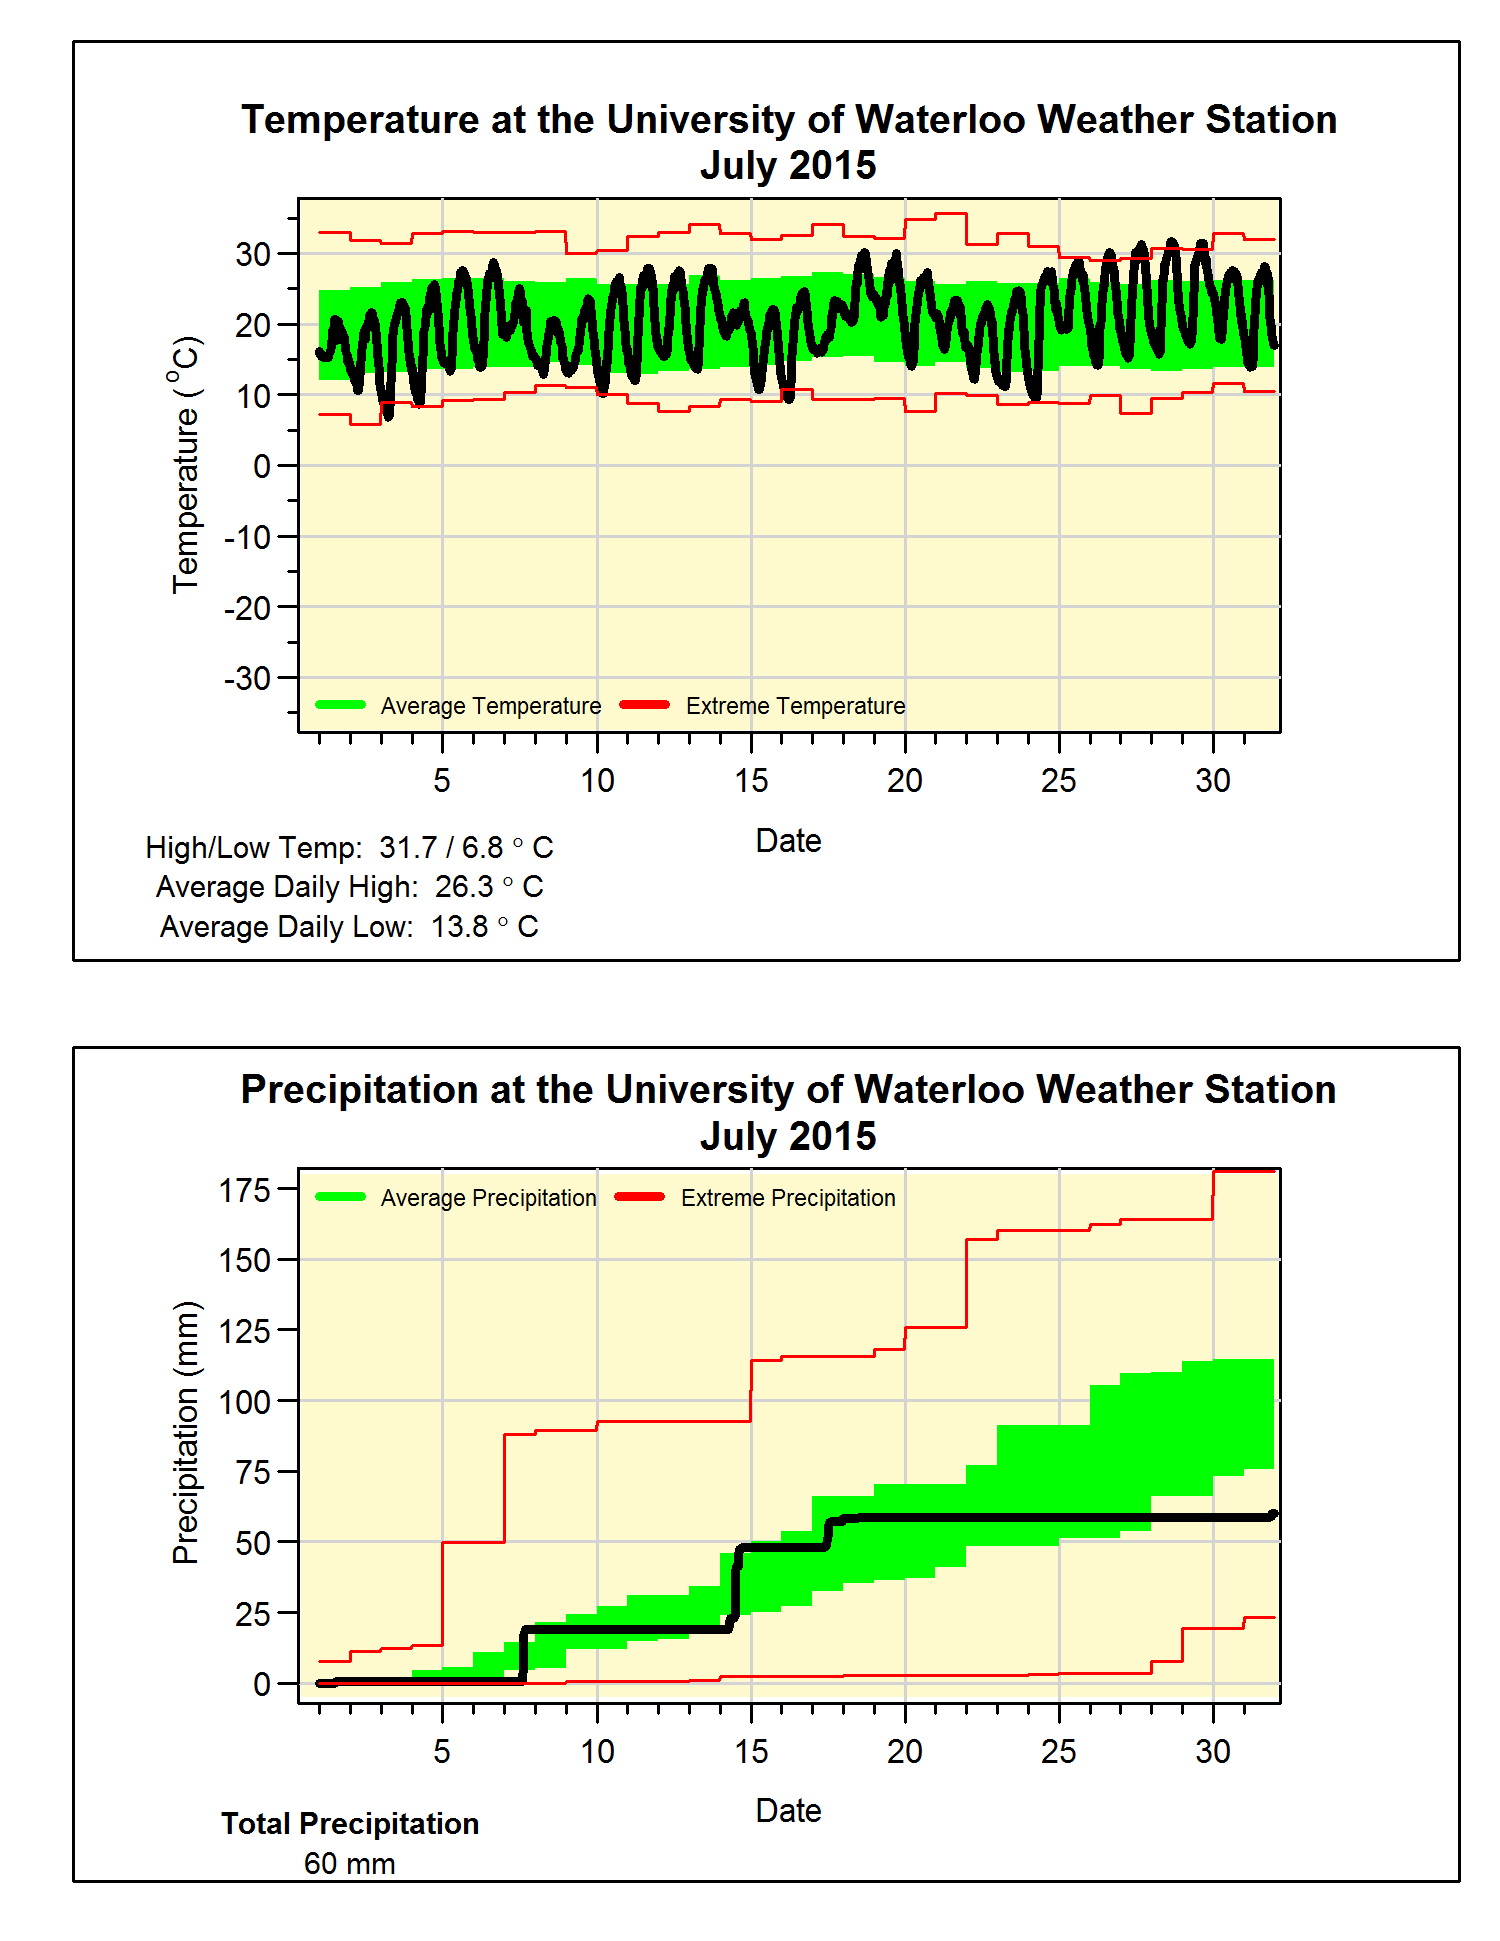
Even with the mini-heatwave we saw at the end of July with 4 days over 30°C, for the second month in a row it was a very average month for temperature, coming in again as just 0.1 degrees above average.    These 4 days over 30°C might have felt like something significant, but it is something we have seen in over half of the last 30 years.

Also interesting was that the low of 6.8°C on the 3rd was the lowest July temperature since 2001.

The first half of the month was a pretty average for precipitation, but then the tap was shut off with only 1.6 mm after the 18th.  This caused the total for the month (60.0 mm) to be well below the average (98.6 mm).

A dry month meant that the total for the year so far (438.2 mm) fell further away from the average (509.0 mm).


Summary for July 2015:
Maximum Temperature 31.7°C
Minimum Temperature 6.8°C
Average Daily High Temperature 26.3°C (Long term average 26.0°C)
Average Daily Low Temperature 13.8°C (Long term average 14.0°C)

Total Precipitation 60.0 mm (Long term average 98.6 mm)


(Long term averages based on 1981-2010 data for the Waterloo Wellington Airport)