Tuesday, March 22, 2016
Winter 2015/16 Summary
I did this one as a series of tweets:
Winter 15/16 Summary #1: The temperature was 3.3 degrees above average, second warmest in 100 year history of weather records in the region
Winter 15/16 Summary #2: The precipitation of 178.2 mm was just a little under the 1981-2010 average of 184.5 mm.
Winter 15/16 Summary #3: So far we have seen about half of the average amount of snowfall, however that could change this week.
Winter 15/16 Fun Fact 1: The warmest winter in the region was in 2011-12 which ended with that crazy March featuring temperatures in the mid-20s
Winter 15/16 Fun Fact 1: Longest streak of days without an above zero temperature: This winter 9 Days, last winter 41 Days.
FS

Tuesday, March 8, 2016
February 2016 Summary
Another warm month with average precipitation
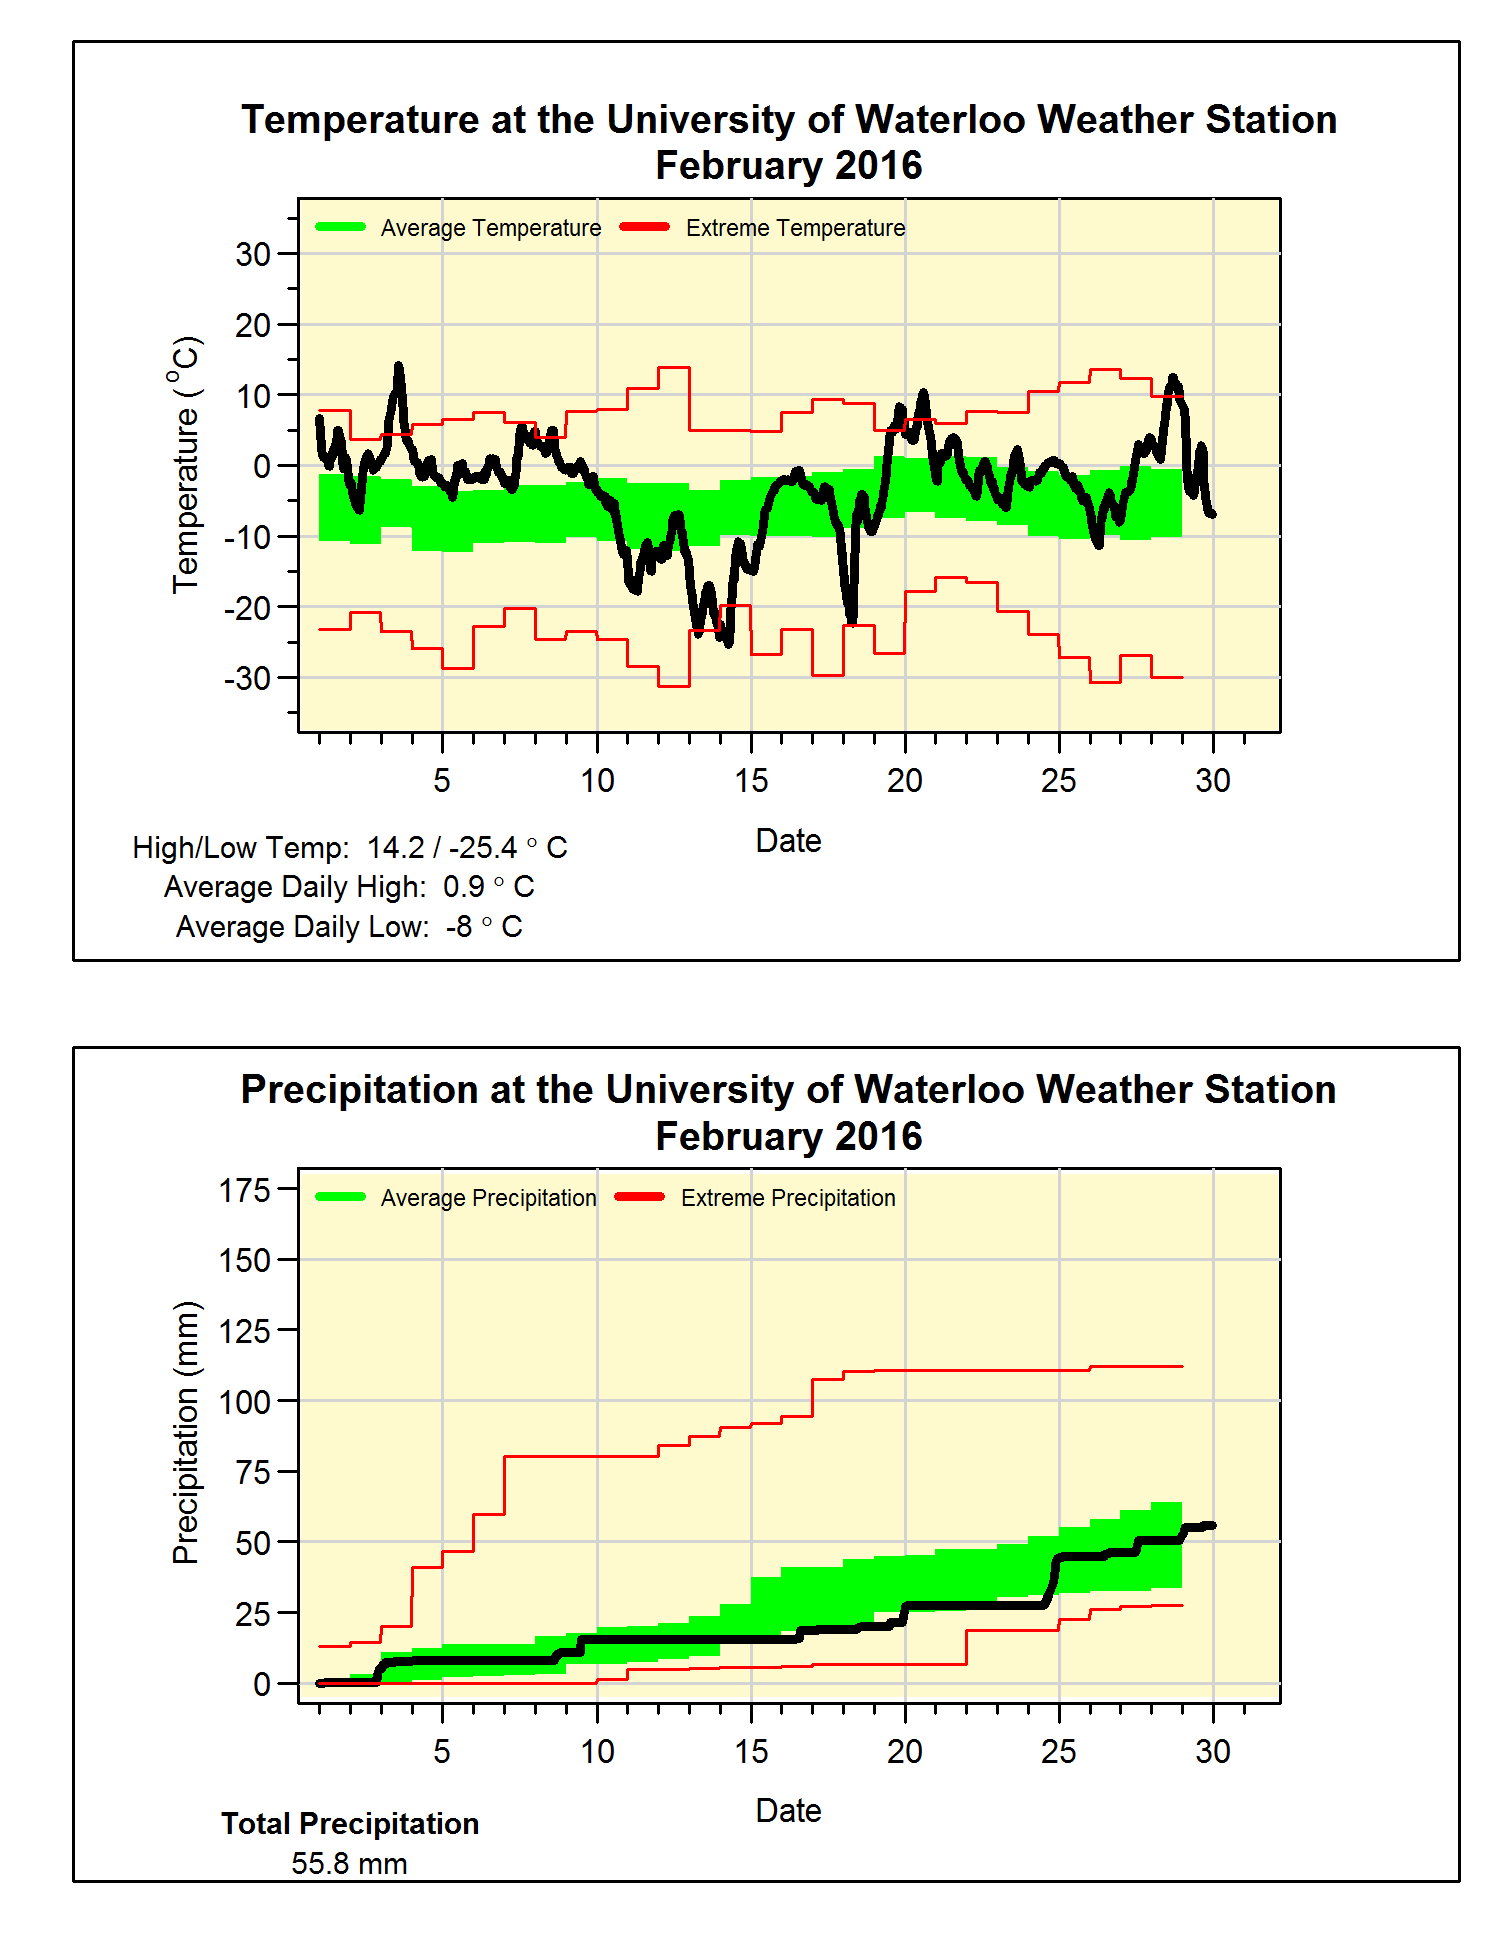
It was a month that saw some very warm and also some very
cold temperatures. However, the warms
ones greatly outnumbered the cold ones resulting in a month that was almost 2
degrees above the long term average.
This is a lot, but we only have to go back to 2012 to find a warmer one.
Of note is that the high of 14.2°C on the 3rd was
the highest February temperature we have ever seen in the over 100 years of
records in the region. This beat the
13.9°C on February 12th, 1999.
Not many large storms during the month, with the final total
precipitation of 55.8 mm ending up pretty close to the average of 54.9 mm. While the 17.5 cm of snow in February was
just a little over half of the average of 30.3 cm.
Summary for February 2016:
Maximum Temperature 14.2°C
Minimum Temperature -25.4°C
Average Daily High Temperature 0.9°C (Long term average
-1.2°C)
Average Daily Low Temperature -8.1°C (Long term average -9.7°C)
Total Precipitation 55.8 mm (Long term average 54.9 mm)
(Long term averages based on 1981-2010 data for the Waterloo
Wellington Airport)
Sunday, March 6, 2016
Last day to enter the 2016 UW Weather Station contest
Just a reminder that there is only one more day to enter the UW Weather Station Contest. The entry period ends Monday, March 7 at 2:00 pm.
Enter here: http://weather.uwaterloo.ca/contest2016/contest.html
Enter here: http://weather.uwaterloo.ca/contest2016/contest.html
Tuesday, February 2, 2016
January 2016 Summary
A warm January with average precipitation
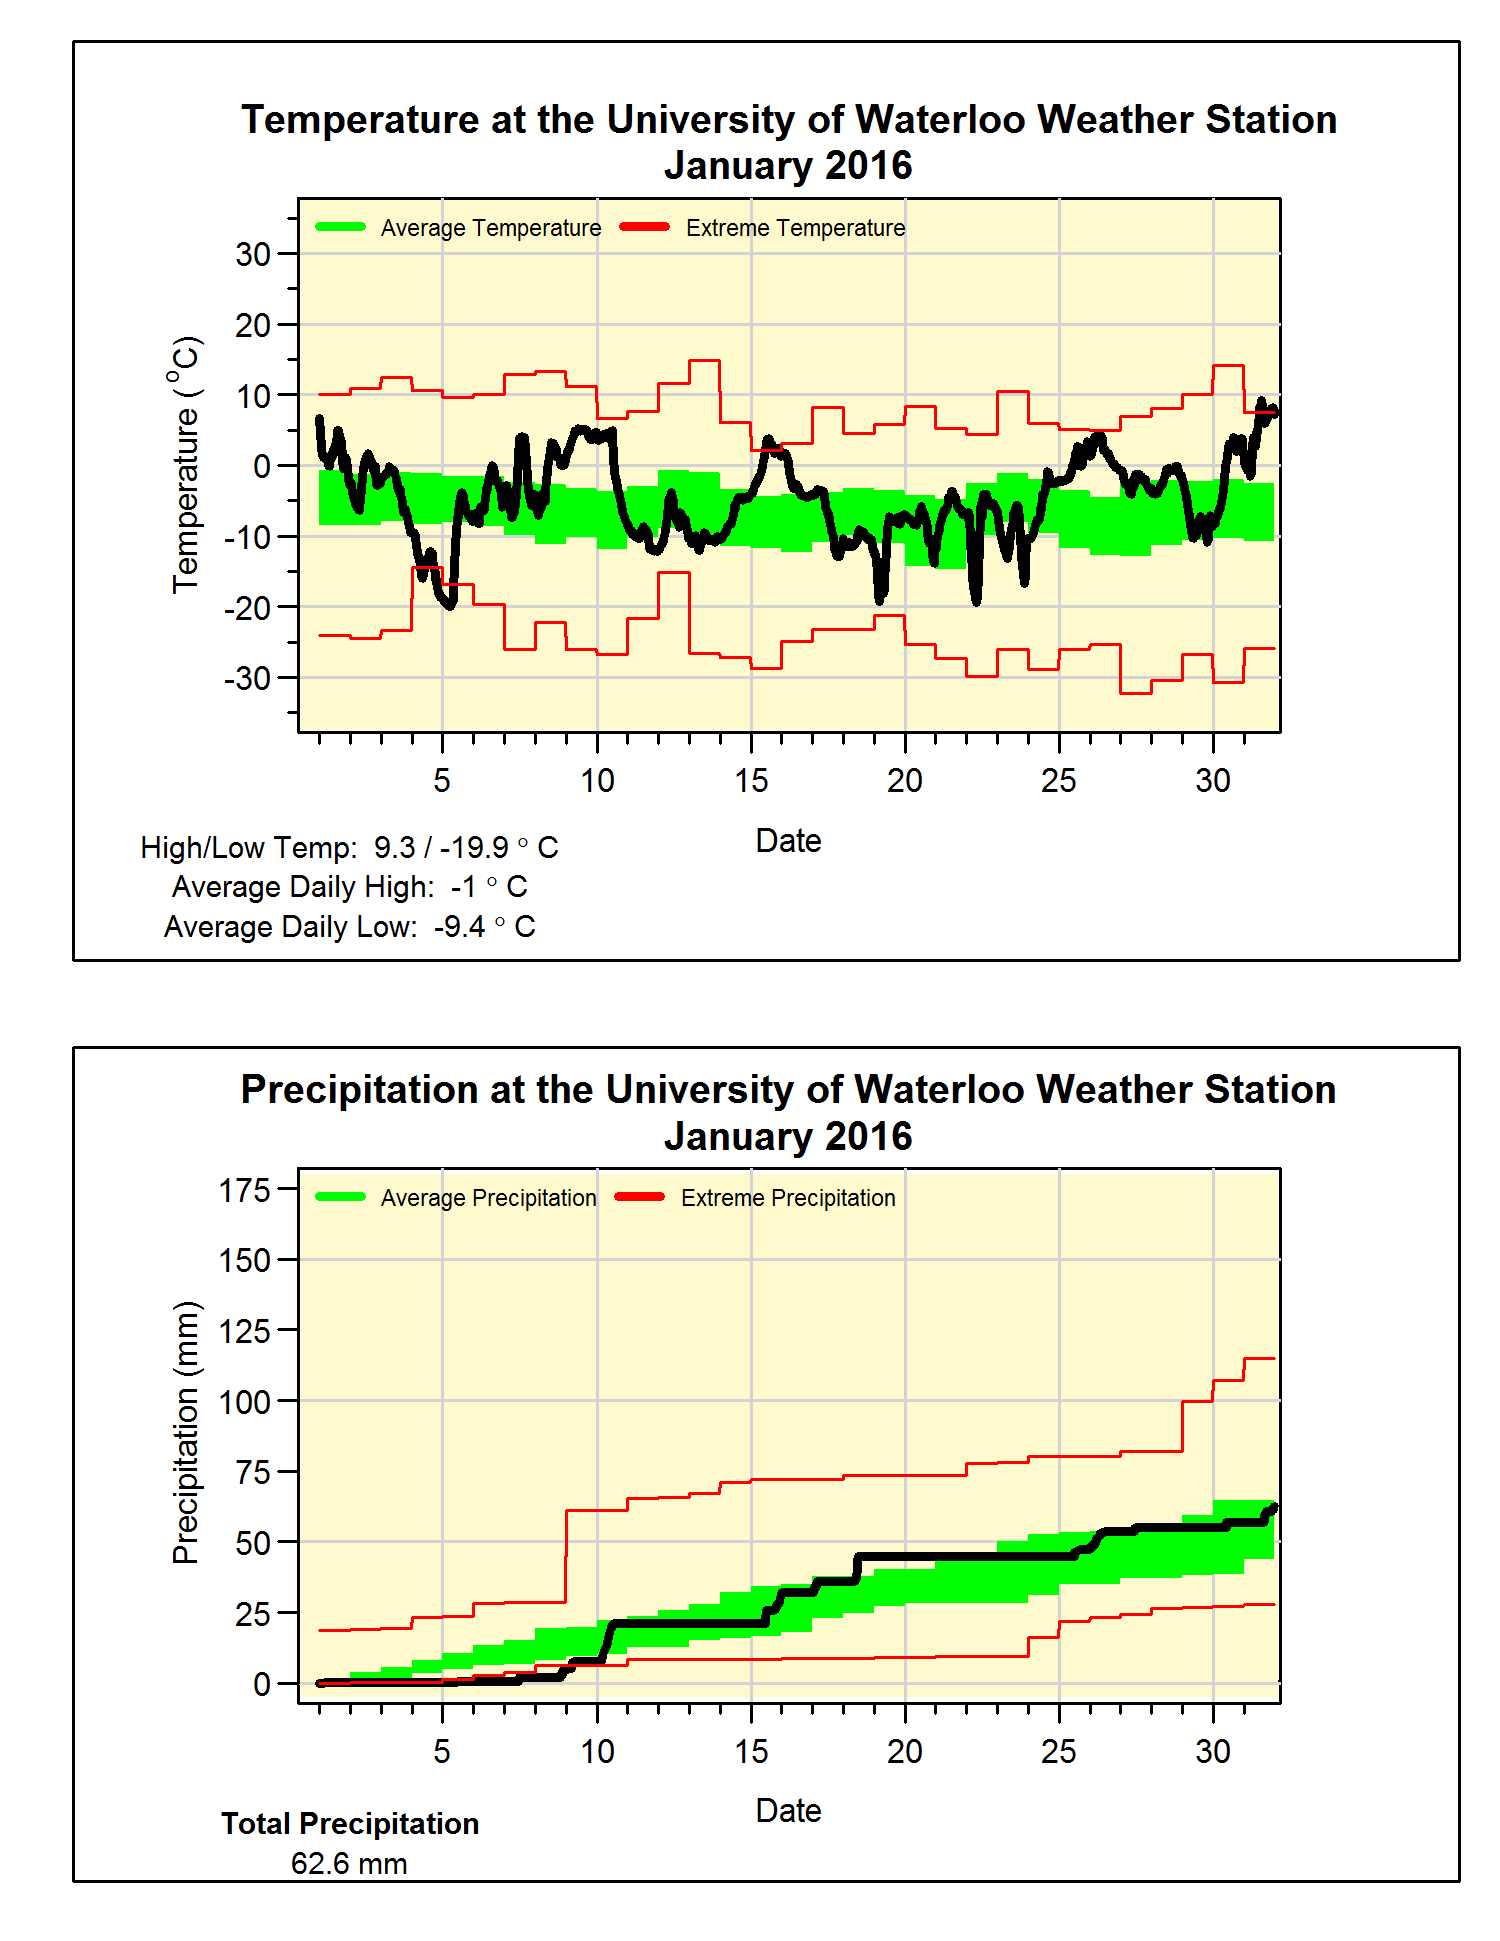
After a couple of very interesting months weather-wise, the start of 2016 might have seemed just a little bit boring. It was a warm month, with the overall temperature coming in a bit more than a degree above average. But, this isn’t that special as we only have to go back 3 years to find a warmer January.
However, it was quite the contrast to the last two years as this year it was over 4 degrees warmer than those. It also may have felt a lot warmer as there was never more than one cold day in a row.
The total precipitation for the month of 62.6 mm was just a little bit less than the average for January of 65.2 mm. With the warmth we saw this month it isn’t surprising that the snowfall of 36.5 cm was also below the average of 43.7 cm.
Summary for January 2016:
Maximum Temperature 9.3°C
Minimum Temperature -19.9°C
Average Daily High Temperature -1.0°C (Long term average -2.6°C)
Average Daily Low Temperature -9.4°C (Long term average -10.3°C)
Total Precipitation 62.6 mm (Long term average 65.2 mm)
(Long term averages based on 1981-2010 data for the Waterloo Wellington Airport)
Sunday, January 3, 2016
2015 Summary
University of Waterloo Weather Station Annual Summary -
2015
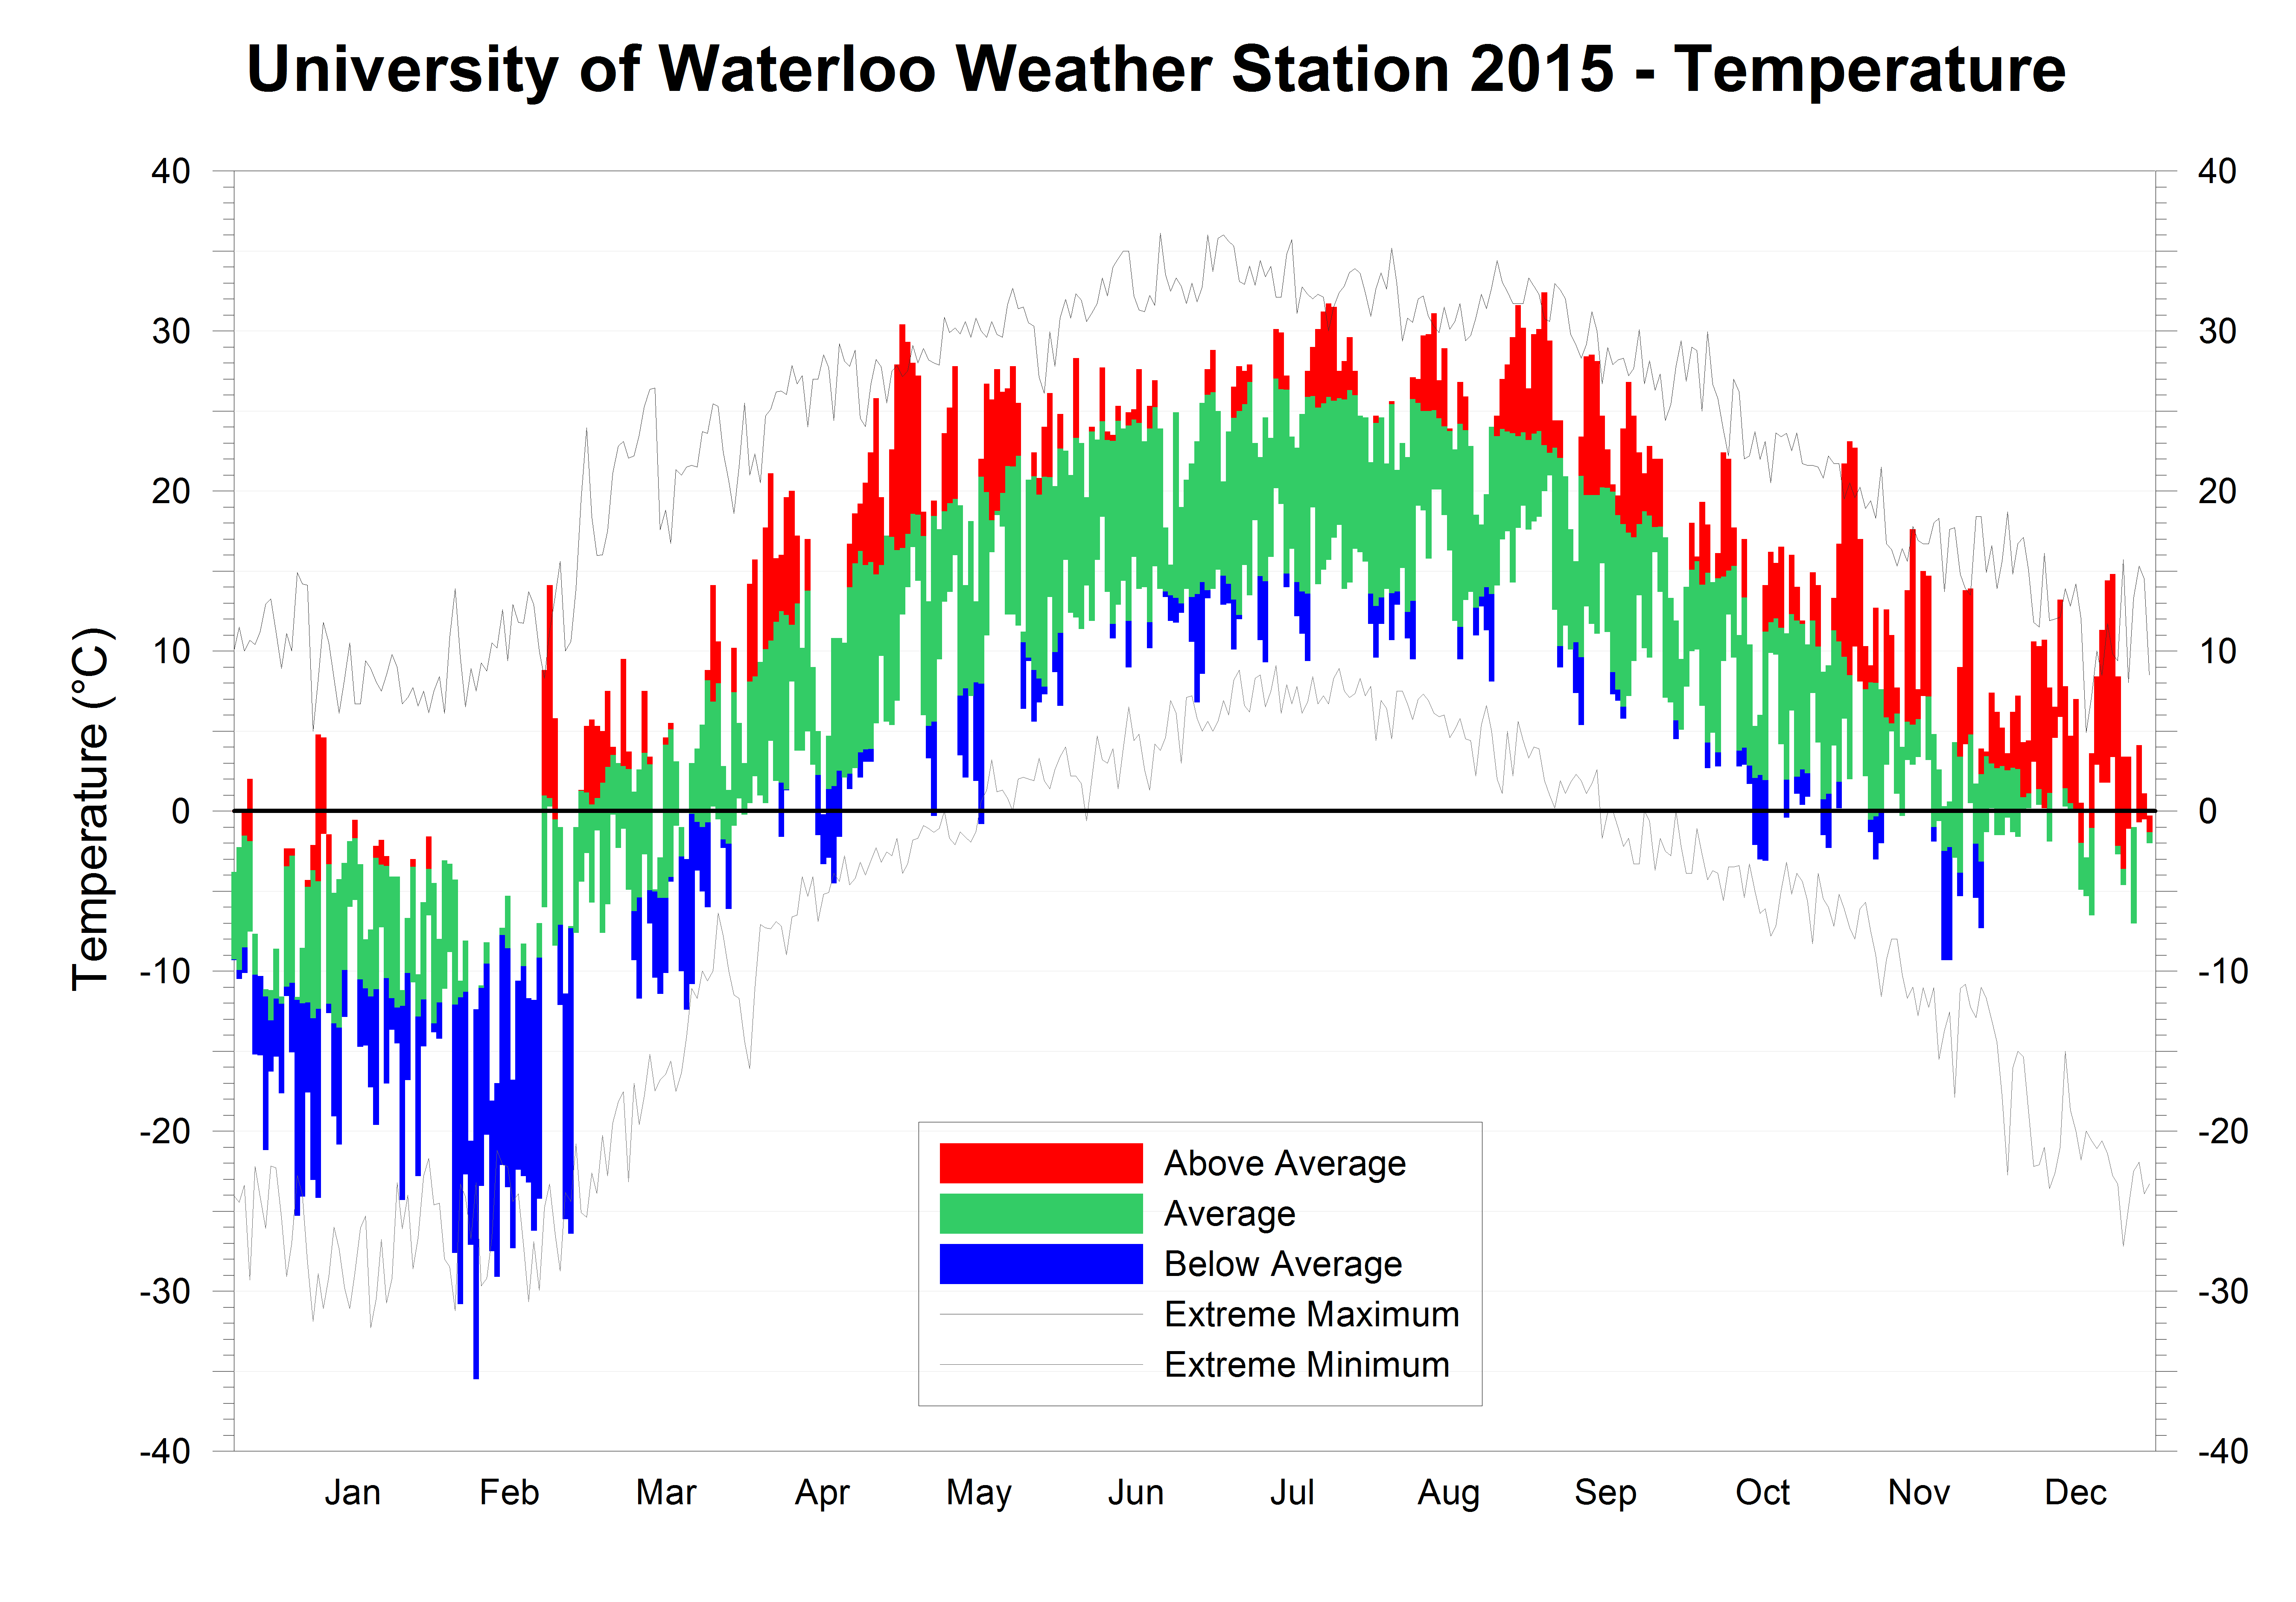
A quick look at the
temperature graph for the year pretty much tells you the story for this
year. First is the large amount of blue
(indicating lower than average temperatures) in February and the lack of blue
(meaning higher than average temperatures) in December. These were both record months for the 100
years of weather data in our region.
The year started off
really cold with only a few warmer than average days during January, but this
was only a foreshadowing of what was to come.
Not only was it followed by the coldest February in the region, but it
was the coldest of any month. Also of
note was the low temperature on February 16th of -35.5 °C, which was the
coldest day we have recorded in the 17 year history of the UW Weather Station.
The spring started
out cold with March being at a little more than a degree below average (it
turned out to be the last colder than average month of the year). Then April was exactly average followed by May
which jumped up to being over 3 degrees warmer than average. Even with the warm temperatures in May, a
cold snap late in the month resulted in the temperature going below zero on May
23rd, this was the latest in the history of the UW weather station.
The summer saw its share
of both hot and cold days resulting in it coming out to pretty much average in
the end. The rest of the year was warm,
starting with September at 4 degrees above average, which was the second
warmest ever in the region, followed by October that was just about a degree
above. November came in at 3 degrees
above average and had both the second and third warmest November temperatures
since records began in the region.
Then came December,
which ranked as the warmest ever seen in the region by a full 2 degrees and it didn’t
have any colder than average days. Overall
for the year, it was 0.43 degrees above average during the year, this puts us
pretty much in middle of the pack for the last 10 years.
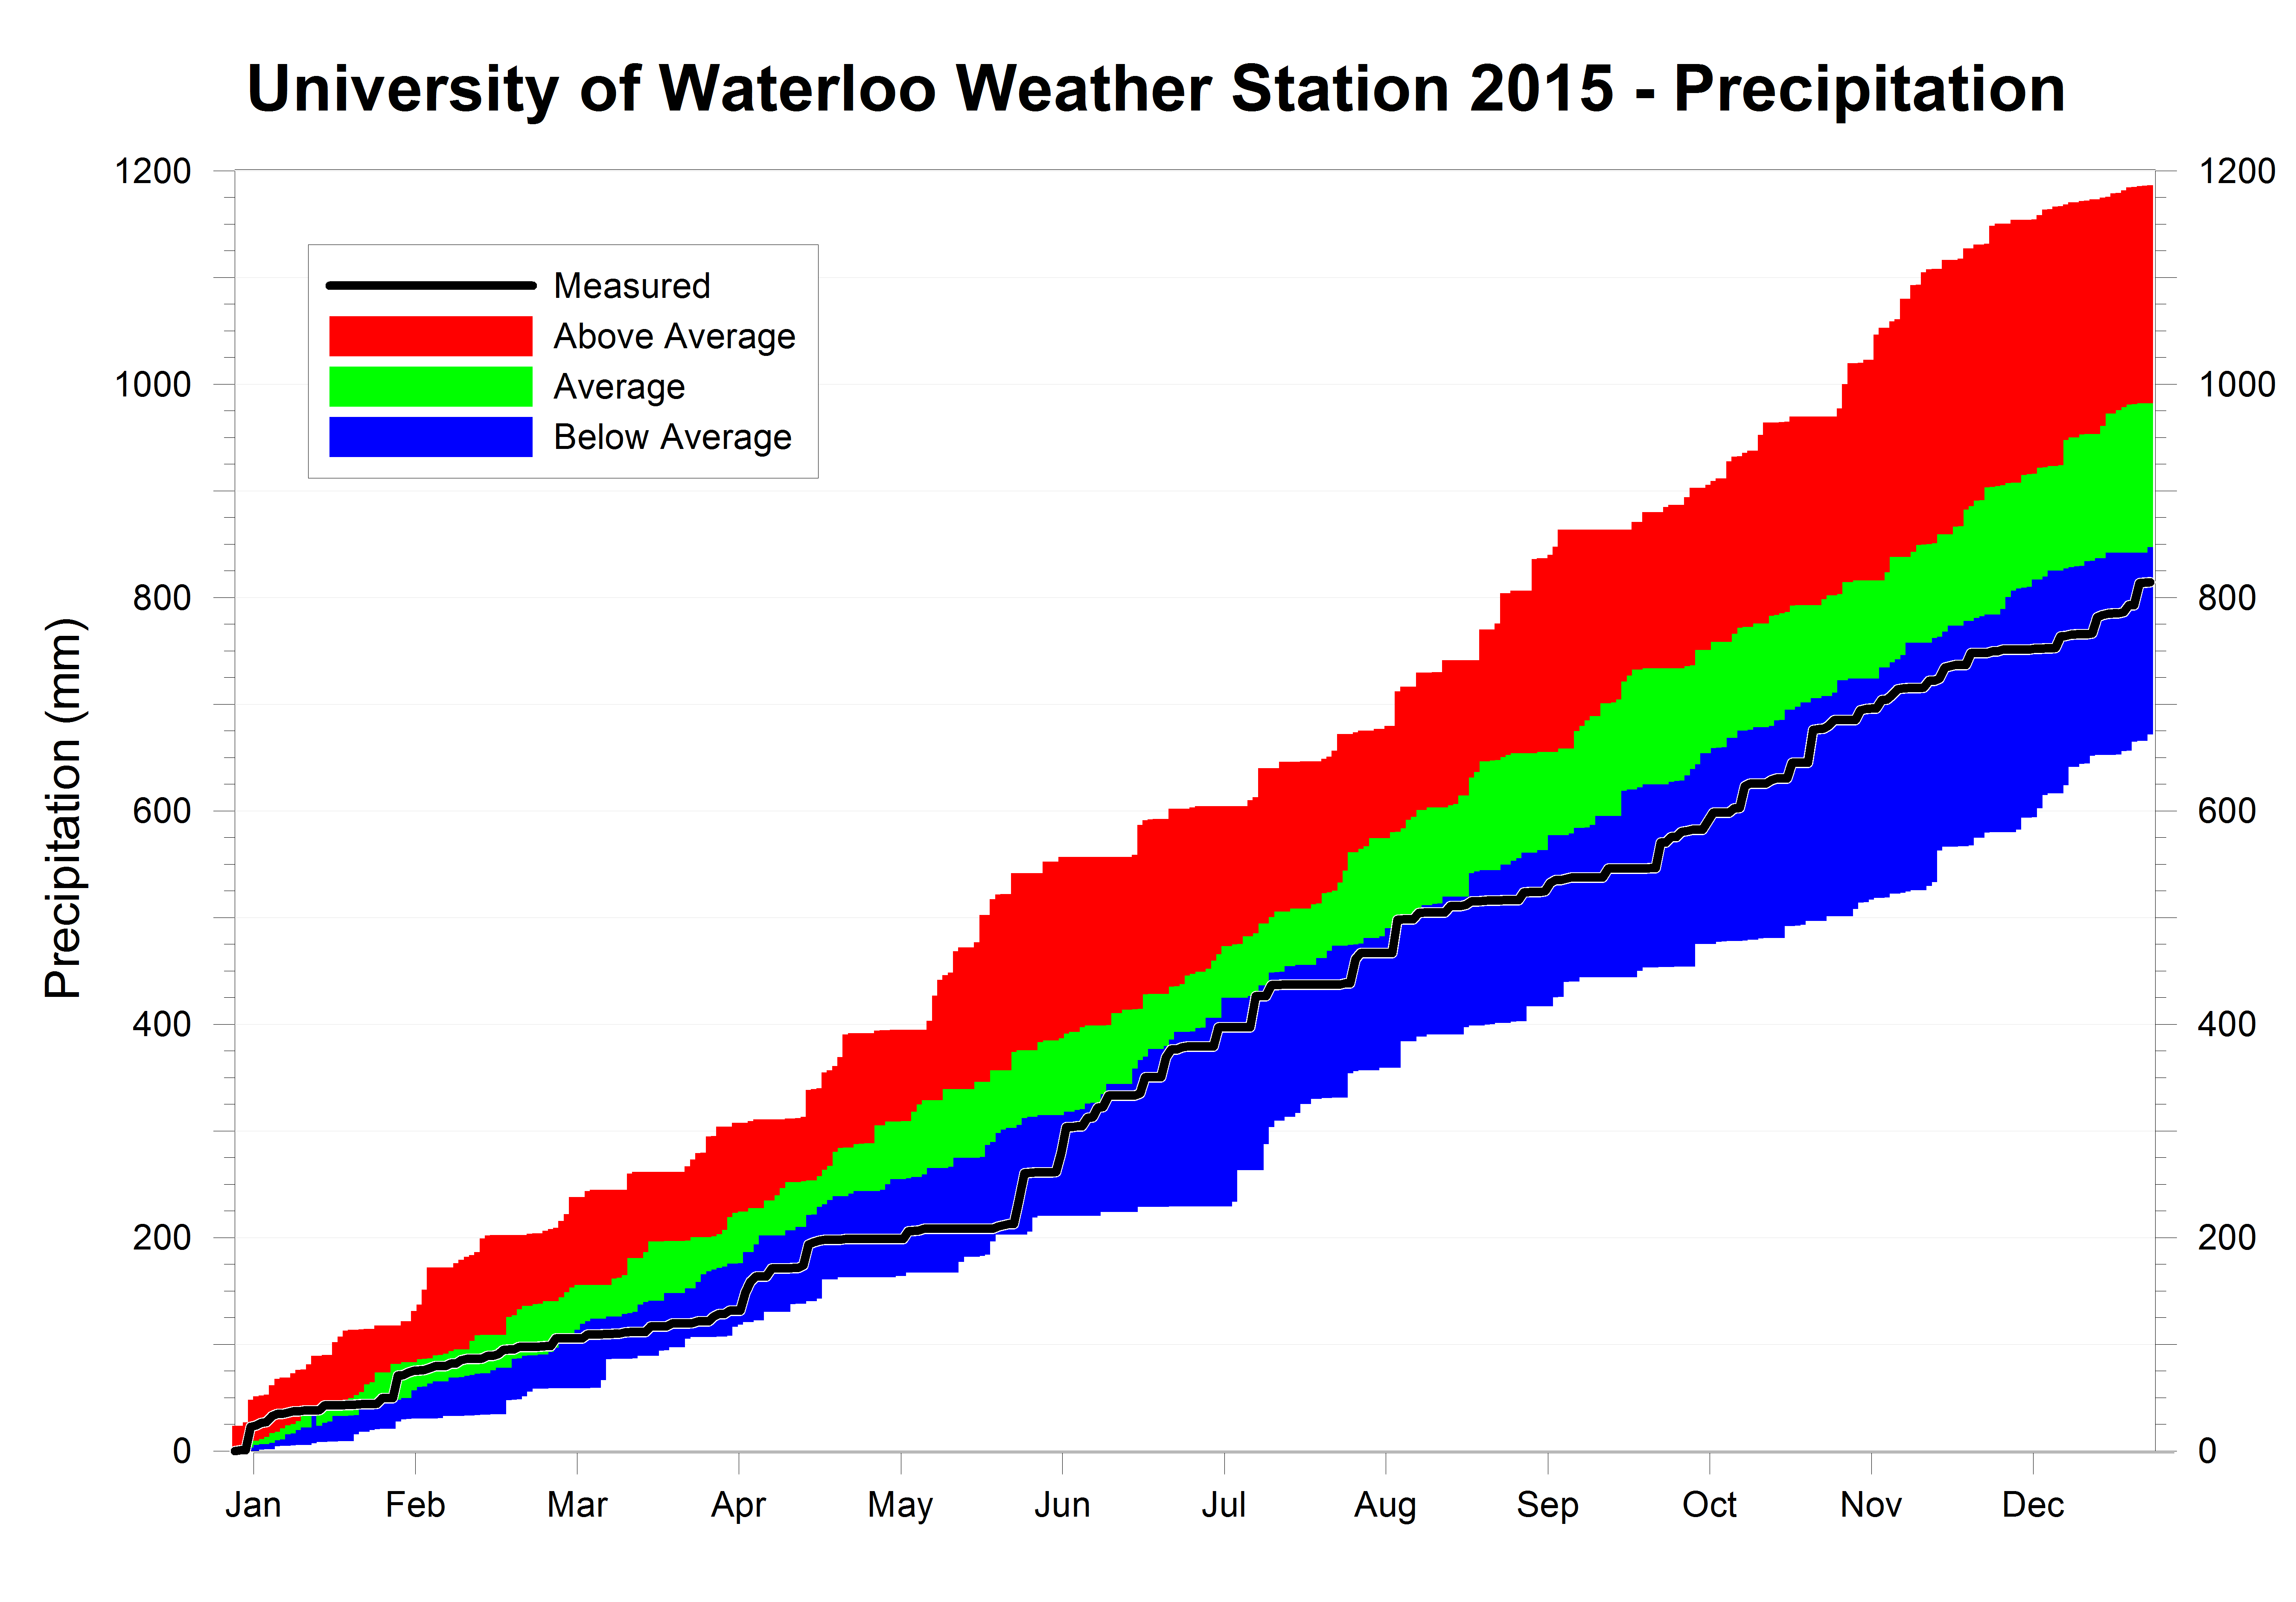
As for
precipitation, the year started off on the dry side and by the end of May it
was approaching the extreme low for that time of the year. However, June was the wettest month of the
year which almost put the total back into the average range. The rest of the year saw mostly drier than
average months with October being the only exception.
The total
precipitation for the year was 814.2 mm which is around 100 mm less than the
average of 916.3 mm. This puts it in the
below average range, but not historically low by any means.
Average Daily High Temperature: 12.96 °C (average 12.24 °C)
Average Daily Low Temperature: 2.01 °C (average 1.86 °C)
Total Precipitation: 814.2 mm (average 916.3 mm)
Click on the image below to see the precipitation chart:
Subscribe to:
Posts (Atom)


 Posts
Posts

