Saturday, October 2, 2021

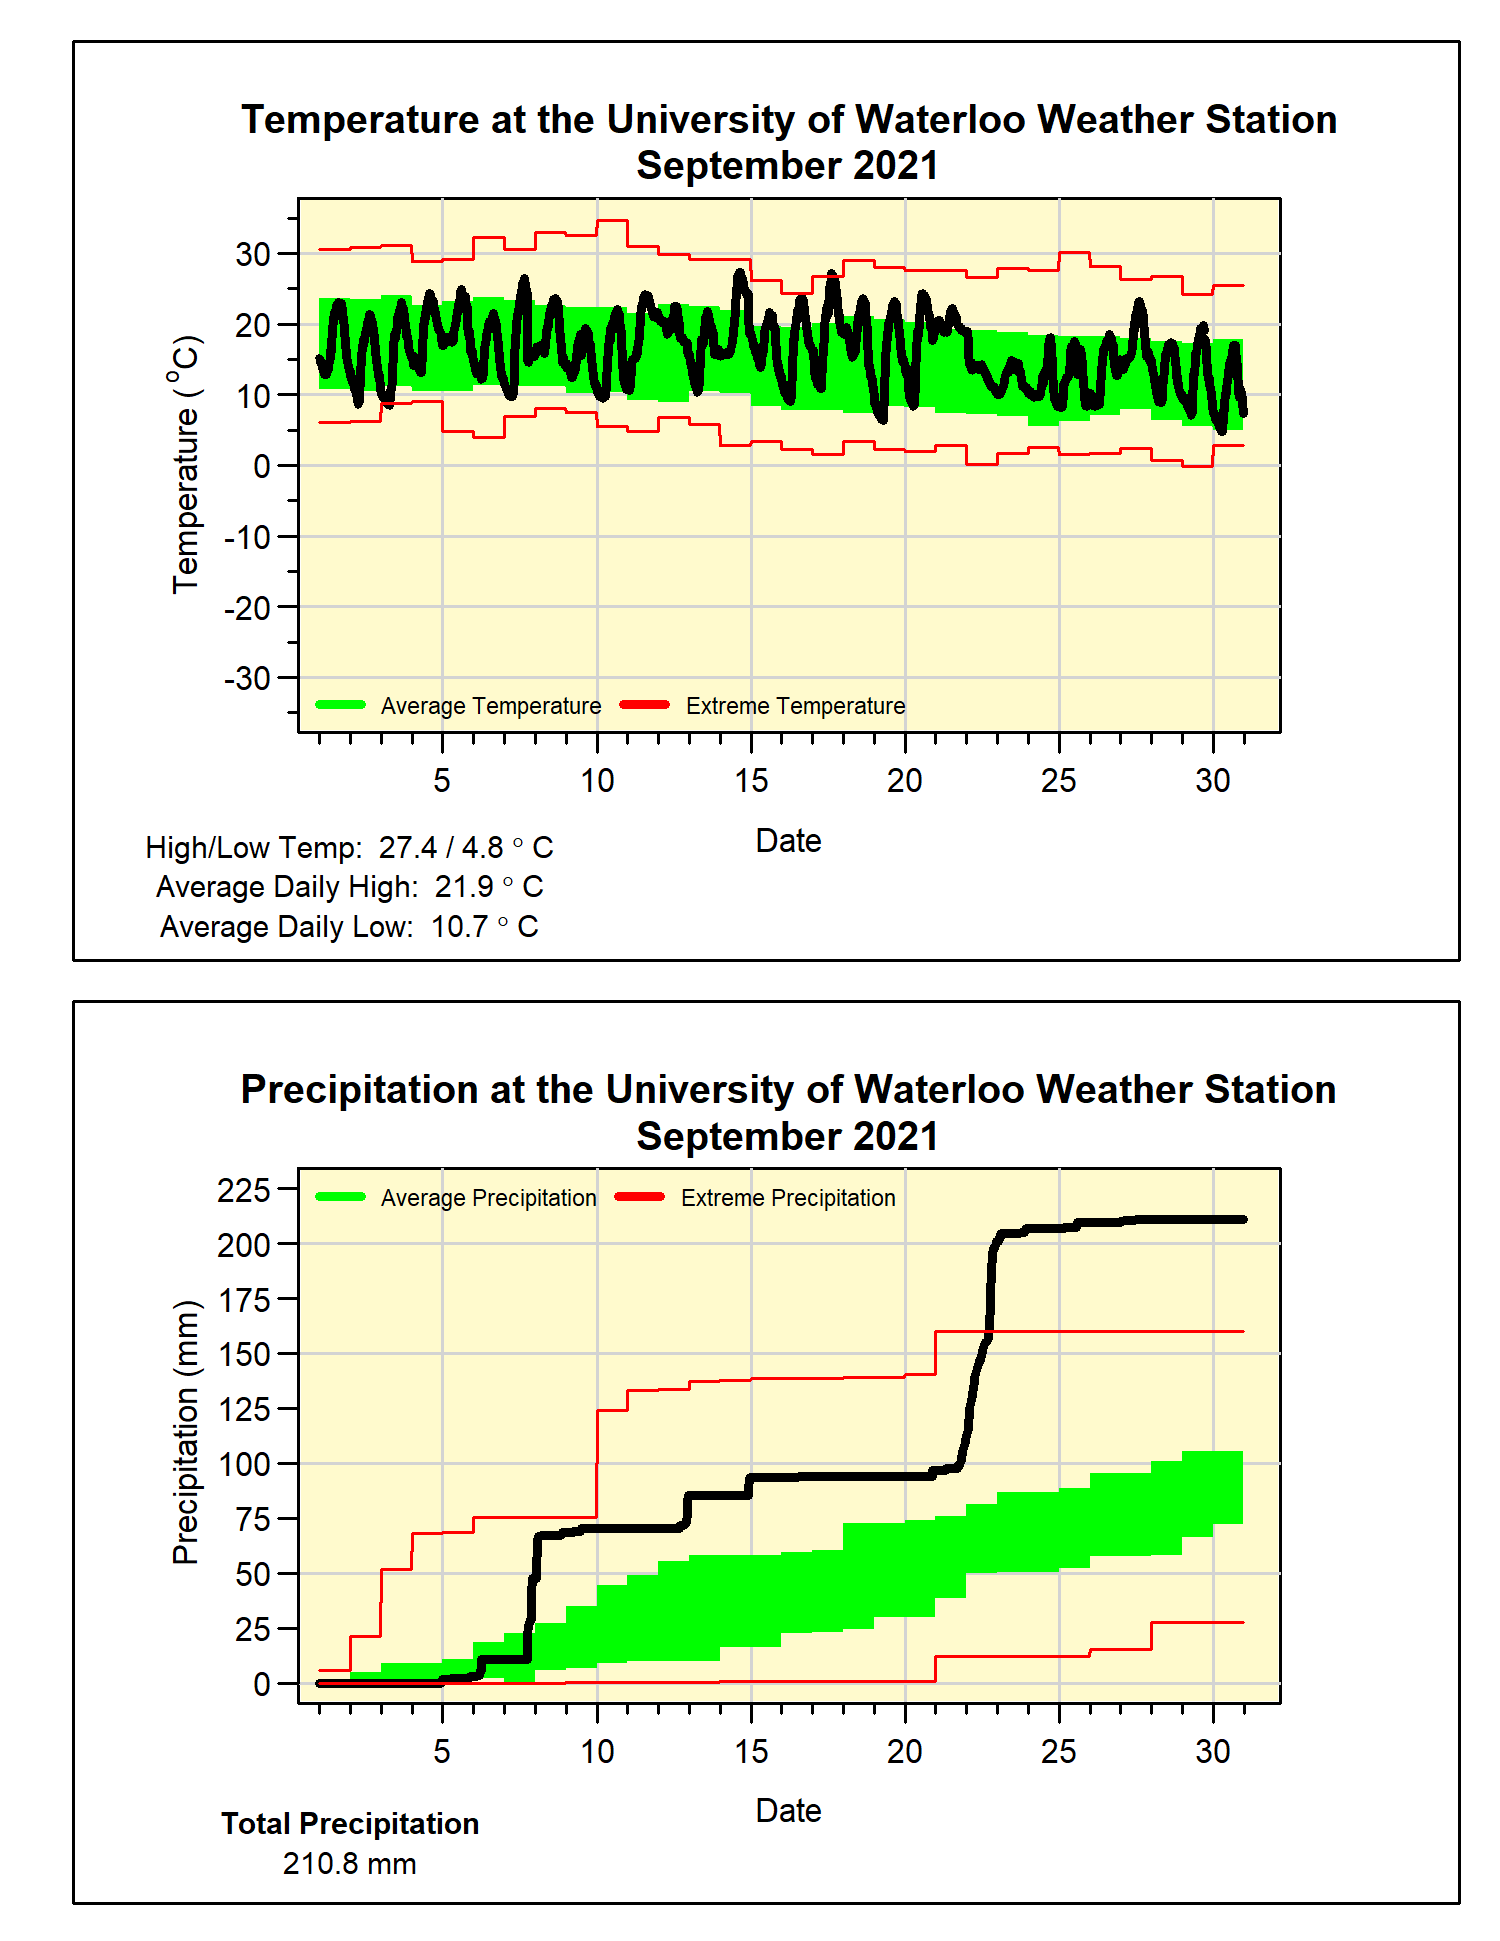
September 2021 Summary

September was hot and the second wettest ever in the region

The temperature was close to average for most of September, but a warm week in the middle of the month resulted in an overall temperature that was 1.8 degrees higher than average.  We still have not had a September in the 23 year history of UW Weather station that was in the below average range.

But of course the big story of the month was the precipitation and the amazing amount of rain that came down on the 21st and 22nd.  Starting from 9 pm Sept 21, 2021, we saw 93.4 mm in 24 hours, this is the now the highest 24 hour total ever recorded at the station (The previous was 91.4 mm starting Jan 11, 2020 at 3 am).  The total for the entire storm was 107.0 mm.

Incredibly, even without the rain from the 21st and 22nd, there still will would have been an above amount of precipitation for the month.  The total for September of 210.8 mm makes it the second wettest September in the over 100 years of weather records in the region (just behind the 216.6 mm in 1986).  It was also the 6th wettest for any month and the wettest month since the 223.2 mm recorded in July of 1988.

This very wet month put the total for the year of 788.3 mm well above the average of 683.5 mm.

Summary for September 2021:

Maximum Temperature 27.4°C
Minimum Temperature 4.8°C
Average Daily High Temperature 21.9°C (Long term average 20.4°C)
Average Daily Low Temperature 10.7°C (Long term average 8.6°C)
Total Precipitation 210.8 mm (Long term average 87.8 mm)

(Long term averages based on 1981-2010 data for the Waterloo-Wellington Airport)


Thursday, September 2, 2021

August 2021 Summary

 Both the second wettest and hottest August in over 20 years

The month of August had only a few cooler days compared to 8 days above 30°C, this resulted in an overall temperature that was a little more than 3 degrees above average.  Not only was this the second warmest August in the last 20 years, it was also one of the odd times when August was actually hotter than July.  

That was quite the storm that came through on the 29th!  Between the hours of 7:15 and 8:15 pm a total of 47.8 mm of rain was recorded.  This was the second highest 1 hour precipitation recorded at the UW Weather Station since it was established in 1998 (the record was 57.4 mm on August 2nd, 2014).  It also was over half of the total average precipitation for the month which is 83.9 mm.

If it wasn’t for that big storm at the end of the month, it might have actually ended up a drier than average month.  But that storm resulted in the total for August of 122.6 mm to be the second highest in close to 30 years.

After a dry start to the year, these last few wet months have brought the total precipitation we have seen so far in 2021 of 577.5 mm closer to the average of 596.0 mm.

Summary for August 2021:

Maximum Temperature 31.7°C
Minimum Temperature 8.4°C
Average Daily High Temperature 27.8°C (Long term average 24.8°C)
Average Daily Low Temperature 16.2°C (Long term average 12.9°C)
Total Precipitation 122.6 mm (Long term average 83.9 mm)

(Long term averages based on 1981-2010 data for the Waterloo-Wellington Airport)


Monday, August 2, 2021

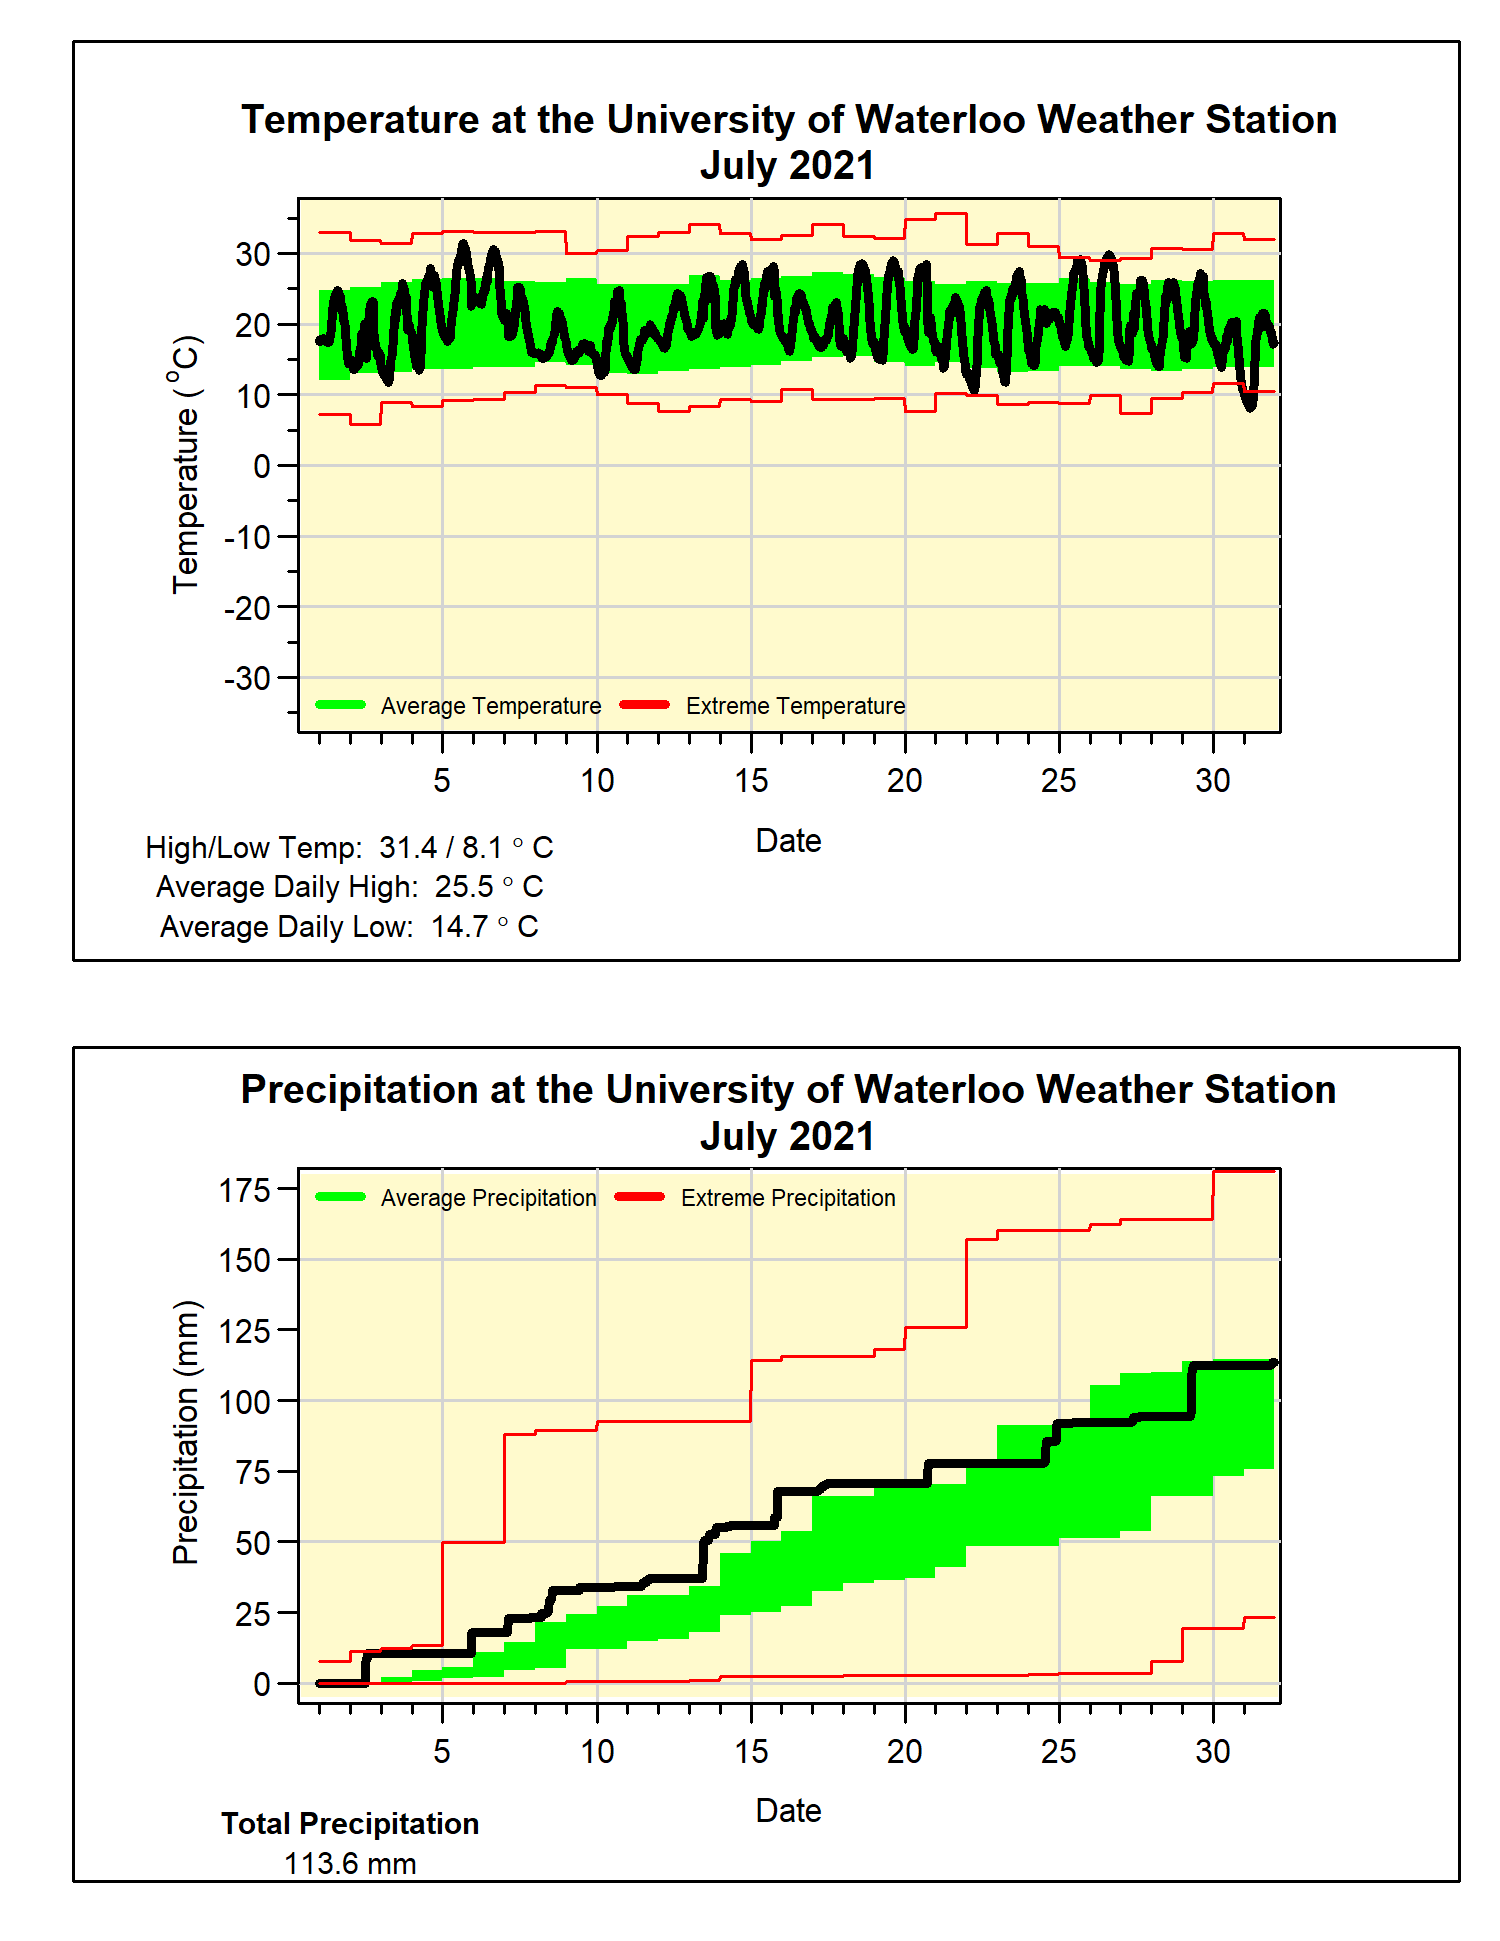
July 2021 Summary

An average month for both temperature and precipitation

Although the month started off with a bit of a hot streak, this was followed by some cooler temperatures and the rest of the month didn’t see many extremes.  The resulted in an overall temperature that was just a bit (0.2 degrees) higher than average, but well within the average range.  This does make it the coldest July in 6 years and there has only been 1 colder than average July in the last 12 years.

There was pretty consistent precipitation throughout the month, but in the end the 113.6 mm, although more than the 98.6 mm average, was less than a millimetre from putting it into the above average range.  However, it was the wettest July in the last 7 years.

After a dry start to the year, the most recent month and half has started to make up for it, the total precipitation so far this year of 454.9 mm is now closer to the average of 509.0 mm.

Summary for July 2021:
Maximum Temperature 31.4°C
Minimum Temperature 8.1°C
Average Daily High Temperature 25.5°C (Long term average 26.0°C)
Average Daily Low Temperature 14.8°C (Long term average 14.0°C)
Total Precipitation 113.6 mm (Long term average 98.6 mm)

(Long term averages based on 1981-2010 data for the Waterloo-Wellington Airport)


Thursday, July 1, 2021

June 2021 Summary

A very hot June with above average precipitation

There were lots of really hot days during the month and only a couple of cooler ones, this resulted in an overall temperature that was 3 degrees above average.  This was the warmest June since 2005 and the 5th warmest in the weather records in the region that go back to 1914.

A lot of this heat came at the beginning of the month, with 4 days over 30°C and 3 of those on consecutive days.  Although it is not unusual to see days this hot during June, typically they occur later in the month.  The last time there were 3 days in a row above 30°C in the first half of the month was back in 2005.

It was looking like it was going to be an average month for precipitation, but that all changed in the last 7 days.  During the last week of June there was one storm that resulted in 37.8 mm and then another a few days later that dropped 25.4 mm.  The total for the month was 117.4 mm, making it the wettest month since we got 154.7 mm in January of 2020.

Even with this very wet month, because it has been so dry this year, the total precipitation we have seen in the first half of the year of 341.3 mm is well below the average total of 416.1 mm.  

Summary for June 2021:

Maximum Temperature 31.4°C
Minimum Temperature 4.0°C
Average Daily High Temperature 26.3°C (Long term average 23.6°C)
Average Daily Low Temperature 14.9°C (Long term average 11.5°C)
Total Precipitation 117.4 mm (Long term average 82.4 mm)

(Long term averages based on 1981-2010 data for the Waterloo-Wellington Airport)


Tuesday, June 1, 2021

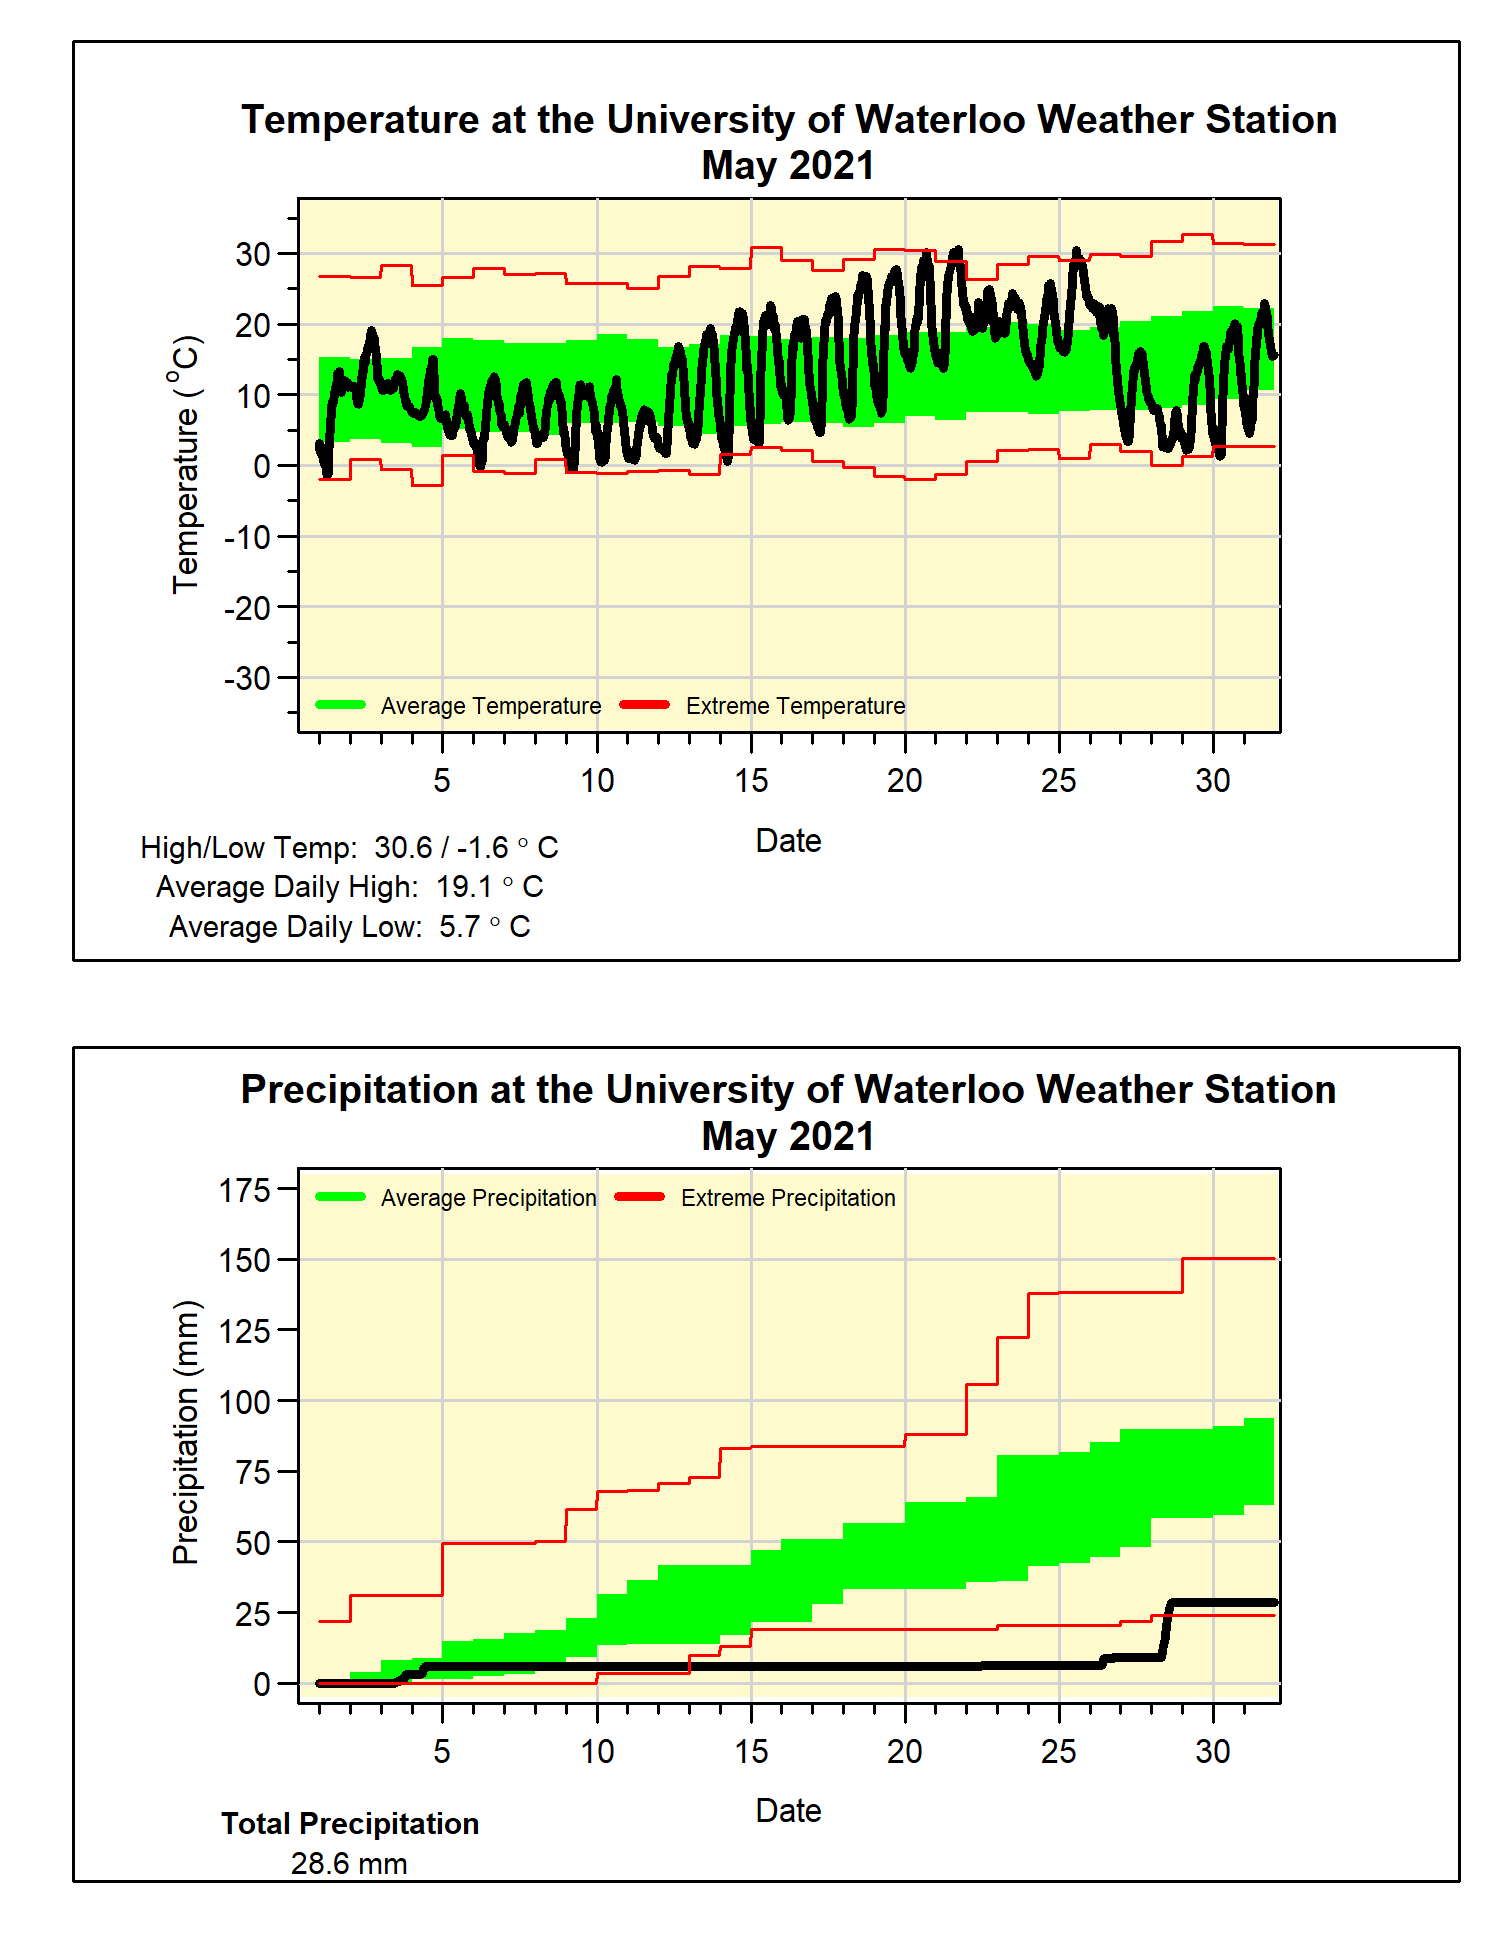
May 2021 Summary

A very dry May with average temperatures 

As often happens with months that have periods of cold temperatures (the start of May) and hot temperatures (the middle of May), the overall temperature turns out to be close to average.  In this case very close, with the month coming in at just 0.1 degrees below average.  

Assuming we have seen the last below zero temperature until the fall, the last freezing day was May 9th, this is just a couple of days later than the average in the last 20 years.  On the other end of the scale, there were 3 days of temperatures over 30°C during the month, when we typically we only average one of those days every other year.

With a period of over 2 weeks of no measureable precipitation, it was looking like it might be the driest May in the over 100 year of weather records in the region.  However, the wettest single day (19.6 mm) since mid-April on the 28th brought the total up to 28.6 mm for the month.  It was still the driest May since 2005, but only the 9th driest in local weather data records.  

This dry month puts the total for the year so far at 223.9 mm, well below the average of 340.2 mm.

Summary for May 2021:
Maximum Temperature 30.6°C
Minimum Temperature -1.6°C
Average Daily High Temperature 19.1°C (Long term average 18.5°C)
Average Daily Low Temperature 5.7°C (Long term average 6.4°C)
Total Precipitation 28.6 mm (Long term average 82.3 mm)

(Long term averages based on 1981-2010 data for the Waterloo-Wellington Airport)