Thursday, February 3, 2022

January 2022 Summary

A cold and dry January 

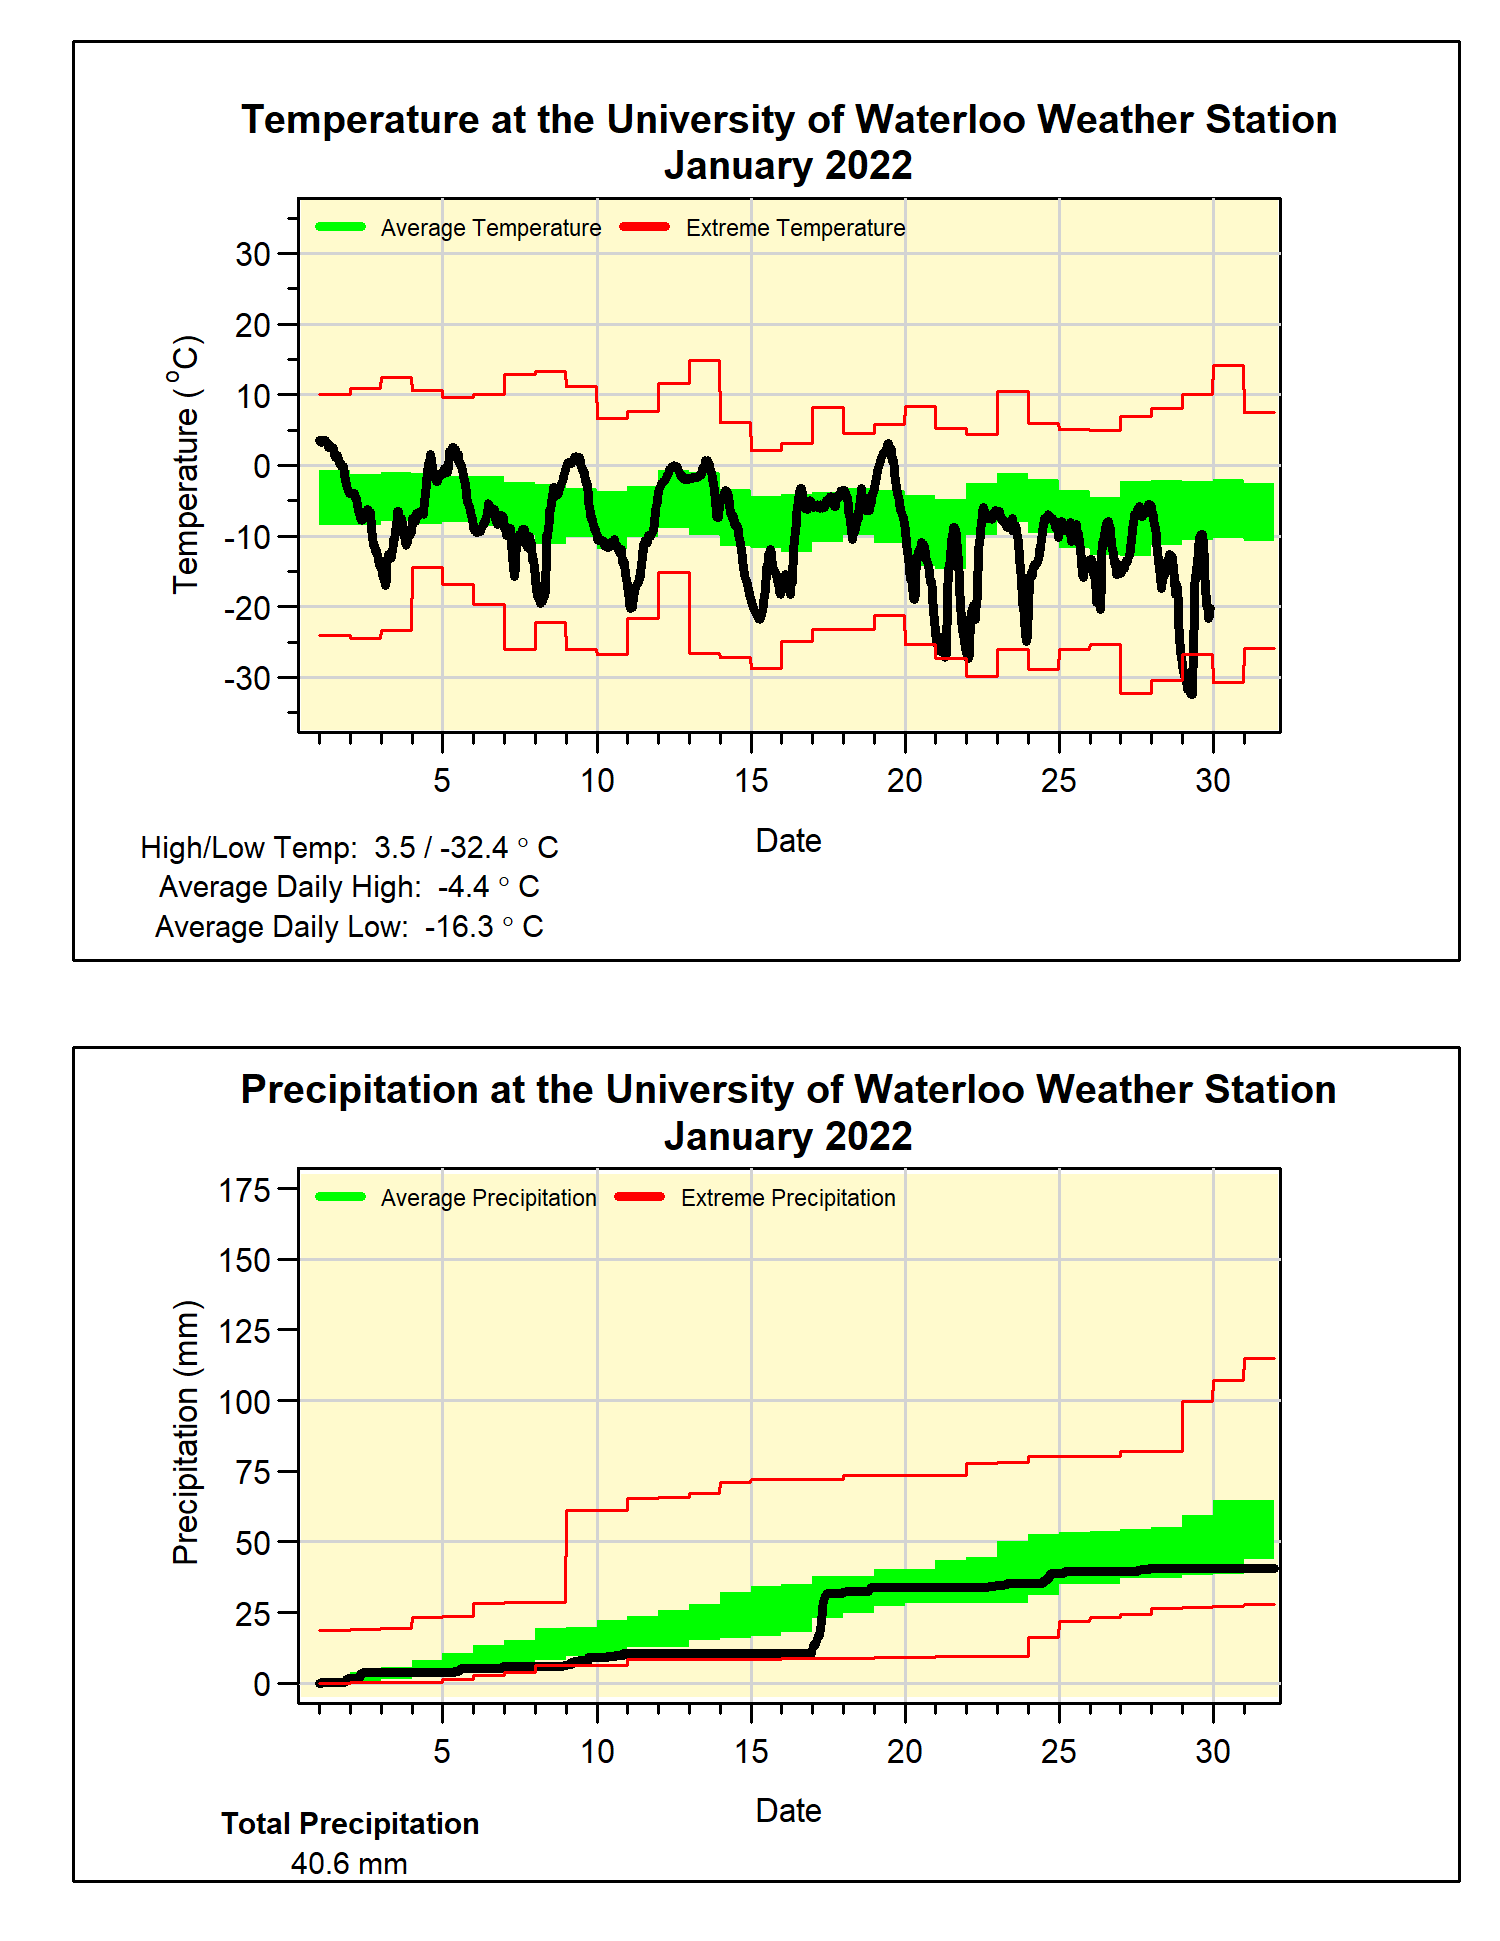
It was a very cold month, with an overall temperature that was almost 4 degrees below average.  This January was tied with 2014, so you have to go back even further to 2009 to find one that was colder.  It might have felt even more frigid as it was close to 6 degrees below last year and 8 degrees colder than the year before.  The freezing temperatures were sustained as it didn’t go above zero during the last half of the month.  

The low temperature of -32.4°C on the 29th was the second lowest temperature we have ever seen since the UW Weather station was established back in February of 1998.  The all-time low was -35.5°C on Feb 16, 2015.

Apart from the one storm that came through on the 17th (more about that later), it was pretty dry for the rest of the month.  The final total of 40.6 mm was below the average range.

About that storm on the 17th, it was probably the second or third highest snowfall total since we started measuring daily snowfall at the station in 2001.  What makes it difficult to know for sure it that snowfall is only measured once a day, thus the totals for larger storms are often not captured.  So although the total for the entire storm was 33.0 cm, 

the single day measurement was only 22.5 cm.  But this was the highest single day total since March 9, 2005 when we had 31.5 cm.

Although it was a dry month, as the precipitation pretty much all came down as snow, the total snowfall of 51.5 cm was higher than the average of 43.7 cm for the month.  This made it the snowiest January since 2013 when we had 54 cm.  Overall for the snowfall season we are at 97.0 cm, very close to the average of 95.3 cm for this point in the season.

Summary for January 2022:

Maximum Temperature 3.5°C
Minimum Temperature -32.4°C
Average Daily High Temperature -4.4°C (Long term average -2.6°C)
Average Daily Low Temperature -16.3°C (Long term average -10.3°C)
Total Precipitation 40.6 mm (Long term average 65.2 mm)

(Long term averages based on 1981-2010 data for the Waterloo-Wellington Airport)


Wednesday, January 5, 2022

2021 Summary

University of Waterloo Weather Station Annual Summary - 2021

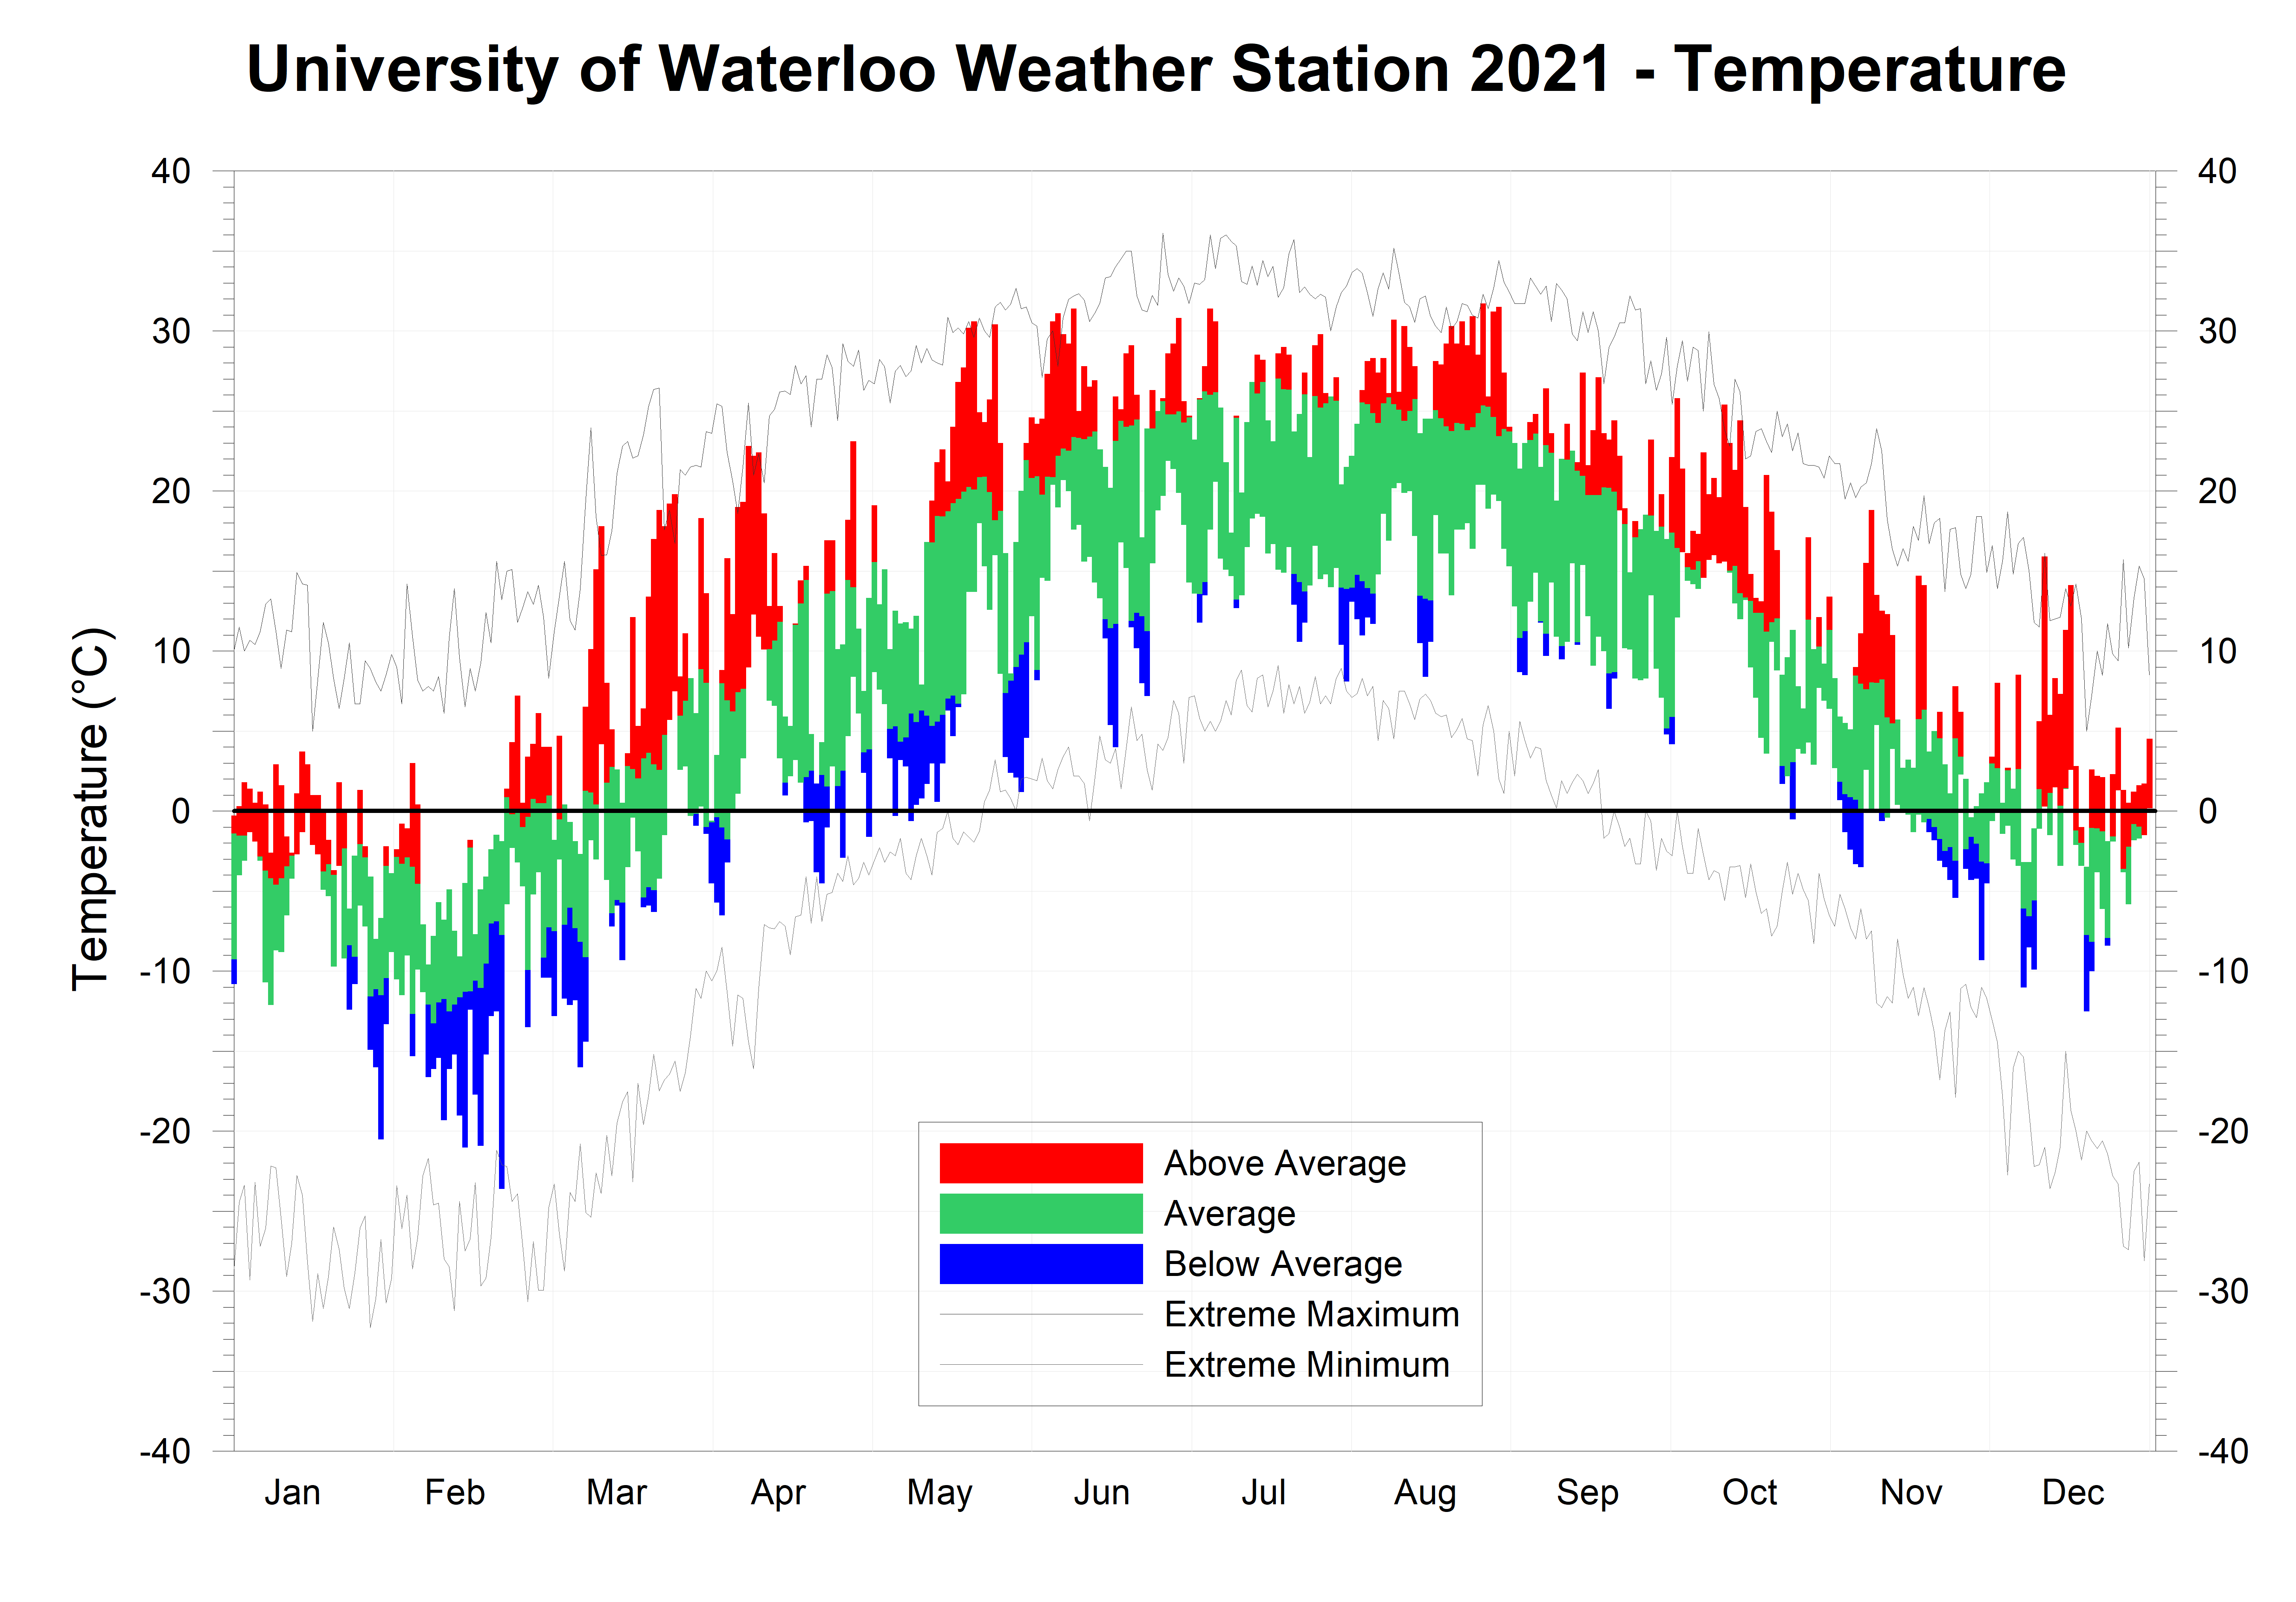
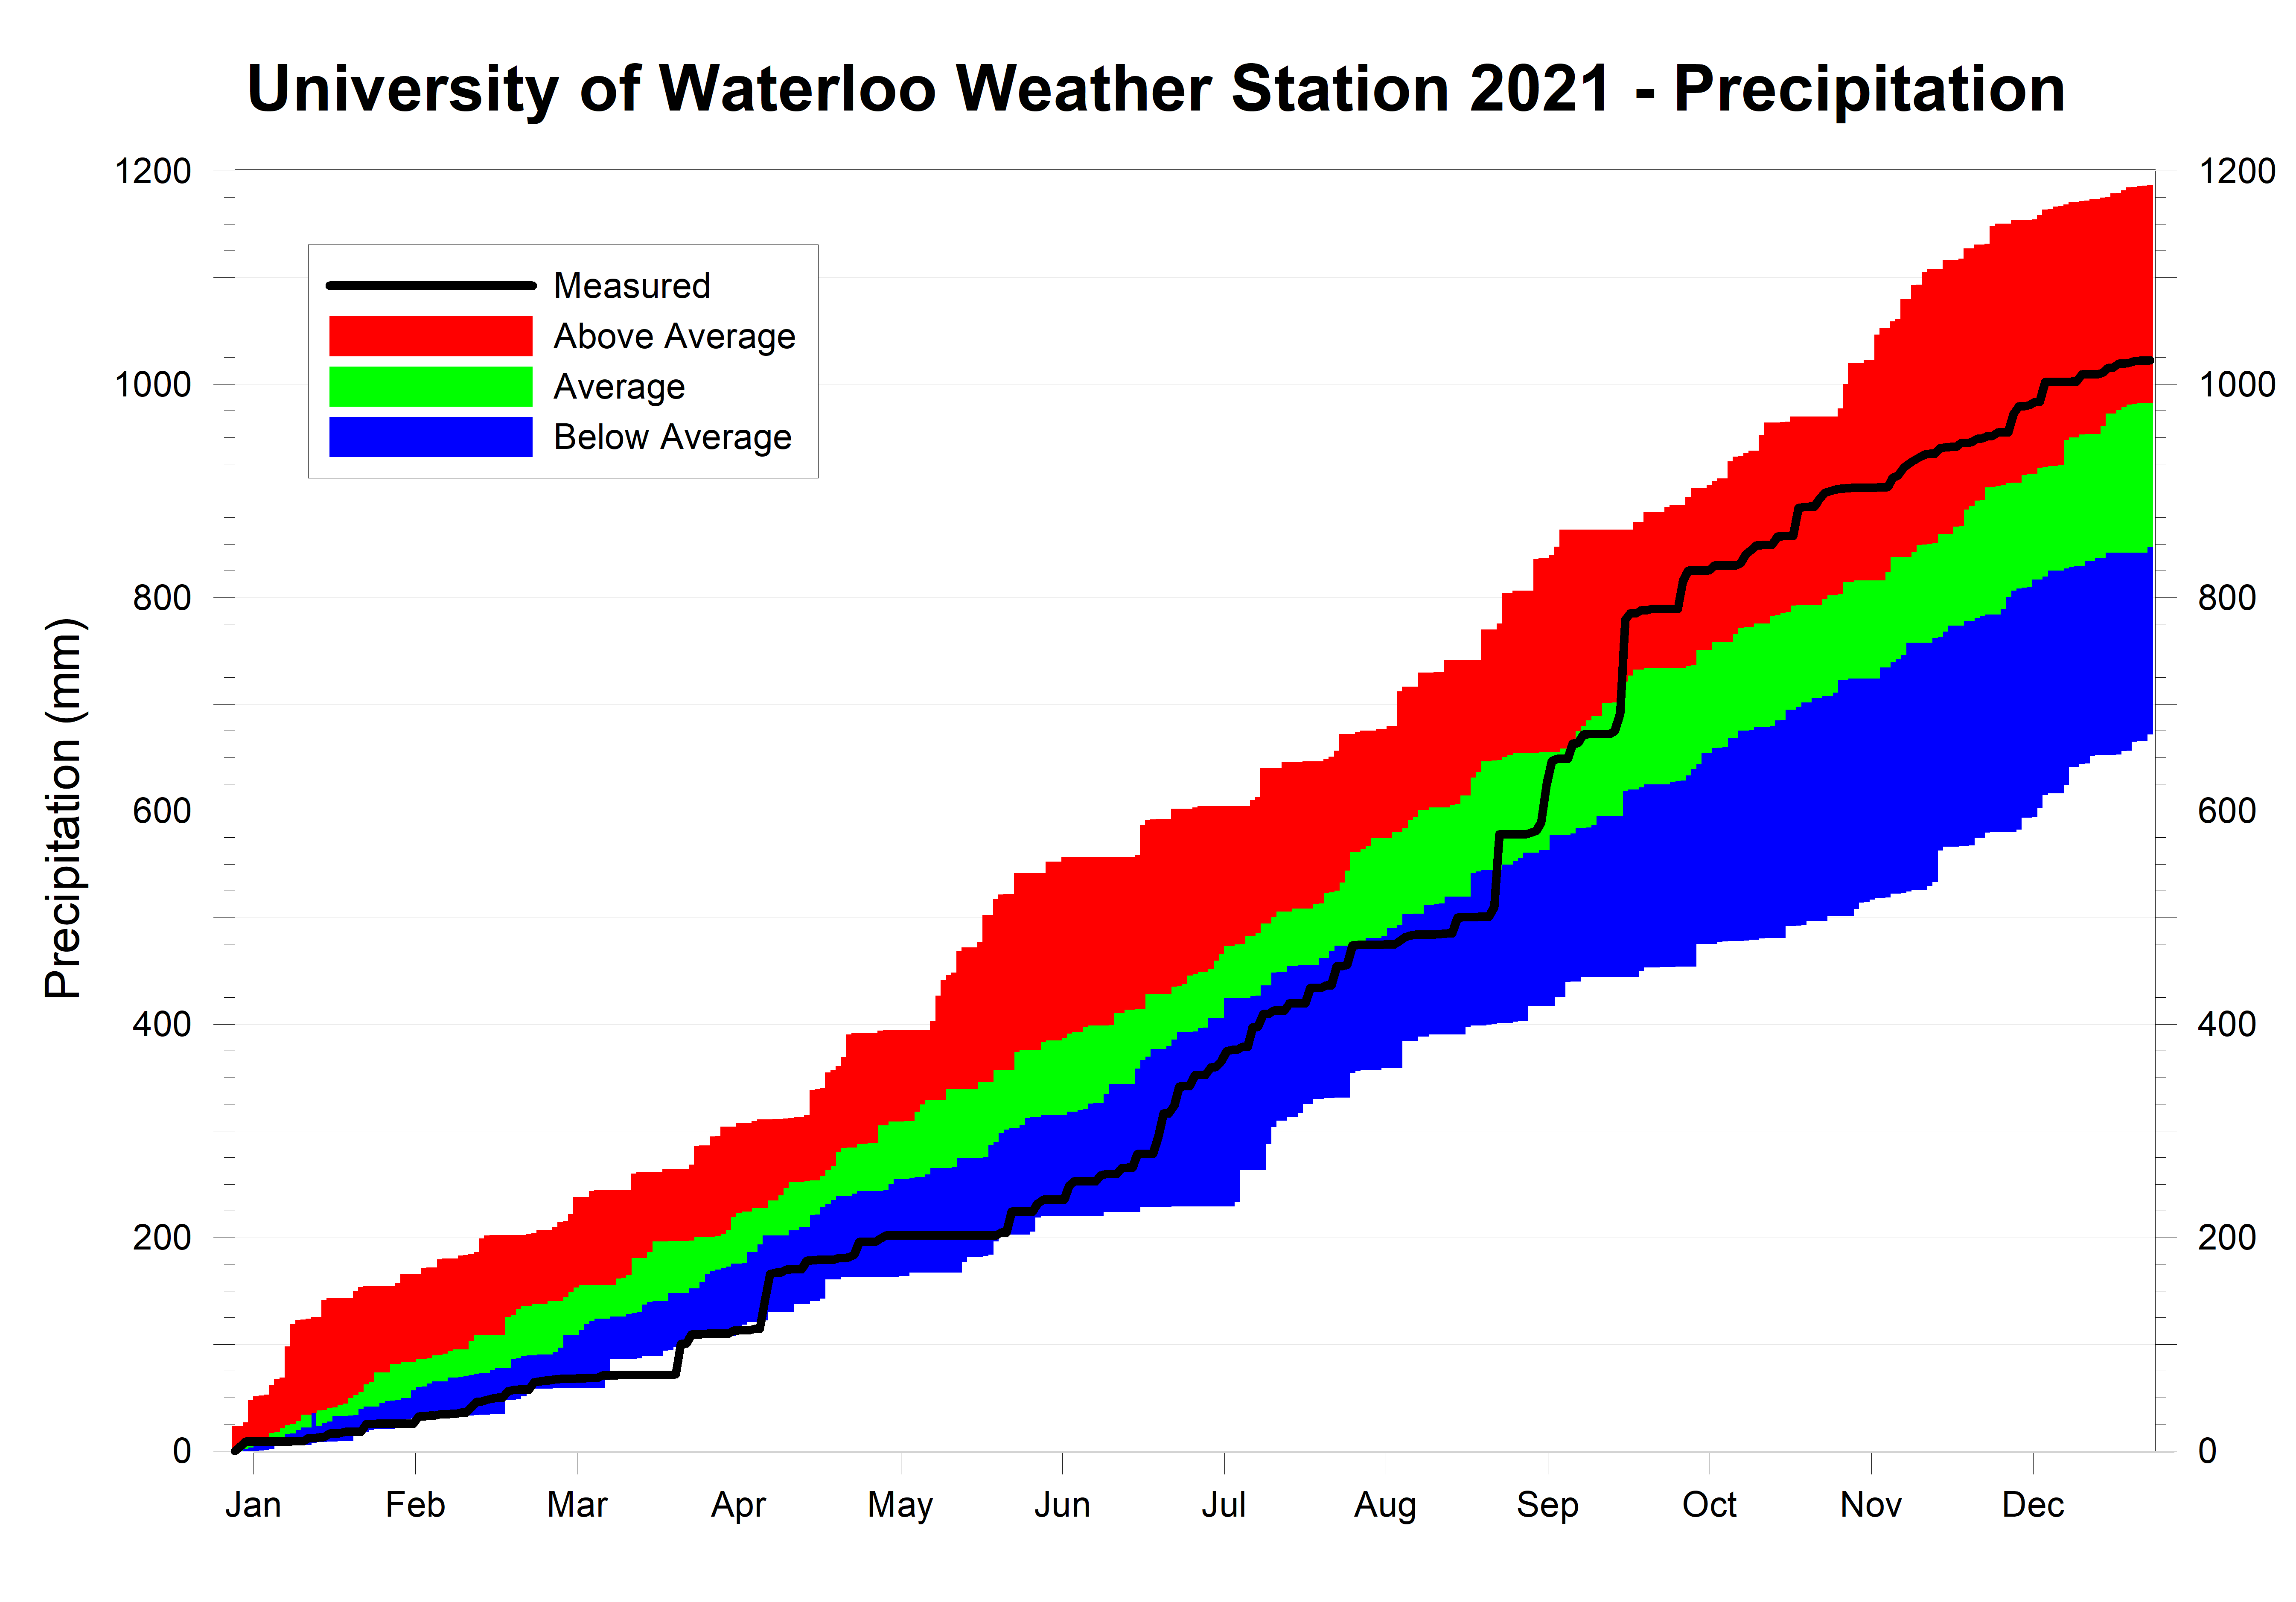
There were 2 big weather stories in 2021: how warm it was throughout the year and how wet it was in the second half of the year (punctuated by the highest 24 hour rainfall ever recorded at the station).

With only one month that was in the below average range and many that were well above average, it is not surprising that it was the third warmest since 1914, the year weather records began in the region.  The average annual temperature of 8.89°C was behind only 2012 (9.32°C) and 1998 (8.98°C).

As for precipitation, the first half of the year was about 20% drier than average, however, the second half was really, really, wet.  In fact, the period from June to October was the wettest on record for those 5 months, thanks in part to the incredible amount of rain that came down between September 21 and 22.  Starting at 9 pm Sept 21, we saw 93.4 mm in 24 hours, the highest 24-hour total ever recorded at the station (The previous record was 91.4 mm starting Jan 11, 2020 at 3 am).  This rain event contributed to September being the second wettest ever in the regional weather records.  The total precipitation for the year was 1021.5 mm, compared to the average of 916.3 mm.

Looking at the monthly temperatures, the year started off with January coming in a little over 2 degrees above average, followed by the only month that was significantly colder than average.  Overall, February was 2 degrees below average, mainly a result of a really cold 2-week period with multiple days when the temperature dipped down to nearly -20°C and barely reached -10°C during the day.

Then the heat returned.  We saw the warmest March since 2012, including a few days that almost reached 20°C, and an April that was 1.3 degrees above average.  The month of May featured a mix of hot and cold temperatures, resulting in an overall temperature that was just barely below average.

June started off with 4 days over 30°C early in the month and continued warm for the rest of the month.  In the end, the month’s temperature came in at 3 degrees above average, making it the 5th warmest June on record.  2021 was one of the rare years when July (that was pretty much average) ended up being cooler than August, which was the second warmest in the last 20 years at a little more than 3 degrees above average.

September continued the warm streak at 1.8 degrees above average.  Then came a very warm October when it was almost 5 degrees above average.    This was partly a result of 10 days with a temperature over 20°C; typically, October has only 3.5 days like that.  This made it the warmest October since 2007.  It also tied for the fourth warmest since records began in the region in 1914.  

November was close to average, and the year ended with a December that was almost three and a half degrees above average, making it the warmest December since 2006 and the fourth warmest on record.  Also, the high temperature of 15.9°C on the 11th was the fifth hottest December day on record.  The last time it was it was that hot in December was Dec 5, 2001 when the high was 16.7°C.

Frank Seglenieks
weather@uwaterloo.ca
University of Waterloo Weather Station Coordinator

Summary for 2021 (averages from 1981-2010 data for the Waterloo-Wellington Airport):

Average Daily High Temperature: 13.95°C (average 12.05ºC)
Average Daily Low Temperature: 3.82°C  (average 1.94ºC)
Total Precipitation: 1021.5 mm (average 916.3 mm) 

Extremes for 2021 (all time UW weather station extreme in brackets):

Highest temperature:
31.7°C Aug 26 4:00 pm (35.7 °C July 21, 2011 3:00 pm)

Highest humidex:
44.0 Aug 26 4:00 pm (47.6 July 17, 2013 5:00 pm)

Lowest temperature:
-23.6°C Feb 21 7:00 am (-35.5 °C Feb 16, 2015 7:00 am)

Lowest windchill:
-35.6 Jan 29 3:00 am (-47.3 Feb 15, 2015 6:15 am)

Greatest temperature drop in 15 minutes:
-7.9°C Sep 7 5:45 pm (-9.5 °C July 19, 2013 5:00 pm)

Greatest temperature drop in 60 minutes:
-9.6°C Sep 7 5:30-6:30 pm (-11.8 °C July 19, 2013 4:45-5:45 pm)

Greatest temperature rise in 15 minutes:
4.2°C Mar 22 6:00 am (8.6 °C Jan 2, 2001 6:15 am)

Greatest temperature rise in 60 minutes:
7.4°C Mar 22 5:45 - 6:45 am (12.2 °C Jan 2, 2001 4:45-5:45 am)

Highest precipitation in 15 minutes:
19.2 mm Aug 29 7:45-8:00 pm (24.8 mm Jul 10, 2020 6:45-7:00 pm)

Highest precipitation in 60 minutes:
48.4 mm Aug 29 7:15-8:15 pm (57.4 mm Aug 2, 2014 2:30-3:30 pm)

Highest Precipitation in 1 day:
88.0 mm Sep 22 (New record) 

Highest 15 minute average wind speed:
26.4 km/h Dec 16 11:15 am (44.6 km/h Mar 9, 2002 6:30 pm)

Highest wind gust (only available since 2015):
40.6 km/h Dec 16 11:15 pm (44.4 km/h Apr 13, 2015 2:30 pm)

Last time the temperature went below 0 before the summer:
May 9 6:00 am (Has ranged between Apr 26- May 23)

First time the temperature went below 0 after the summer:
Oct 24 8:00 am (Has ranged between Sep 19 - Oct 29)

Length of frost-free season:
168 Days (Has ranged between 129-175 days)

Highest daily low temperature:
21.9°C Jun 27 (25.3 °C Aug 1, 2006)

Lowest daily high temperature:
-9.6°C Feb 7 (-20.6 °C Feb 15, 2015)

Largest daily temperature range:
23.3°C Mar 21 (29.6 °C Feb 19, 2007)

Smallest daily temperature range:
1.60°C Jan 12 (0.45 °C Dec 7, 2005)


Click on the image below to see the temperature chart:


Click on the image below to see the precipitation chart:


Monday, January 3, 2022

December 2021 Summary

A very warm December with average precipitation

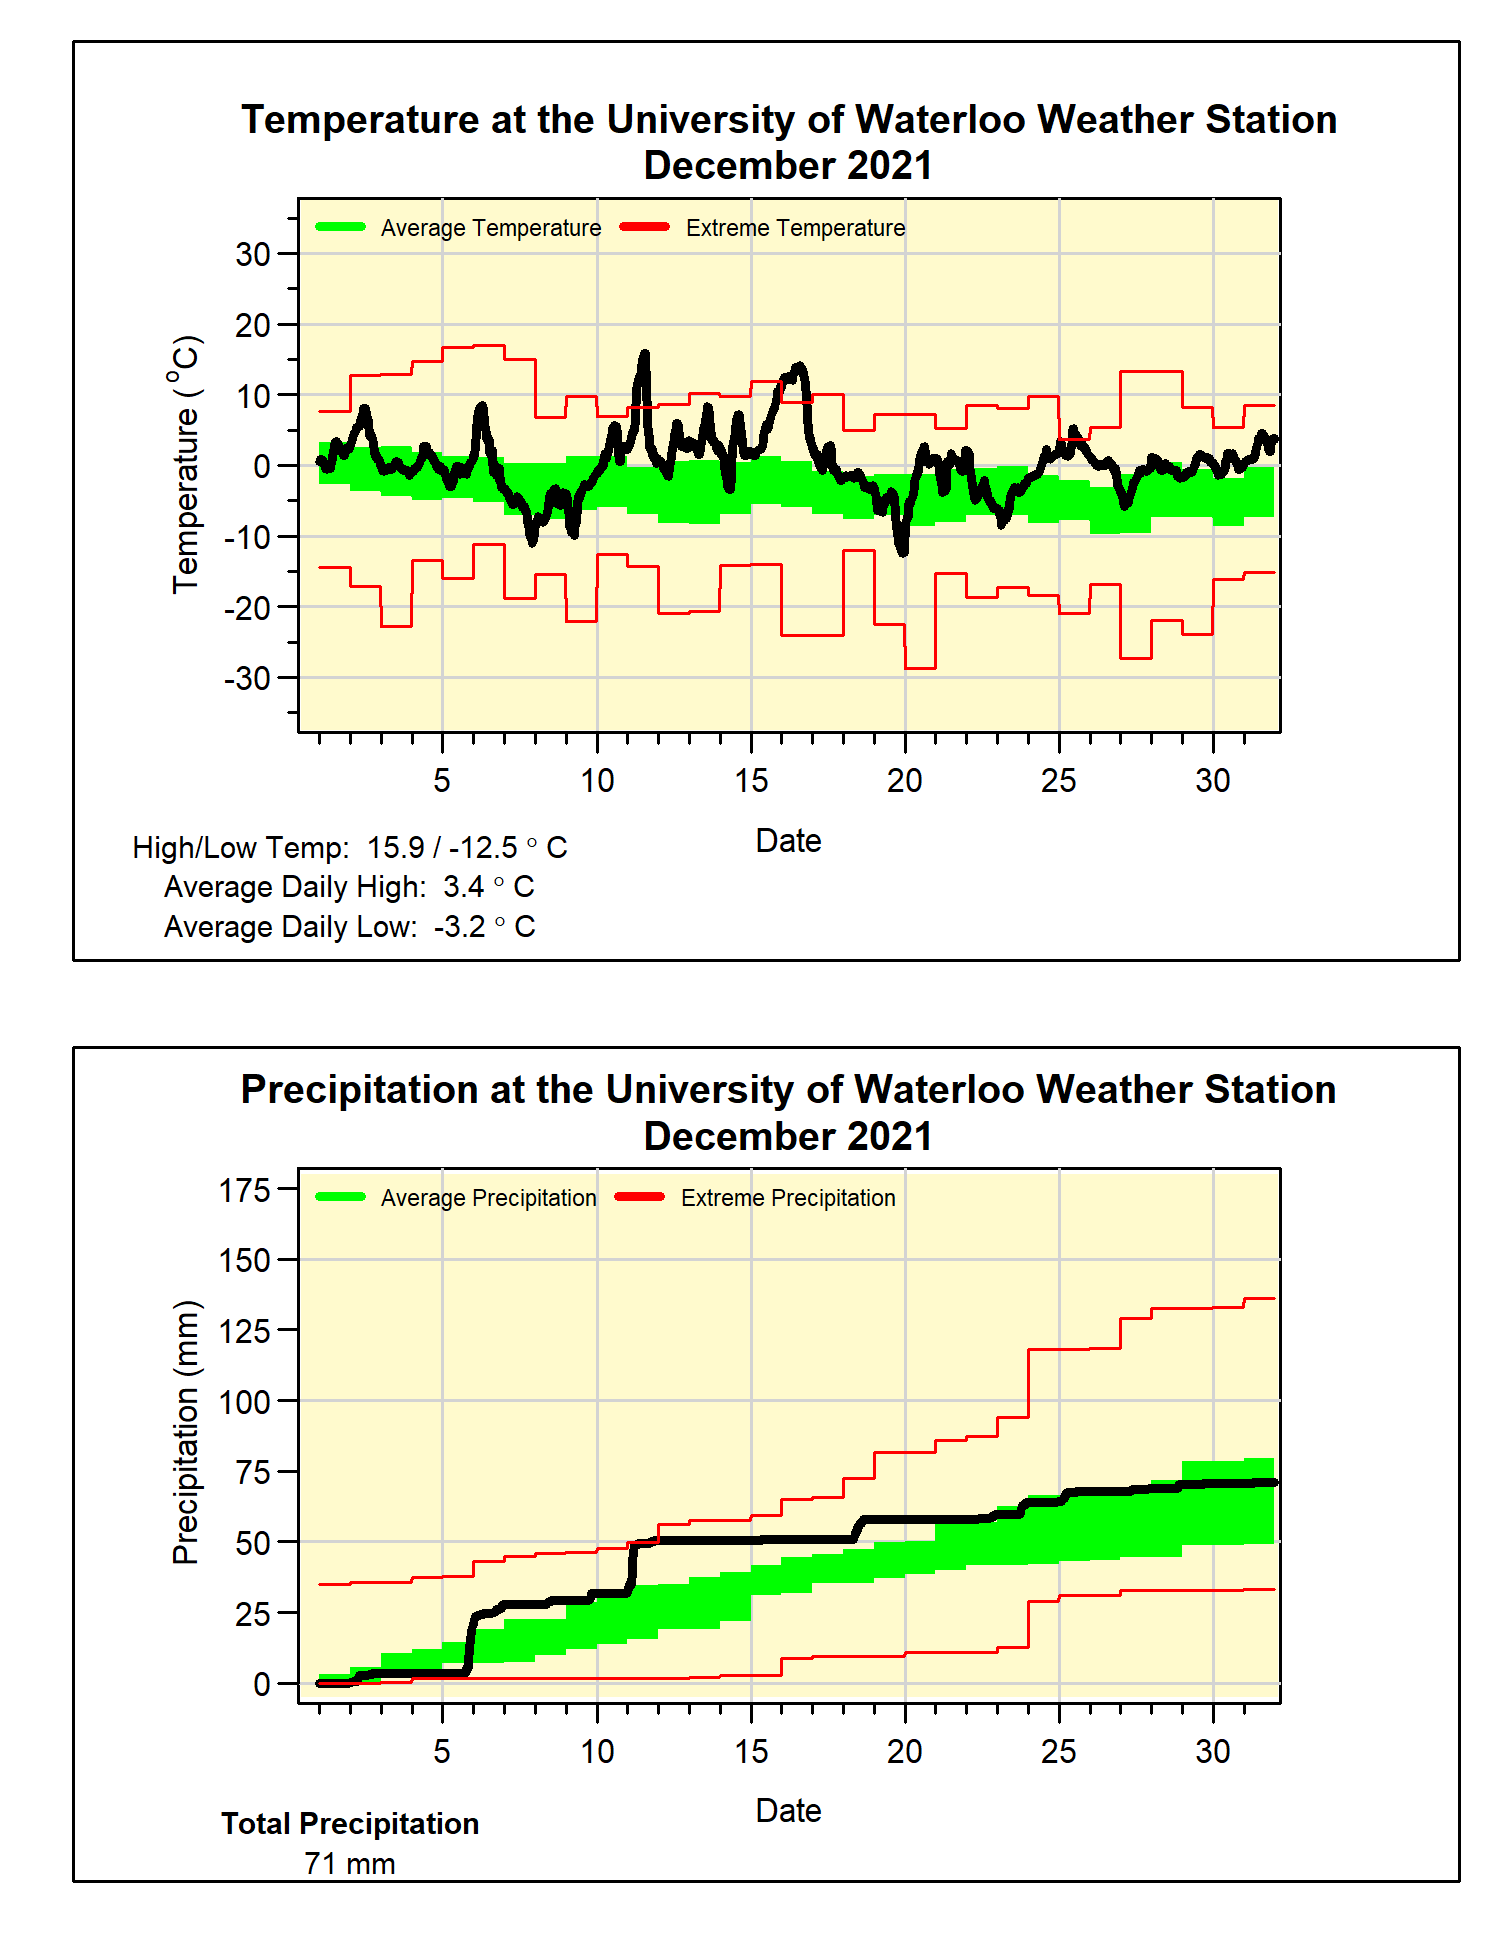
With only 5 colder than average days and lots of warm ones, December was 3.4 degrees above average.  This made it the warmest since 2006 and the fourth warmest since records began in the region a little over 100 years ago.  The high temperature of 15.9°C on the 11th was the fifth hottest December day on record, and the last time it was it was that hot in December was Dec 5, 2001 when it was 16.7°C.

It was pretty wet the first half of the month, but then dried out for the second half.  This resulted in a total precipitation of 71.0 mm, which is almost exactly the average of 71.2 mm.  However, the warm temperatures results in only 28.9 cm of snow compared to the average of 37.2 cm for December.

Summary for December 2021:
Maximum Temperature 15.9°C
Minimum Temperature -12.5°C
Average Daily High Temperature 3.4°C (Long term average 0.2°C)
Average Daily Low Temperature -3.2°C (Long term average -6.8°C)
Total Precipitation 71.0 mm (Long term average 71.2 mm)

(Long term averages based on 1981-2010 data for the Waterloo-Wellington Airport)


Thursday, December 2, 2021

November 2021 Summary

A dry November with average temperature

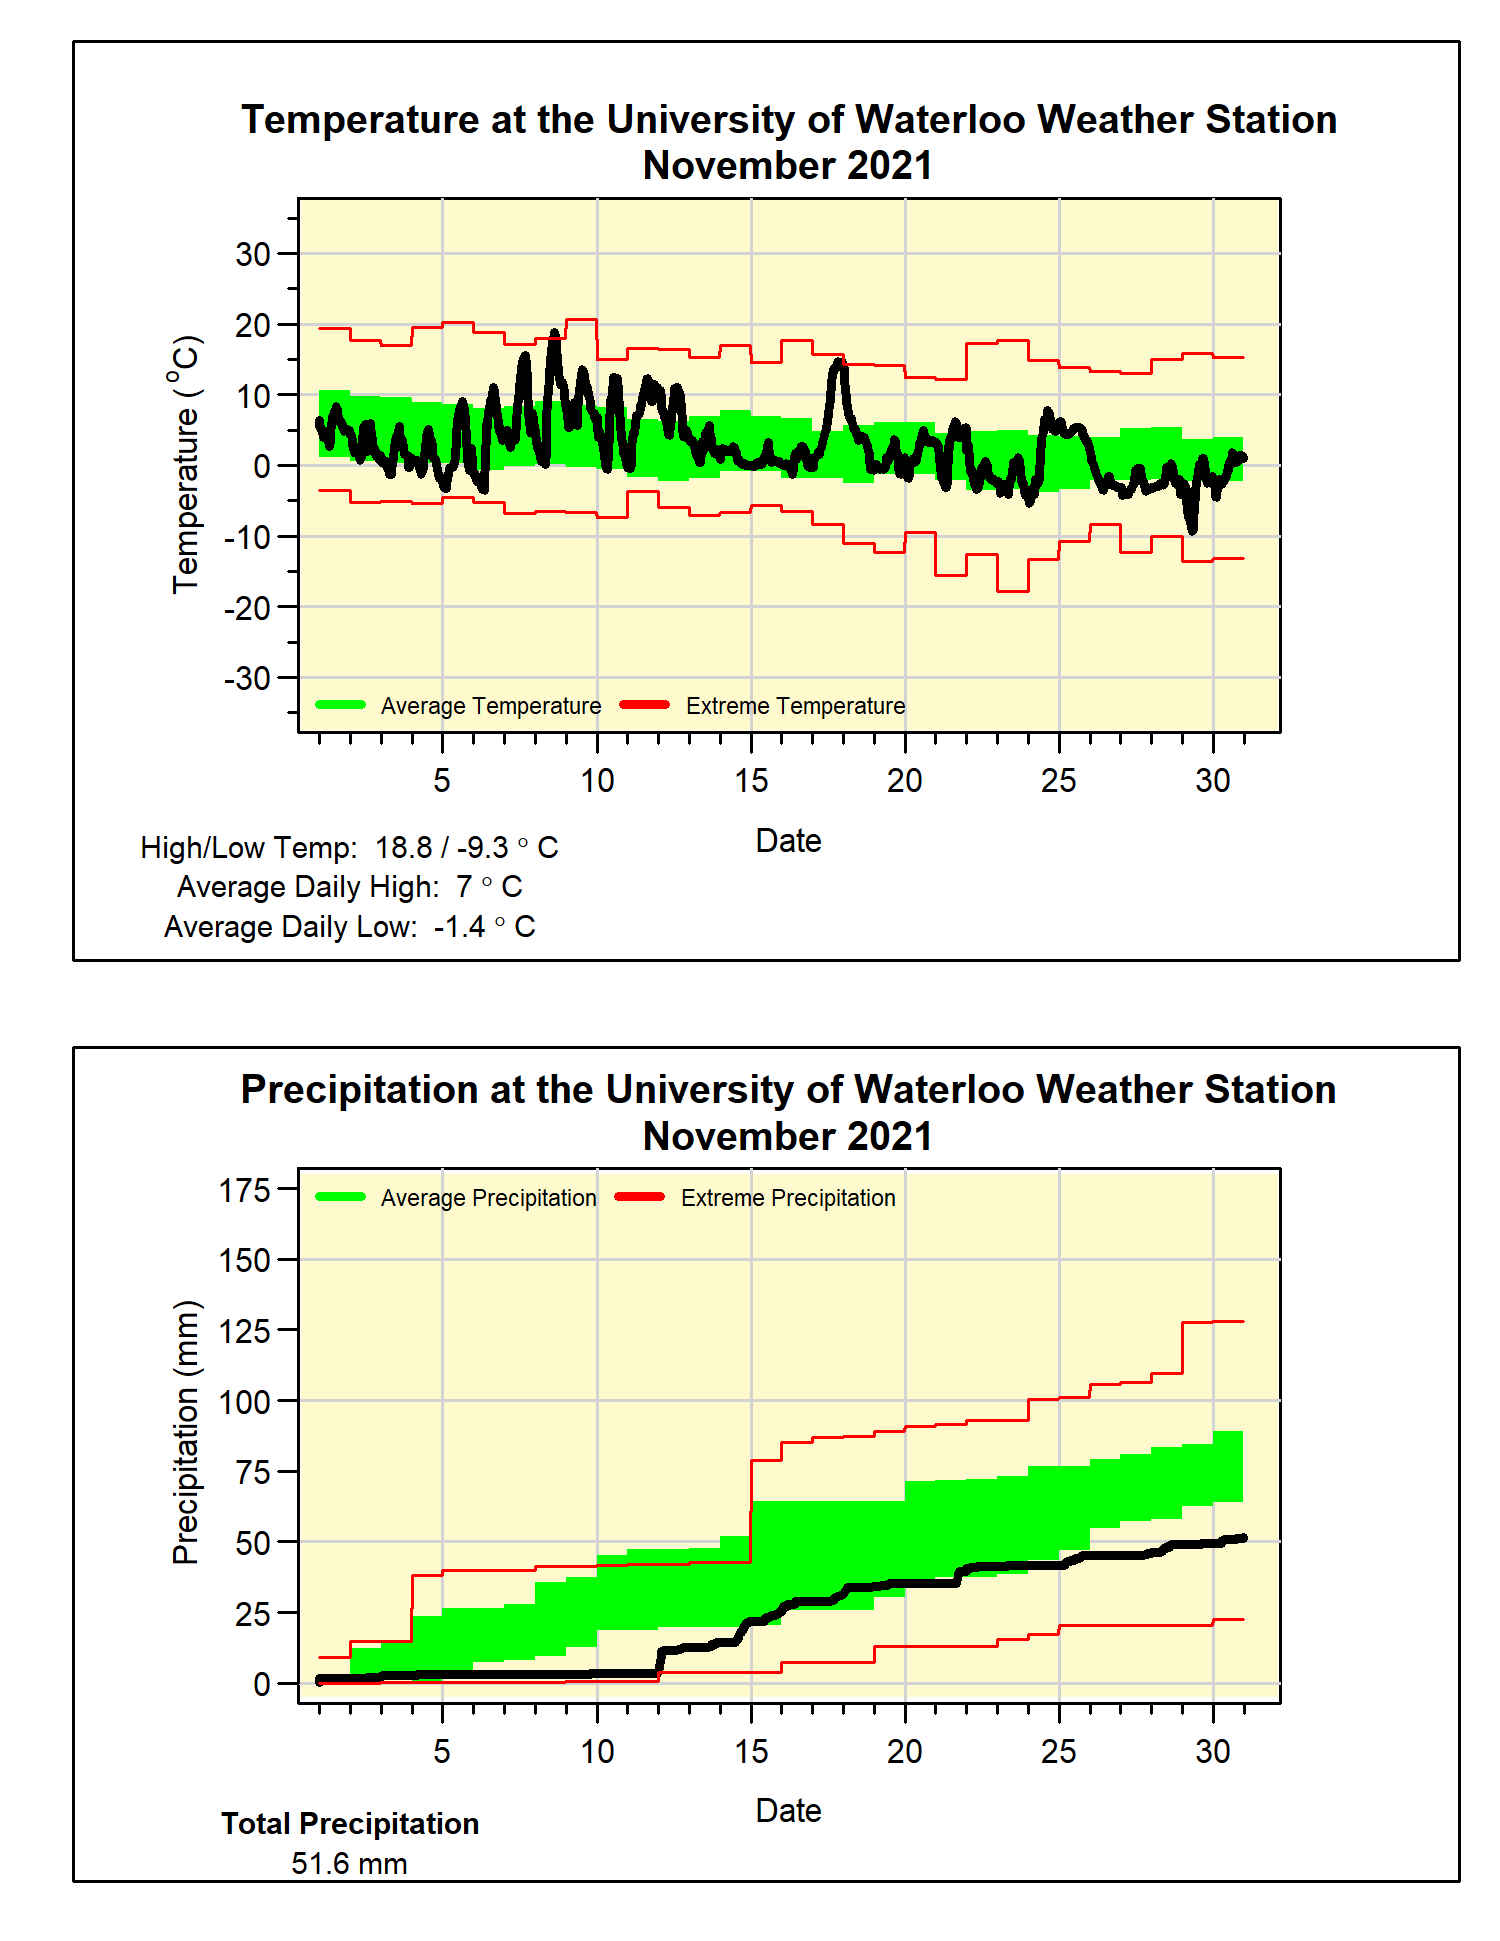
Not really that much to say about the temperature during the month of November.   Although there were a few warm days, these were offset by many days that were a few degrees cooler than average.  Put all that together and you get an overall temperature 0.4 degrees above average, but still within the average range.

The precipitation didn’t really start until almost 2 weeks into the month, and even after that there were no days with over 10 mm of precipitation.  This resulted in the total precipitation of 51.6 mm being well below the average of 87.1 mm, and the direst November in the last 8 years.

Even with this dry month, the total precipitation of 950.5 mm remains well above the average for this time of year of 832.9 mm.  While the total snowfall of 17.5 cm was a bit more than the average of 13 cm for November.

Summary for November 2021:
Maximum Temperature 18.8°C
Minimum Temperature -9.3°C
Average Daily High Temperature 7.0°C (Long term average 6.3°C)
Average Daily Low Temperature -1.4°C (Long term average -1.4°C)
Total Precipitation 51.6 mm (Long term average 87.1 mm)

(Long term averages based on 1981-2010 data for the Waterloo-Wellington Airport)


Tuesday, November 2, 2021

October 2021 Summary

The fourth warmest October in the region with above average precipitation

The first half of the month was very warm, with some days having a low temperature above the average high for those days.  Even when it cooled down in the second half of the month, the temperatures just went down to the average.  There were 10 days with a temperature over 20°C where typically there are only 3.5 days like that.

The overall temperature was 4.8 degrees above average, making it the warmest October since 2007 and tied for the fourth warmest since records began in the region in 1914.  At 8 am on October 24th the temperature went below zero for the first time since the spring, which is about 7-10 days later than the average.

October started off wet in the first few days of the month, it continued to be wet throughout the month with storms every few days.  The final total of 110.6 mm was well above the average of 67.4 mm.

This wetter than average month resulted in the total precipitation since January (898.9 mm) getting even more above the average for this time of year (750.6 mm).

Summary for October 2021:

Maximum Temperature 25.8°C
Minimum Temperature -0.5°C
Average Daily High Temperature 16.7°C (Long term average 13.5°C)
Average Daily Low Temperature 9.3°C (Long term average 2.9°C)
Total Precipitation 110.6 mm (Long term average 67.4 mm)

(Long term averages based on 1981-2010 data for the Waterloo-Wellington Airport)