A wet, warm, and “dreary” January
There were four cold
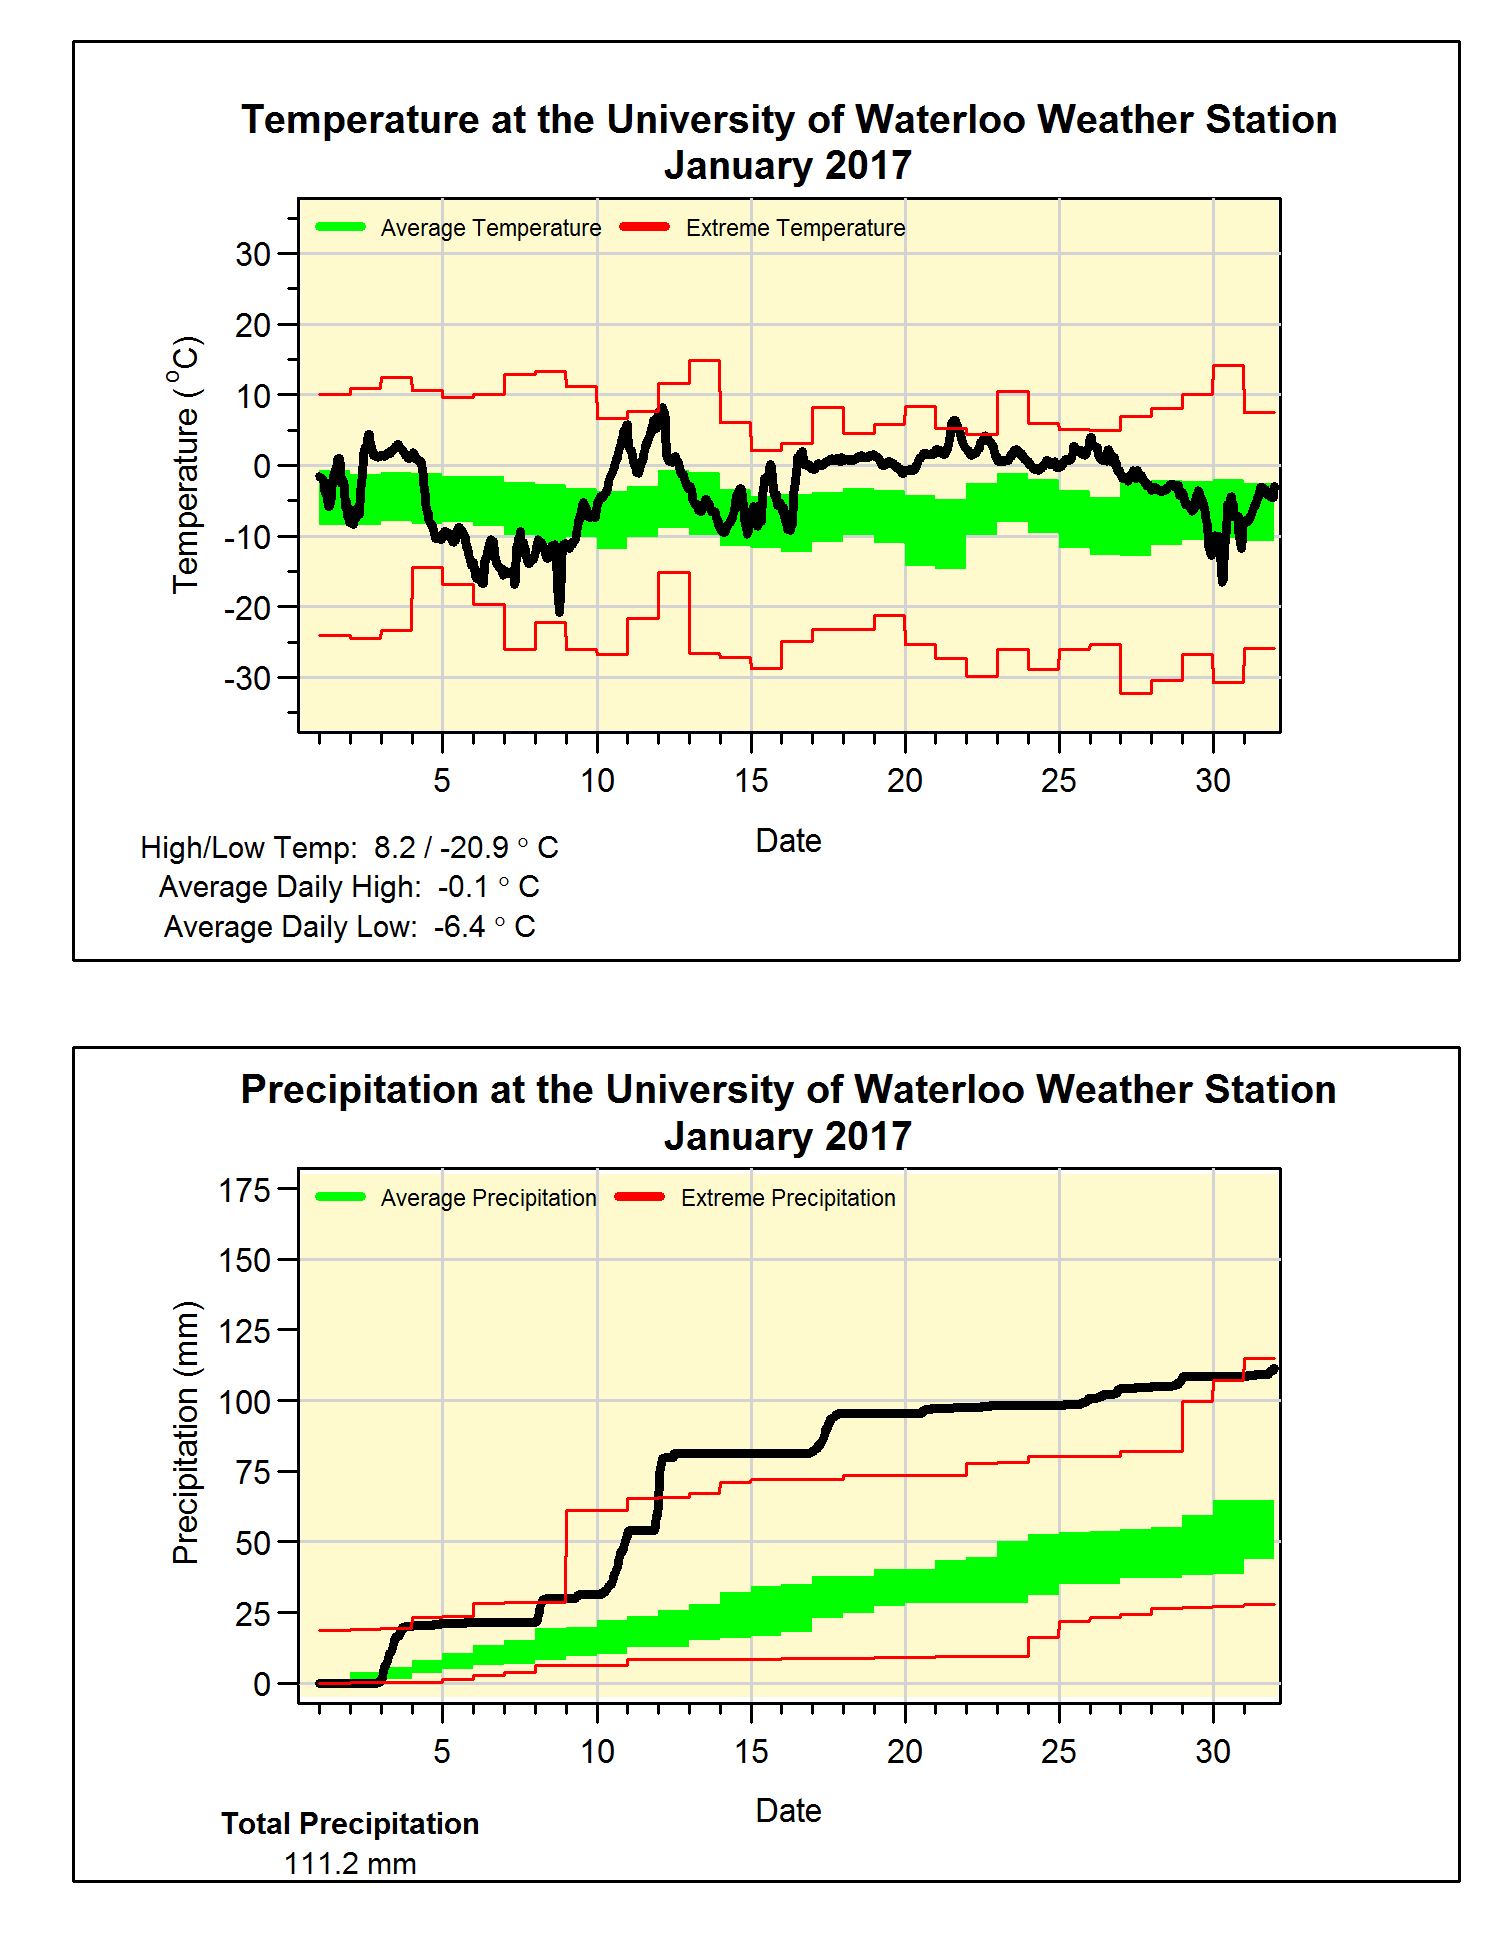
days in the first part of the month, but that was about it for the really cold
weather. As well as a few days in the high
single digits we also saw 12 days in a row above zero, which is something that
we haven’t seen in January since 1944.
Put that all that together and it is not surprising that overall it was
over 3 degrees above average, making it the warmest January since 2006.
With the 111.2 mm of
precipitation in the month it was the second highest total in the last 18 years
(2013 had a bit more with 114.7 mm), while most of it (81.4 mm) fell during the
very wet first half of the month. Of
that precipitation there was only 20 cm of snow, less than half of the average
of 43.7 cm.
Then we get to the “dreary” question. The background is that at the UW weather
station we measure the amount of incoming solar radiation, which is correlated
to the number of hours of sunshine but not technically exactly the same thing. Also keep in mind that this is the only source
of this kind of data in the area, so records only go back to the start of the
weather station in 1998, unlike precipitation and temperature which have
records going back to 1915.
So based on what we measure, the overall average of 47 Watts
per square metre of incoming solar radiation was the lowest January value in
the history of the station and much lower than the average of 81.7 W/m2. Also I made an arbitrary and non-scientific criteria
that if a day never had a reading of over 200 W/m2 then it was a “dreary”
day. Using this, the number of dreary
days we had was 13 this January putting it well above the average of 7.5 and
again the most we have seen in that past 19 years.
Summary for January 2017:
Maximum Temperature 8.2°C
Minimum Temperature -20.9°C
Average Daily High Temperature -0.1°C (Long term average
-2.6°C)
Average Daily Low Temperature -6.4°C (Long term average -10.3°C)
Total Precipitation 111.2 mm (Long term average 65.2 mm)


