Saturday, December 3, 2022

November 2022 Summary

A warm and dry November

It was a tale of two parts of the month in terms of temperature, the first 12 days had an average high of 16.4°C while for the rest of the month the average was only 3.7°C.  That first part was warm enough that the overall temperature was 1.8 degrees above average, which made it the most above average of any month this year.

It was also dry during that first half of the month, with only 15 mm in the first 15 days.  Although it was a bit wetter in the second half the total only got to 48.6 mm, a lot less than the average of 87.1 mm, and the driest November in the last 10 years.

The total precipitation for the year of 507.3 mm is well below the average of 832.9 mm.  This is now the fourth driest first 11 months of the year in the history of records in the region, which go back to 1917.

The total snowfall of 16.5 cm was a bit more than the average of 13 cm for November.

Summary for November 2022:

Maximum Temperature 23.4°C
Minimum Temperature -9.1°C
Average Daily High Temperature 8.7°C (Long term average 6.3°C)
Average Daily Low Temperature -0.3°C (Long term average -1.4°C)
Total Precipitation 48.6 mm (Long term average 87.1 mm)

(Long term averages based on 1981-2010 data for the Waterloo-Wellington Airport)


Sunday, November 6, 2022

October 2022 Summary

The driest October in 14 years with average temperatures

With clear nights, it was one of those months where the daytime highs were almost 2 degrees above average but the nighttime lows were over half a degree below average.  Put that together and it comes out to an overall average of 0.7 degrees above average, keeping it just within the average range.

During the morning of October 2nd the temperature went below zero for the first time since the spring.  This is almost 2 weeks earlier than the average and ties 2003 for the earliest we have seen at the UW Weather Station.

With no precipitation for the first 11 days of the month, it is not surprising that the total for the month only got to 49.8 mm, which is below the average of 67.4 mm.  This made it the driest since 2008 when we saw 45.0 mm.

Another dry month resulted in the total precipitation since January (458.7 mm) getting even more below the average for this time of year (750.6 mm).  This is now the fourth driest first 10 months of the year that we have seen in the over 100 years of weather records in the region.

Summary for October 2022:

Maximum Temperature 24.3°C
Minimum Temperature -3.1°C
Average Daily High Temperature 15.4°C (Long term average 13.5°C)
Average Daily Low Temperature 2.3°C (Long term average 2.9°C)
Total Precipitation 49.8 mm (Long term average 67.4 mm)

(Long term averages based on 1981-2010 data for the Waterloo-Wellington Airport)


Monday, October 3, 2022

September 2022 Summary

A warm and very dry September

Although it cooled down the last week of the month, the rest of the month was very warm with even a couple of days above 30°C (we usually only see one of those every 2 years).  This resulted in an overall average temperature almost 1.5 degrees above average.

With only 22.2 mm of precipitation during this was the fourth driest September in the weather records in the region which go back to 1914.

This very dry month put the total for the year of 408.9 mm even more below the average of 683.5 mm.

Summary for September 2022:

Maximum Temperature 31.1°C
Minimum Temperature 0.4°C
Average Daily High Temperature 22.7°C (Long term average 20.4°C)
Average Daily Low Temperature 9.1°C (Long term average 8.6°C)
Total Precipitation 22.2 mm (Long term average 87.8 mm)

(Long term averages based on 1981-2010 data for the Waterloo-Wellington Airport)


Thursday, September 15, 2022

August 2022 Summary

A hot month that completed the second driest summer on record

After 2 months that were colder than average, the month of August came in a bit more than 1 degree higher than average.  This is not surprising with 5 days above 30°C compared to the average of only 2 and only a few very cold days.

We only received 44.8 mm of precipitation, which is just a little more than half the average of 83.9 mm.  This made it the driest August since 2010 and put the total precipitation so far in 2022 of 386.7 mm closer to the average of 596.0 mm.  This is the sixth driest first 8 months of the year that we have seen in the region.

The total precipitation for this year’s meteorological summer (June, July, and August) was 112.1 mm.  This is the second lowest total precipitation for these months in the over 100 year history of records in the region, the only drier summer was in 2007 when there was only 74.5 mm.


Summary for August 2022:

Maximum Temperature 31.5°C
Minimum Temperature 6.4°C
Average Daily High Temperature 27.3°C (Long term average 24.8°C)
Average Daily Low Temperature 12.5°C (Long term average 12.9°C)
Total Precipitation 44.8 mm (Long term average 83.9 mm)

(Long term averages based on 1981-2010 data for the Waterloo-Wellington Airport)

Sunday, August 7, 2022

July 2022 Summary

The fifth driest July ever recorded in the region and the driest since 2001

**Note that the UW Weather Station’s main controller stopped working at the end of January, we have received a replacement and are currently setting it up, the data for this month’s summary comes from readings taken at the Waterloo Regional Airport**

For the second month in a row, the much above average daytime temperatures were balanced out by the much below average nighttime temperatures.  The result was an overall temperature that was just 0.1 degrees below average, which is within the average range.  

Although there were 8 days at or above 30°C compared to an average of 3.6, including 6 of them in a row, it was still the coolest July since 2014.  

As always, the lawns and gardens around town showed just how dry it was during the month.  With only 18.7 mm of total precipitation, it was the fifth driest July in the region since began over 100 years ago (with a special shout out to 1916 when only 1.8 mm was recorded, although the 3rd day of the month was missing) and the driest since 2001.

Also, there was some talk during the month about storm systems which came through Southern Ontario that would split or fade out before hitting Waterloo region.  Well according to the map below of the precipitation anomaly from Environment and Climate Change Canada for July, there is a bulls-eye of brown indicating that our region was the most below average in all of Southern Ontario.  So maybe it wasn’t just our imagination.

The very dry month put the total for the year of 341.9 mm now even further below the average of 509.0 mm.


Summary for July 2022:

Maximum Temperature 33.6°C
Minimum Temperature 7.1°C
Average Daily High Temperature 27.8°C (Long term average 26.0°C)
Average Daily Low Temperature 12.1°C (Long term average 14.0°C)
Total Precipitation 18.7 mm (Long term average 98.6 mm)

(Long term averages based on 1981-2010 data for the Waterloo-Wellington Airport)


Sunday, July 10, 2022

June 2022 Summary

A dry June with average temperature 

**Note that the UW Weather Station’s main controller stopped working at the end of January, we have received a replacement and are currently setting it up, the data for this month’s summary comes from readings taken at the Waterloo Regional Airport**

 With 6 days above 30°C compared to the average of only 2 and a high of 34.1°C on the 21st, it might be assumed that it was a much hotter than average month.  Although that was true for the daily high values (1.3 degrees above average), the daily low temperature were very much below average (by 2.3 degrees).  Overall, the temperature was half a degree below average which still keeps it in the average range.  

Just a little more on that 34.1°C high on the 21st, that was the highest temperature since the 34.5°C on July 9, 2020 and it was also the highest June temperature since June 27, 2005 when it was 34.9°C.

About half the precipitation for the month fell in the first week, followed by almost 2 weeks of no rain.  At just 48.6 mm of total precipitation it was the driest June since 2007.

As there has only been one above average month of precipitation this year (February) it isn’t surprising that the total precipitation we have seen in the first half of the year of 323.2 mm is well below the average total of 416.1 mm.

Summary for June 2022:

Maximum Temperature 34.1°C
Minimum Temperature 3.8°C
Average Daily High Temperature 24.9°C (Long term average 23.6°C)
Average Daily Low Temperature 9.2°C (Long term average 11.5°C)
Total Precipitation 48.6 mm (Long term average 82.4 mm)

(Long term averages based on 1981-2010 data for the Waterloo-Wellington Airport)


Saturday, June 4, 2022

May 2022 Summary

A hot and dry May 

**Note that the UW Weather Station’s main controller stopped working at the end of January, while we are waiting for a replacement, the data for this month’s summary comes from readings taken at the Waterloo Regional Airport**

After the first week, which was close to average, the rest of the month was mostly well above average including 5 days above 25°C from the 11th to the 15th and the first day over 30°C on the last day of the month.  Overall it was 1.3 degrees above average, making it the warmest May since 2018.

Assuming we have seen the last below zero temperature until the fall, the last freezing day was May 8th, this is just a day later than the average in the last 20 years.  

It was dry for most of the month, including a 10 day period with no measured precipitation.  With only 2 days that had more than 10 mm of rain, it is not surprising that at 60.6 mm the total precipitation was well below the average of 82.3 mm.

This dry month puts the total for the year so far at 274.6 mm, well below the average of 340.2 mm.

Summary for May 2022:
Maximum Temperature 31.1°C
Minimum Temperature -1.7°C
Average Daily High Temperature 20.6°C (Long term average 18.5°C)
Average Daily Low Temperature 6.9°C (Long term average 6.4°C)
Total Precipitation 60.6 mm (Long term average 82.3 mm)

(Long term averages based on 1981-2010 data for the Waterloo-Wellington Airport)


Tuesday, May 3, 2022

April 2022 Summary

A cold and dry April 

**Note that the UW Weather Station’s main controller stopped working at the end of January, while we are waiting for a replacement, the data for this month’s summary comes from readings taken at the Waterloo Regional Airport**

As is typical during the Spring, the temperature we saw during April was a bit of a roller coaster ride from low single digit to mid-20 highs.  The high of 25.9°C on the 24th was the second highest April temperature in the last 10 years.  However, overall the temperature was almost a degree below average, putting it in the below average range.

The little precipitation we had during April was spread pretty evenly over the month.  The maximum daily precipitation of 11.4 mm on the 21st was the (stay with me here) lowest maximum daily precipitation in the last 10 years.  It stands to reason then that the total precipitation of 42.8 mm was well below the average of 74.5 mm and in the below average range.

This dry month brings the total of the year (214.0 mm) to much less than the average at this time of year (264.4 mm).

The total snowfall that came down during the month of 7.0 cm was very close to the average of 7.3 cm.  This put the total for the snowfall season at 176.5 cm, well above the average of 159.7 cm and perhaps this is the last time I’ll mention snow until the Fall (or did I just jinx it).

Summary for April 2022:

Maximum Temperature 25.9°C
Minimum Temperature -5.9°C
Average Daily High Temperature 10.9°C (Long term average 11.5°C)
Average Daily Low Temperature -0.5°C (Long term average 0.8°C)
Total Precipitation 42.8 mm (Long term average 74.5 mm)

(Long term averages based on 1981-2010 data for the Waterloo-Wellington Airport)


Friday, April 1, 2022

March 2022 Summary

An average March for both temperature and precipitation

**Note that the UW Weather Station’s main controller stopped working at the end of January, while we are waiting for a replacement, the data for this month’s summary comes from readings taken at the Waterloo Regional Airport**

It was a roller coaster ride for the temperature throughout the month with warm and cold periods at different times.  The cold temperatures at the beginning and end of the month were offset by a warm week in the middle.  The overall temperature was 0.6 degrees above average which is still within the average range.

The precipitation was scattered pretty evenly throughout the month, with the highest single day coming in at 19.7 mm.  The total of 52.2 mm was less than the average of 61.0 mm, but like the temperature it was within the average range.  The total precipitation so far this year of 171.2 mm is only a little bit less than the average of 187.6 mm.

The amount of snowfall we got this March of 21.0 cm was a bit less than the 26.5 cm of snow that we get on average.  The puts the total for the snowfall season at 169.5 cm, so we have already had more than the average for a typical season of 159.7 cm.

Summary for March 2022:

Maximum Temperature 19.4°C
Minimum Temperature -16.8°C
Average Daily High Temperature 4.4°C (Long term average 3.6°C)
Average Daily Low Temperature -5.3°C (Long term average -5.6°C)
Total Precipitation 52.2 mm (Long term average 61.0 mm)

(Long term averages based on 1981-2010 data for the Waterloo-Wellington Airport)


Thursday, March 3, 2022

February 2022 Summary

A cold February with lots of precipitation

**Note that the UW Weather Station’s main controller stopped working at the end of January, while we are waiting for a replacement, the data for this month’s summary comes from readings taken at the Waterloo Regional Airport**

Even with a couple of sets of warm days, the number of really cold days (and particularly some very cold nights) put the overall temperature at 1.2 degrees colder than average.  After a cold January, it was the first time we saw 2 colder than average months in a row since mid-2020.

February is typically the month with the lowest precipitation, but this year it was pretty wet.  The total of 78.4 mm was well above the average of 54.9 mm, making it the wettest in the past 5 years.

A few big storms during the month resulted in a snowfall total of 51.5 cm, well above the average of 30.3 cm for February.  As well, it is not just your imagination, there has been lots of snow so far this year.  The total since the Fall is now 148.5 cm, which is more than the average of 125.6 cm for this point in the snowfall season.

Summary for February 2022:

Maximum Temperature 8.1°C
Minimum Temperature -25.0°C
Average Daily High Temperature -1.4°C (Long term average -1.2°C)
Average Daily Low Temperature -11.9°C (Long term average -9.7°C)
Total Precipitation 78.4 mm (Long term average 54.9 mm)

(Long term averages based on 1981-2010 data for the Waterloo-Wellington Airport)


Thursday, February 3, 2022

January 2022 Summary

A cold and dry January 

It was a very cold month, with an overall temperature that was almost 4 degrees below average.  This January was tied with 2014, so you have to go back even further to 2009 to find one that was colder.  It might have felt even more frigid as it was close to 6 degrees below last year and 8 degrees colder than the year before.  The freezing temperatures were sustained as it didn’t go above zero during the last half of the month.  

The low temperature of -32.4°C on the 29th was the second lowest temperature we have ever seen since the UW Weather station was established back in February of 1998.  The all-time low was -35.5°C on Feb 16, 2015.

Apart from the one storm that came through on the 17th (more about that later), it was pretty dry for the rest of the month.  The final total of 40.6 mm was below the average range.

About that storm on the 17th, it was probably the second or third highest snowfall total since we started measuring daily snowfall at the station in 2001.  What makes it difficult to know for sure it that snowfall is only measured once a day, thus the totals for larger storms are often not captured.  So although the total for the entire storm was 33.0 cm, 

the single day measurement was only 22.5 cm.  But this was the highest single day total since March 9, 2005 when we had 31.5 cm.

Although it was a dry month, as the precipitation pretty much all came down as snow, the total snowfall of 51.5 cm was higher than the average of 43.7 cm for the month.  This made it the snowiest January since 2013 when we had 54 cm.  Overall for the snowfall season we are at 97.0 cm, very close to the average of 95.3 cm for this point in the season.

Summary for January 2022:

Maximum Temperature 3.5°C
Minimum Temperature -32.4°C
Average Daily High Temperature -4.4°C (Long term average -2.6°C)
Average Daily Low Temperature -16.3°C (Long term average -10.3°C)
Total Precipitation 40.6 mm (Long term average 65.2 mm)

(Long term averages based on 1981-2010 data for the Waterloo-Wellington Airport)


Wednesday, January 5, 2022

2021 Summary

University of Waterloo Weather Station Annual Summary - 2021

There were 2 big weather stories in 2021: how warm it was throughout the year and how wet it was in the second half of the year (punctuated by the highest 24 hour rainfall ever recorded at the station).

With only one month that was in the below average range and many that were well above average, it is not surprising that it was the third warmest since 1914, the year weather records began in the region.  The average annual temperature of 8.89°C was behind only 2012 (9.32°C) and 1998 (8.98°C).

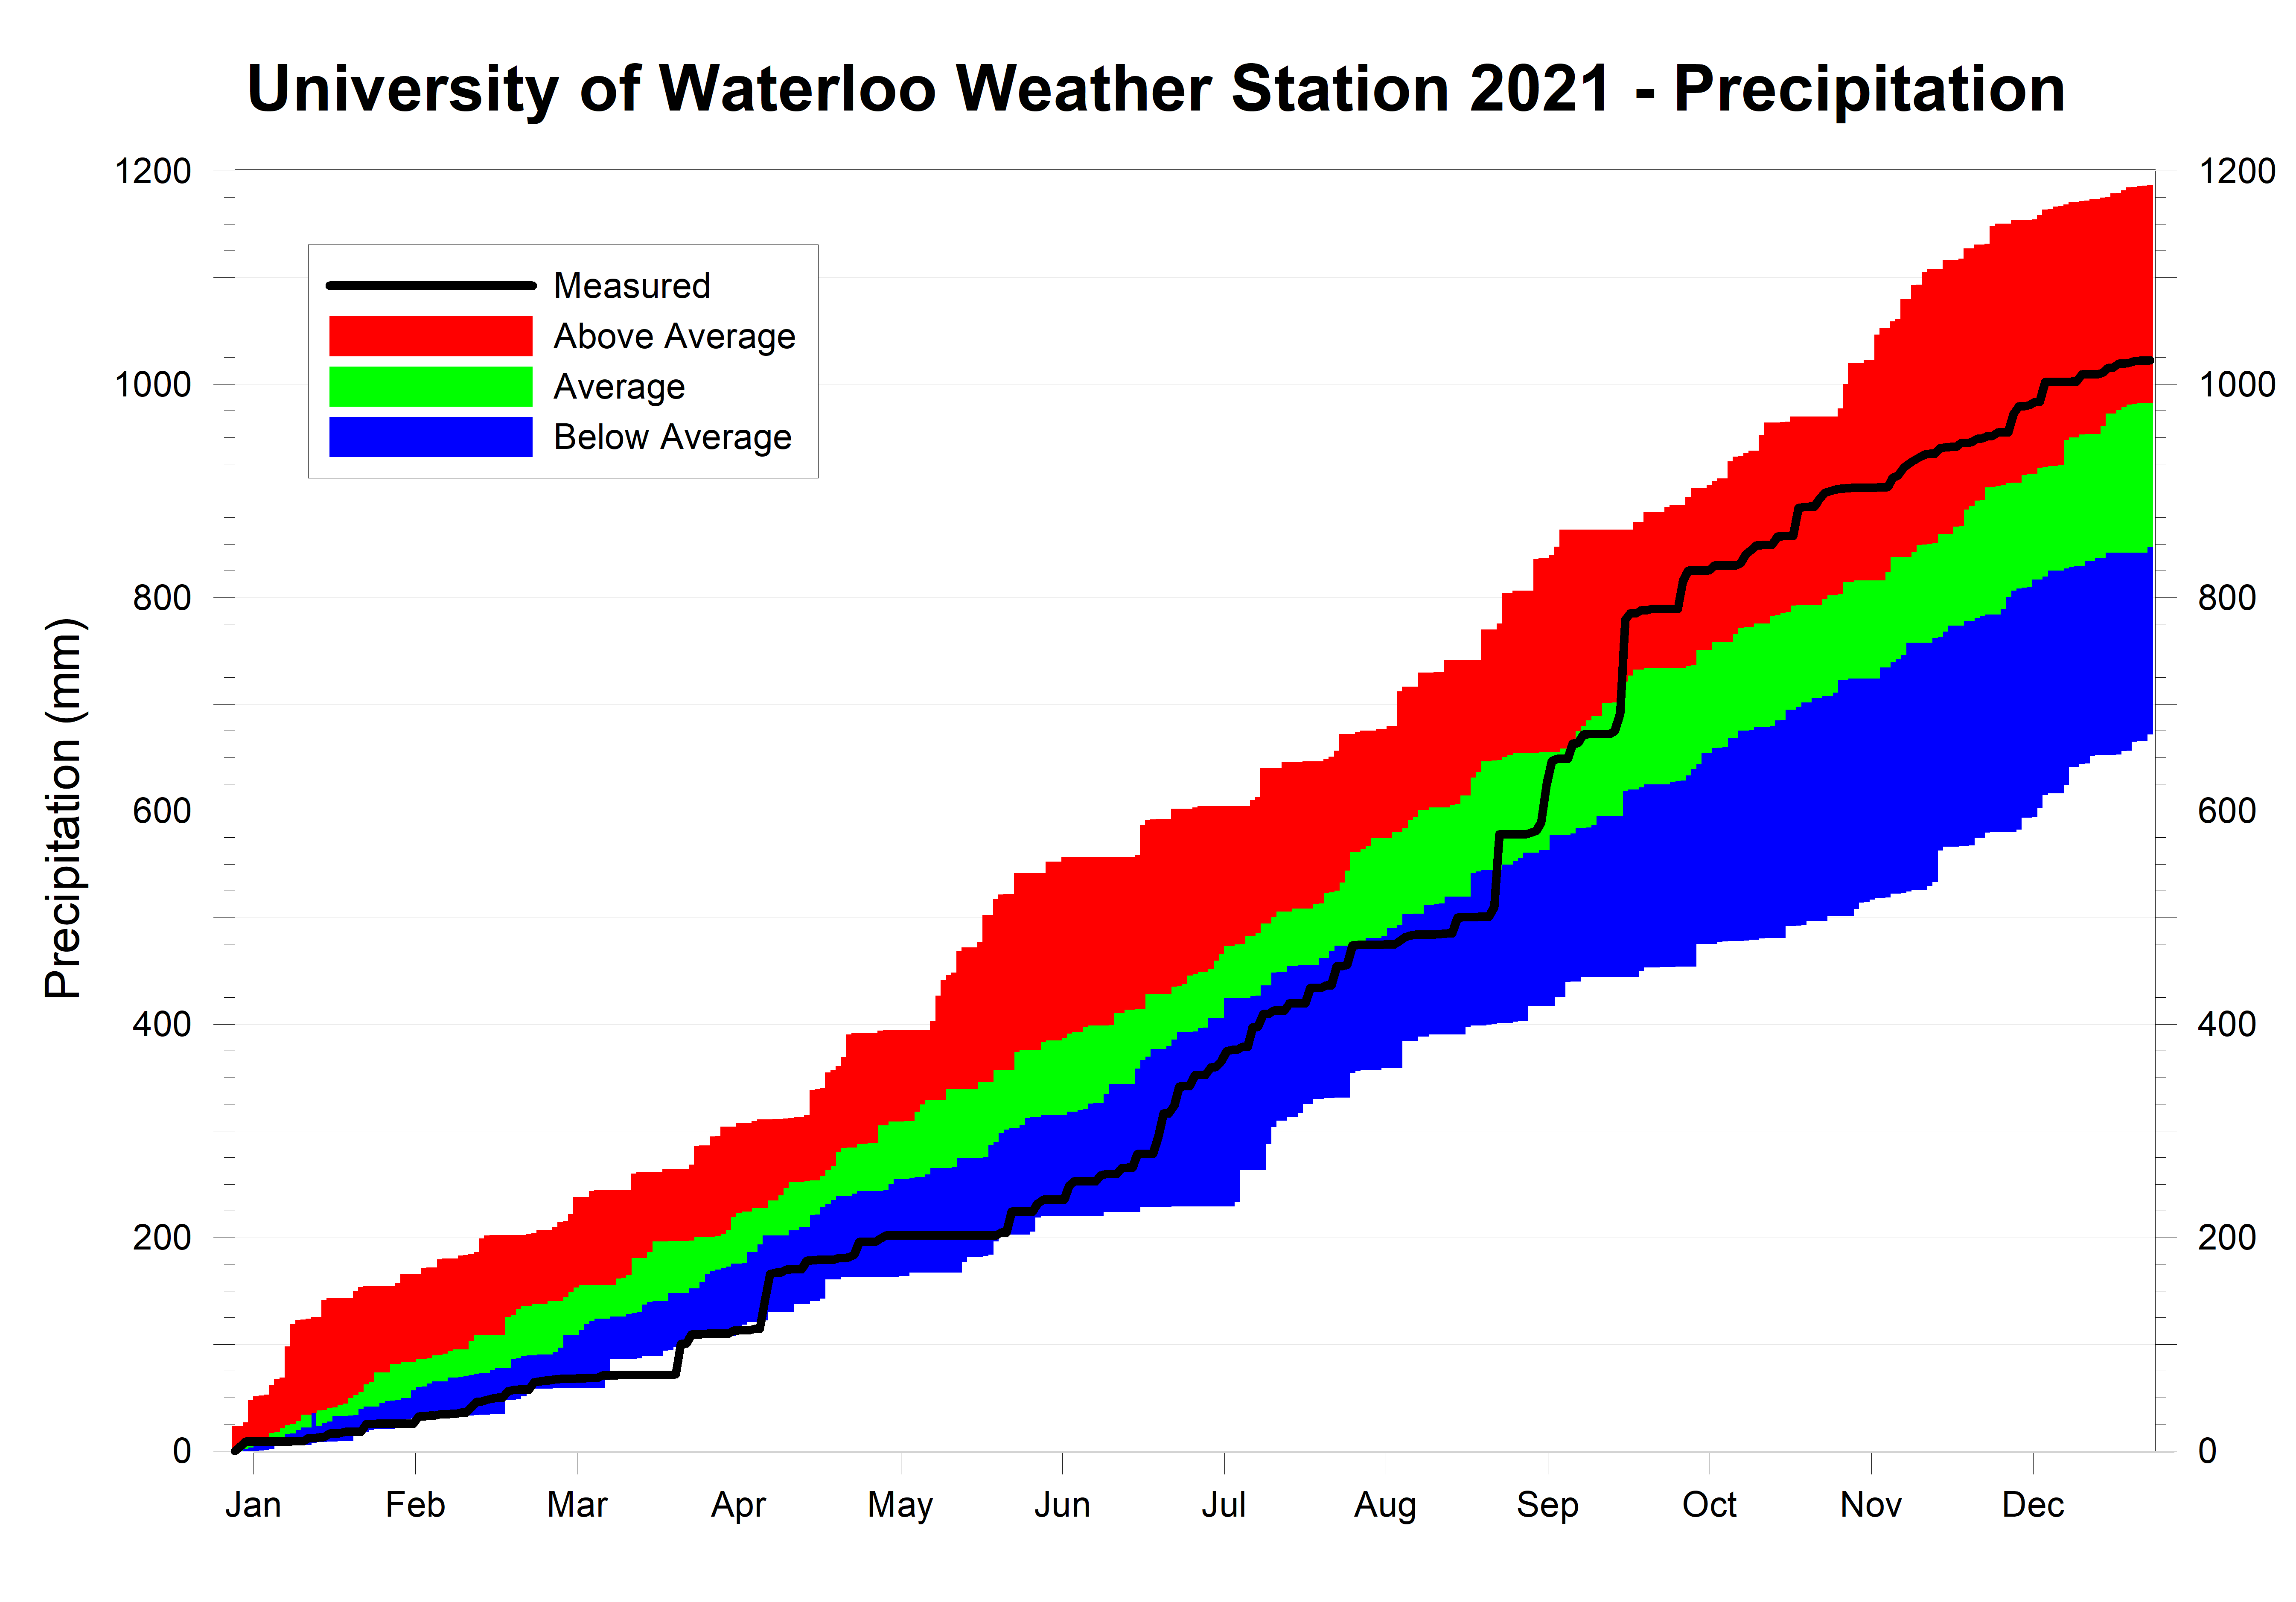
As for precipitation, the first half of the year was about 20% drier than average, however, the second half was really, really, wet.  In fact, the period from June to October was the wettest on record for those 5 months, thanks in part to the incredible amount of rain that came down between September 21 and 22.  Starting at 9 pm Sept 21, we saw 93.4 mm in 24 hours, the highest 24-hour total ever recorded at the station (The previous record was 91.4 mm starting Jan 11, 2020 at 3 am).  This rain event contributed to September being the second wettest ever in the regional weather records.  The total precipitation for the year was 1021.5 mm, compared to the average of 916.3 mm.

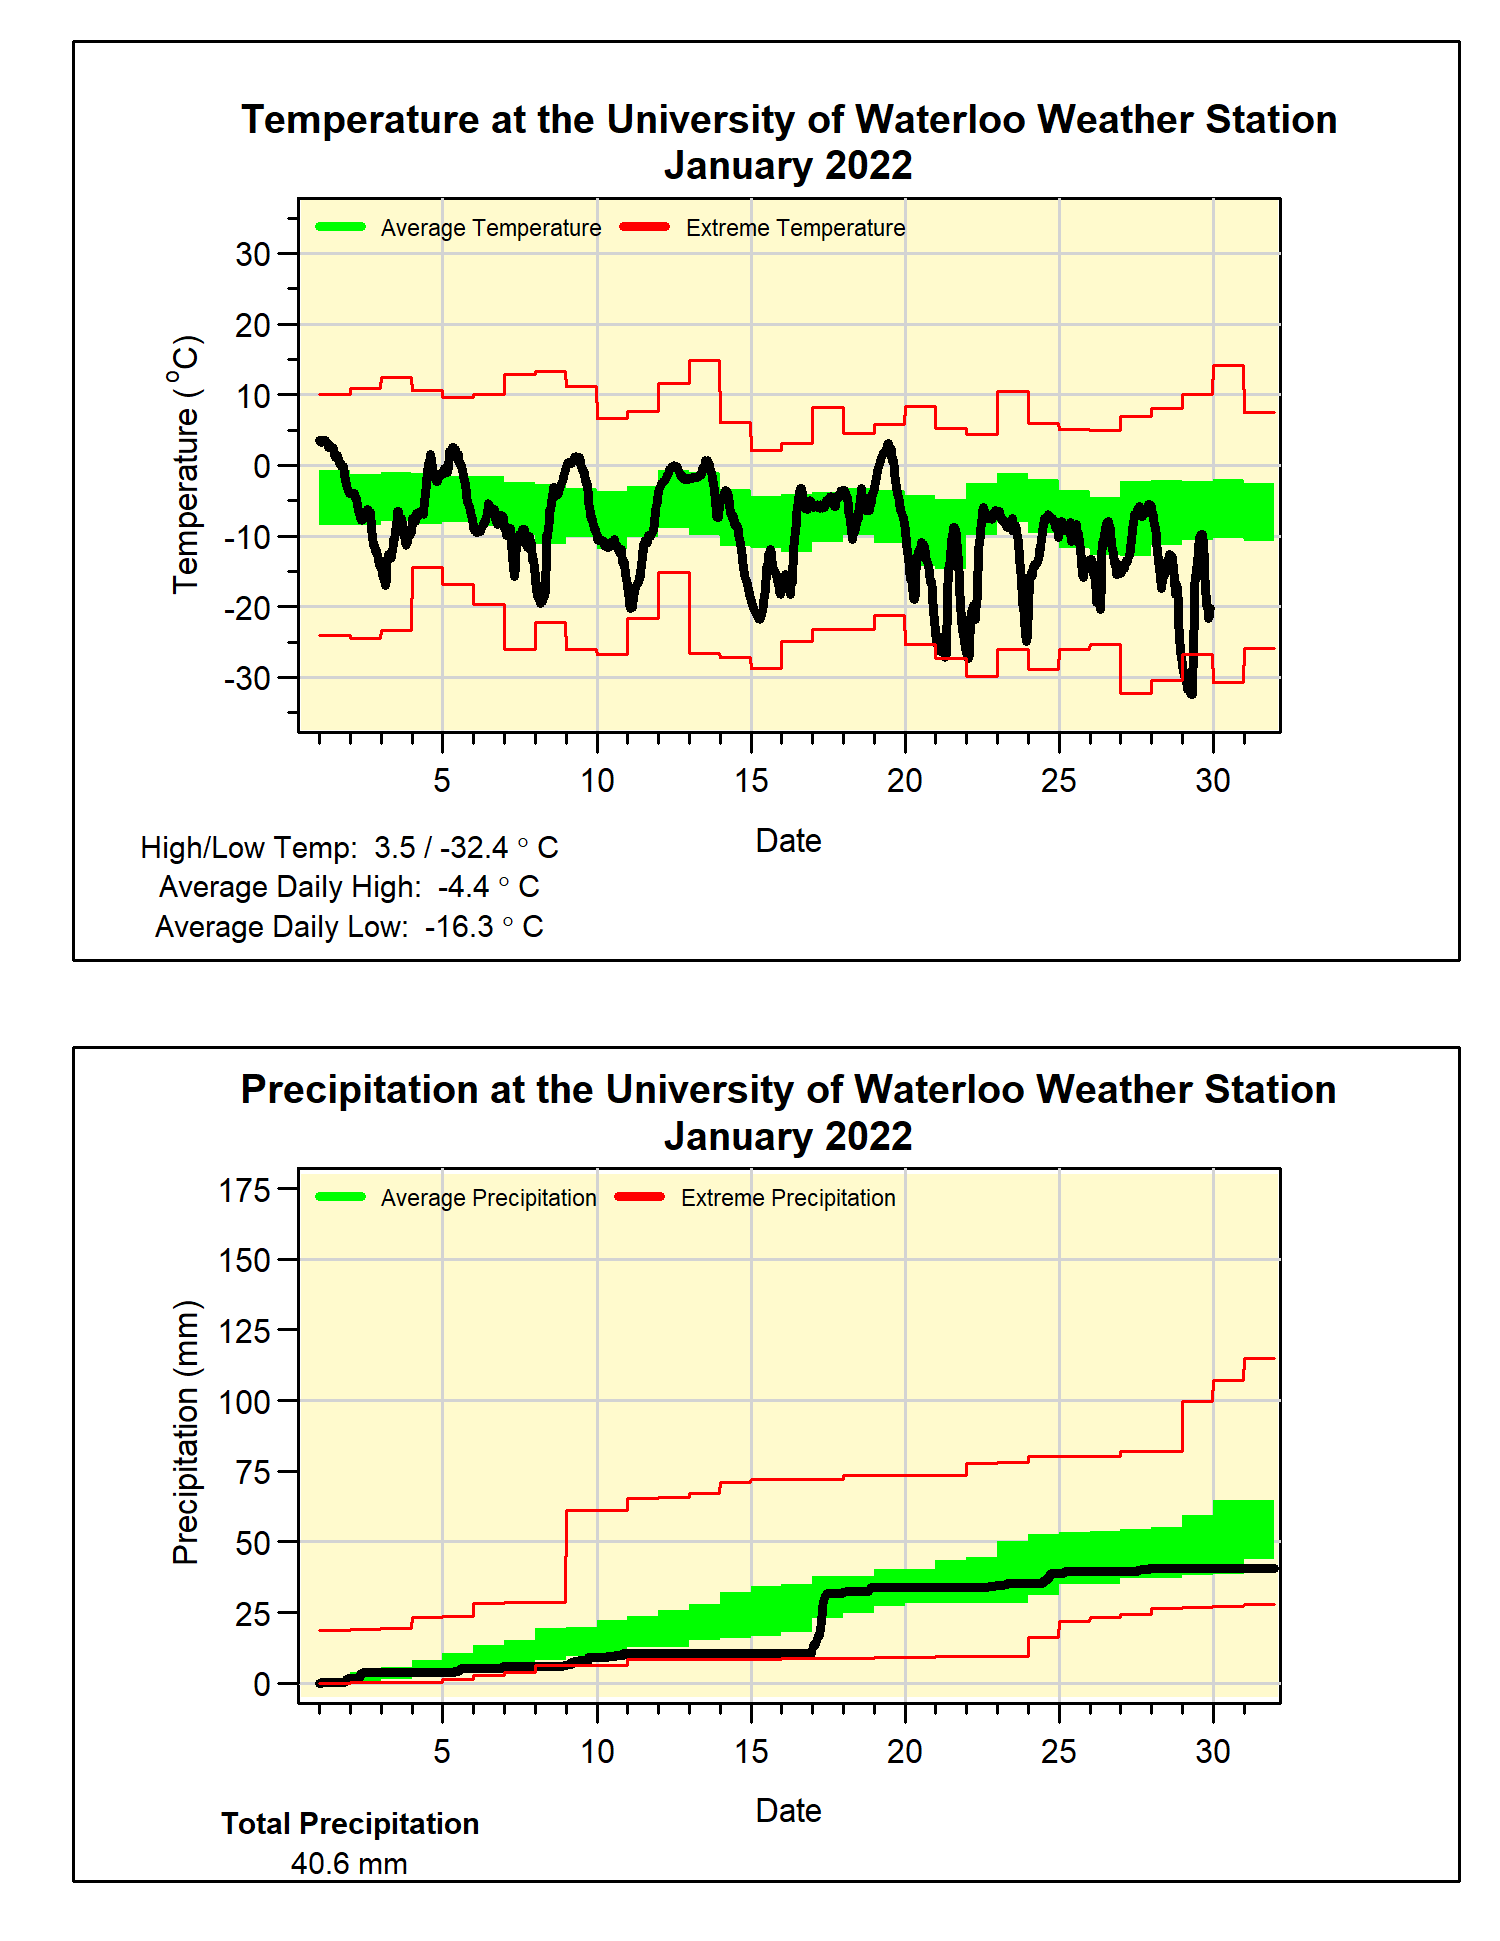
Looking at the monthly temperatures, the year started off with January coming in a little over 2 degrees above average, followed by the only month that was significantly colder than average.  Overall, February was 2 degrees below average, mainly a result of a really cold 2-week period with multiple days when the temperature dipped down to nearly -20°C and barely reached -10°C during the day.

Then the heat returned.  We saw the warmest March since 2012, including a few days that almost reached 20°C, and an April that was 1.3 degrees above average.  The month of May featured a mix of hot and cold temperatures, resulting in an overall temperature that was just barely below average.

June started off with 4 days over 30°C early in the month and continued warm for the rest of the month.  In the end, the month’s temperature came in at 3 degrees above average, making it the 5th warmest June on record.  2021 was one of the rare years when July (that was pretty much average) ended up being cooler than August, which was the second warmest in the last 20 years at a little more than 3 degrees above average.

September continued the warm streak at 1.8 degrees above average.  Then came a very warm October when it was almost 5 degrees above average.    This was partly a result of 10 days with a temperature over 20°C; typically, October has only 3.5 days like that.  This made it the warmest October since 2007.  It also tied for the fourth warmest since records began in the region in 1914.  

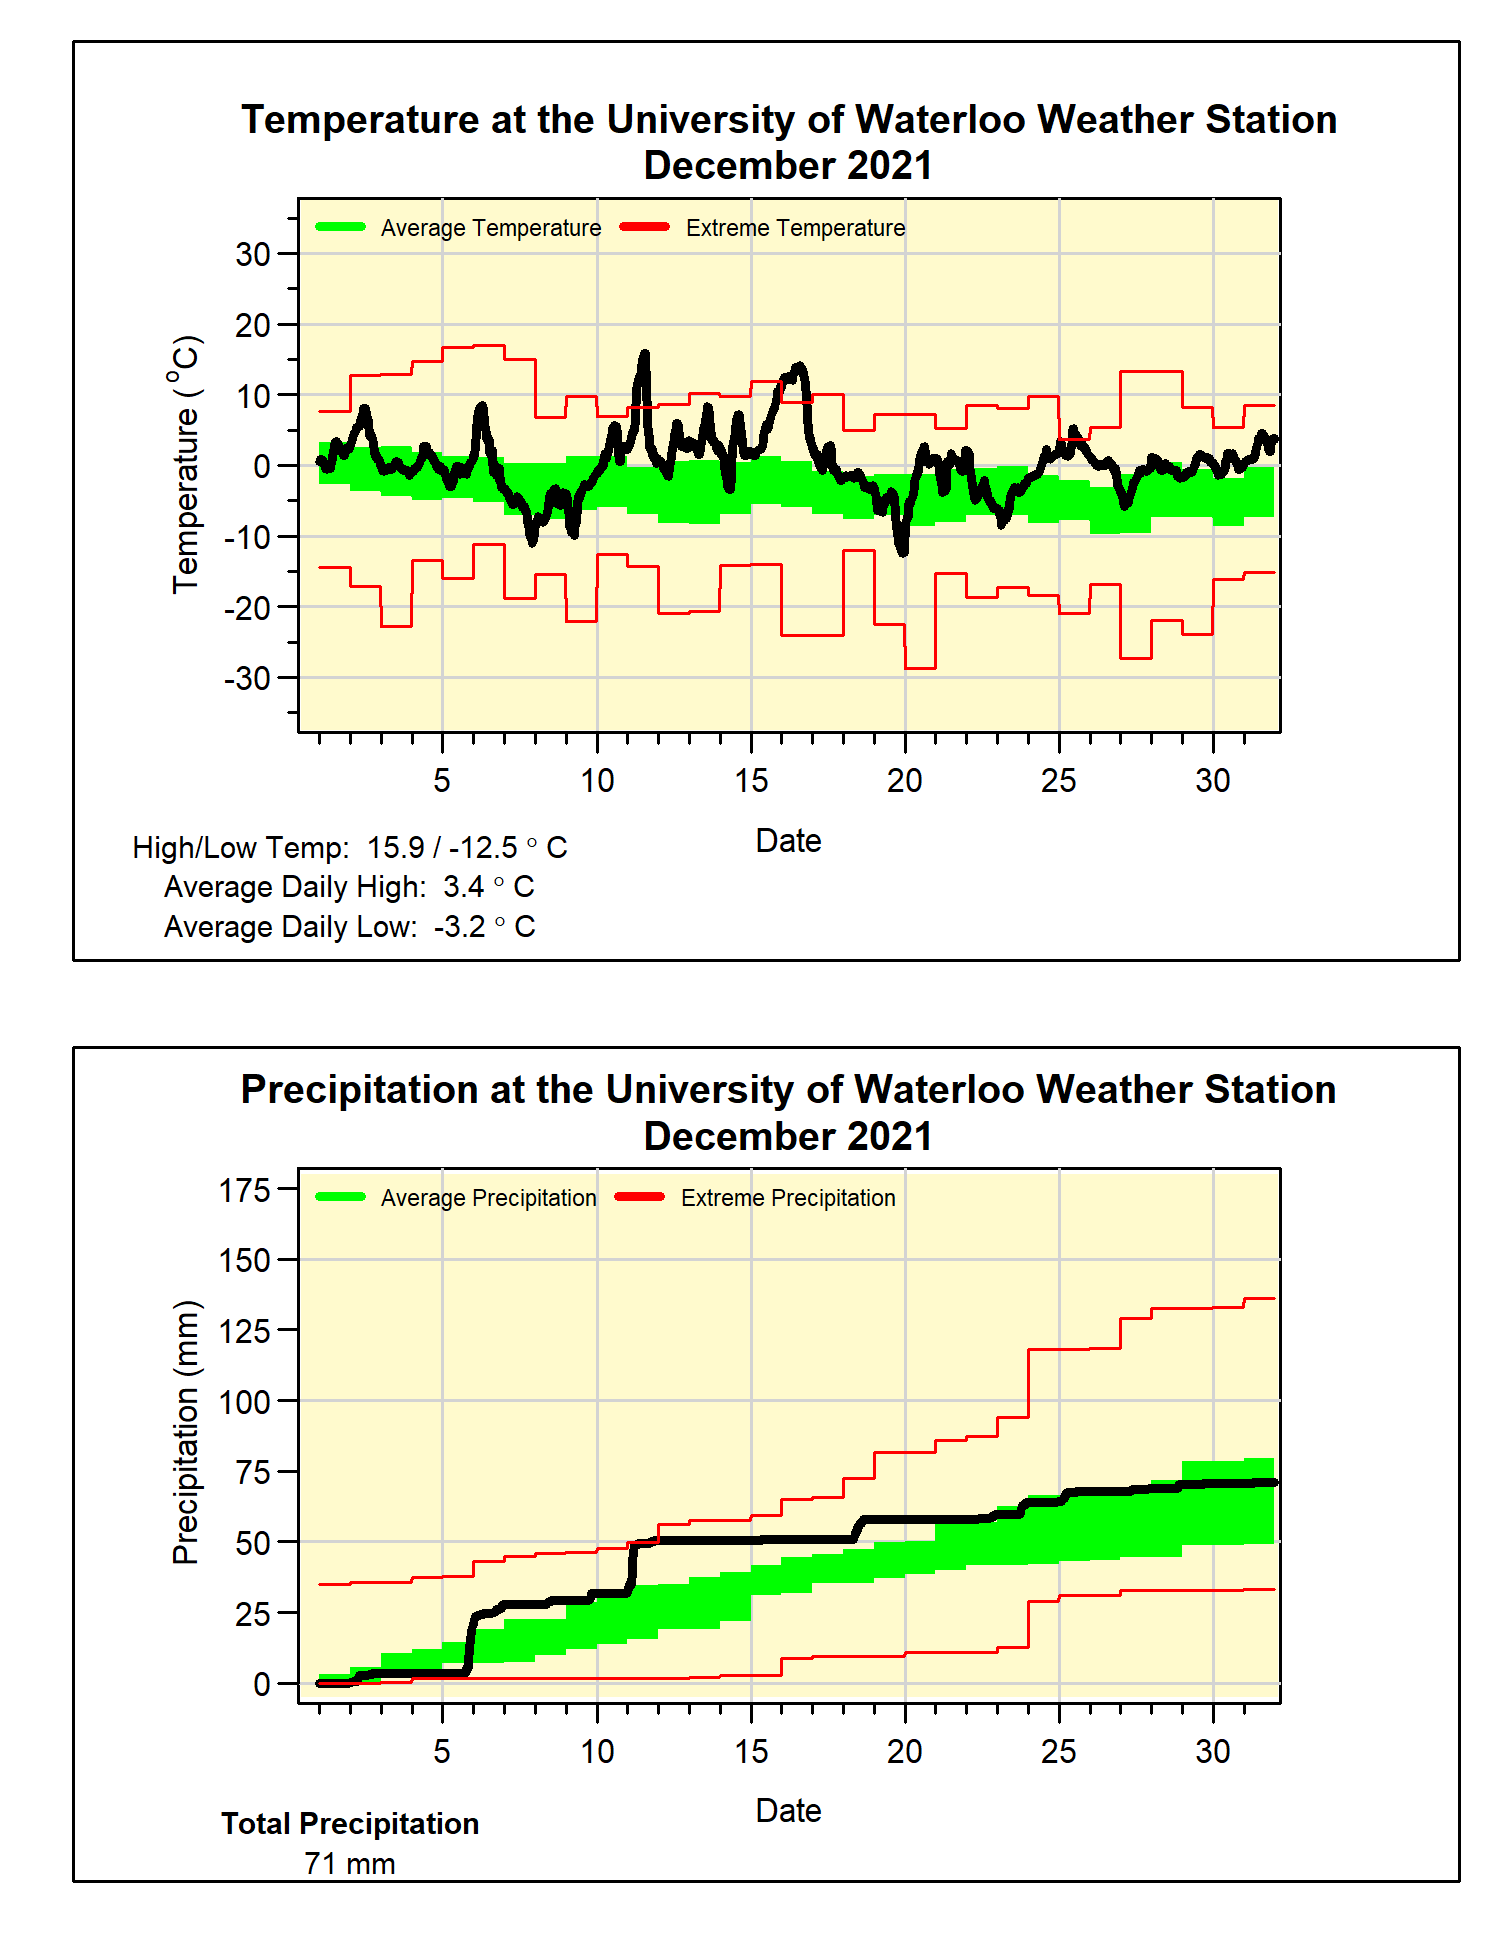
November was close to average, and the year ended with a December that was almost three and a half degrees above average, making it the warmest December since 2006 and the fourth warmest on record.  Also, the high temperature of 15.9°C on the 11th was the fifth hottest December day on record.  The last time it was it was that hot in December was Dec 5, 2001 when the high was 16.7°C.

Frank Seglenieks
weather@uwaterloo.ca
University of Waterloo Weather Station Coordinator

Summary for 2021 (averages from 1981-2010 data for the Waterloo-Wellington Airport):

Average Daily High Temperature: 13.95°C (average 12.05ºC)
Average Daily Low Temperature: 3.82°C  (average 1.94ºC)
Total Precipitation: 1021.5 mm (average 916.3 mm) 

Extremes for 2021 (all time UW weather station extreme in brackets):

Highest temperature:
31.7°C Aug 26 4:00 pm (35.7 °C July 21, 2011 3:00 pm)

Highest humidex:
44.0 Aug 26 4:00 pm (47.6 July 17, 2013 5:00 pm)

Lowest temperature:
-23.6°C Feb 21 7:00 am (-35.5 °C Feb 16, 2015 7:00 am)

Lowest windchill:
-35.6 Jan 29 3:00 am (-47.3 Feb 15, 2015 6:15 am)

Greatest temperature drop in 15 minutes:
-7.9°C Sep 7 5:45 pm (-9.5 °C July 19, 2013 5:00 pm)

Greatest temperature drop in 60 minutes:
-9.6°C Sep 7 5:30-6:30 pm (-11.8 °C July 19, 2013 4:45-5:45 pm)

Greatest temperature rise in 15 minutes:
4.2°C Mar 22 6:00 am (8.6 °C Jan 2, 2001 6:15 am)

Greatest temperature rise in 60 minutes:
7.4°C Mar 22 5:45 - 6:45 am (12.2 °C Jan 2, 2001 4:45-5:45 am)

Highest precipitation in 15 minutes:
19.2 mm Aug 29 7:45-8:00 pm (24.8 mm Jul 10, 2020 6:45-7:00 pm)

Highest precipitation in 60 minutes:
48.4 mm Aug 29 7:15-8:15 pm (57.4 mm Aug 2, 2014 2:30-3:30 pm)

Highest Precipitation in 1 day:
88.0 mm Sep 22 (New record) 

Highest 15 minute average wind speed:
26.4 km/h Dec 16 11:15 am (44.6 km/h Mar 9, 2002 6:30 pm)

Highest wind gust (only available since 2015):
40.6 km/h Dec 16 11:15 pm (44.4 km/h Apr 13, 2015 2:30 pm)

Last time the temperature went below 0 before the summer:
May 9 6:00 am (Has ranged between Apr 26- May 23)

First time the temperature went below 0 after the summer:
Oct 24 8:00 am (Has ranged between Sep 19 - Oct 29)

Length of frost-free season:
168 Days (Has ranged between 129-175 days)

Highest daily low temperature:
21.9°C Jun 27 (25.3 °C Aug 1, 2006)

Lowest daily high temperature:
-9.6°C Feb 7 (-20.6 °C Feb 15, 2015)

Largest daily temperature range:
23.3°C Mar 21 (29.6 °C Feb 19, 2007)

Smallest daily temperature range:
1.60°C Jan 12 (0.45 °C Dec 7, 2005)


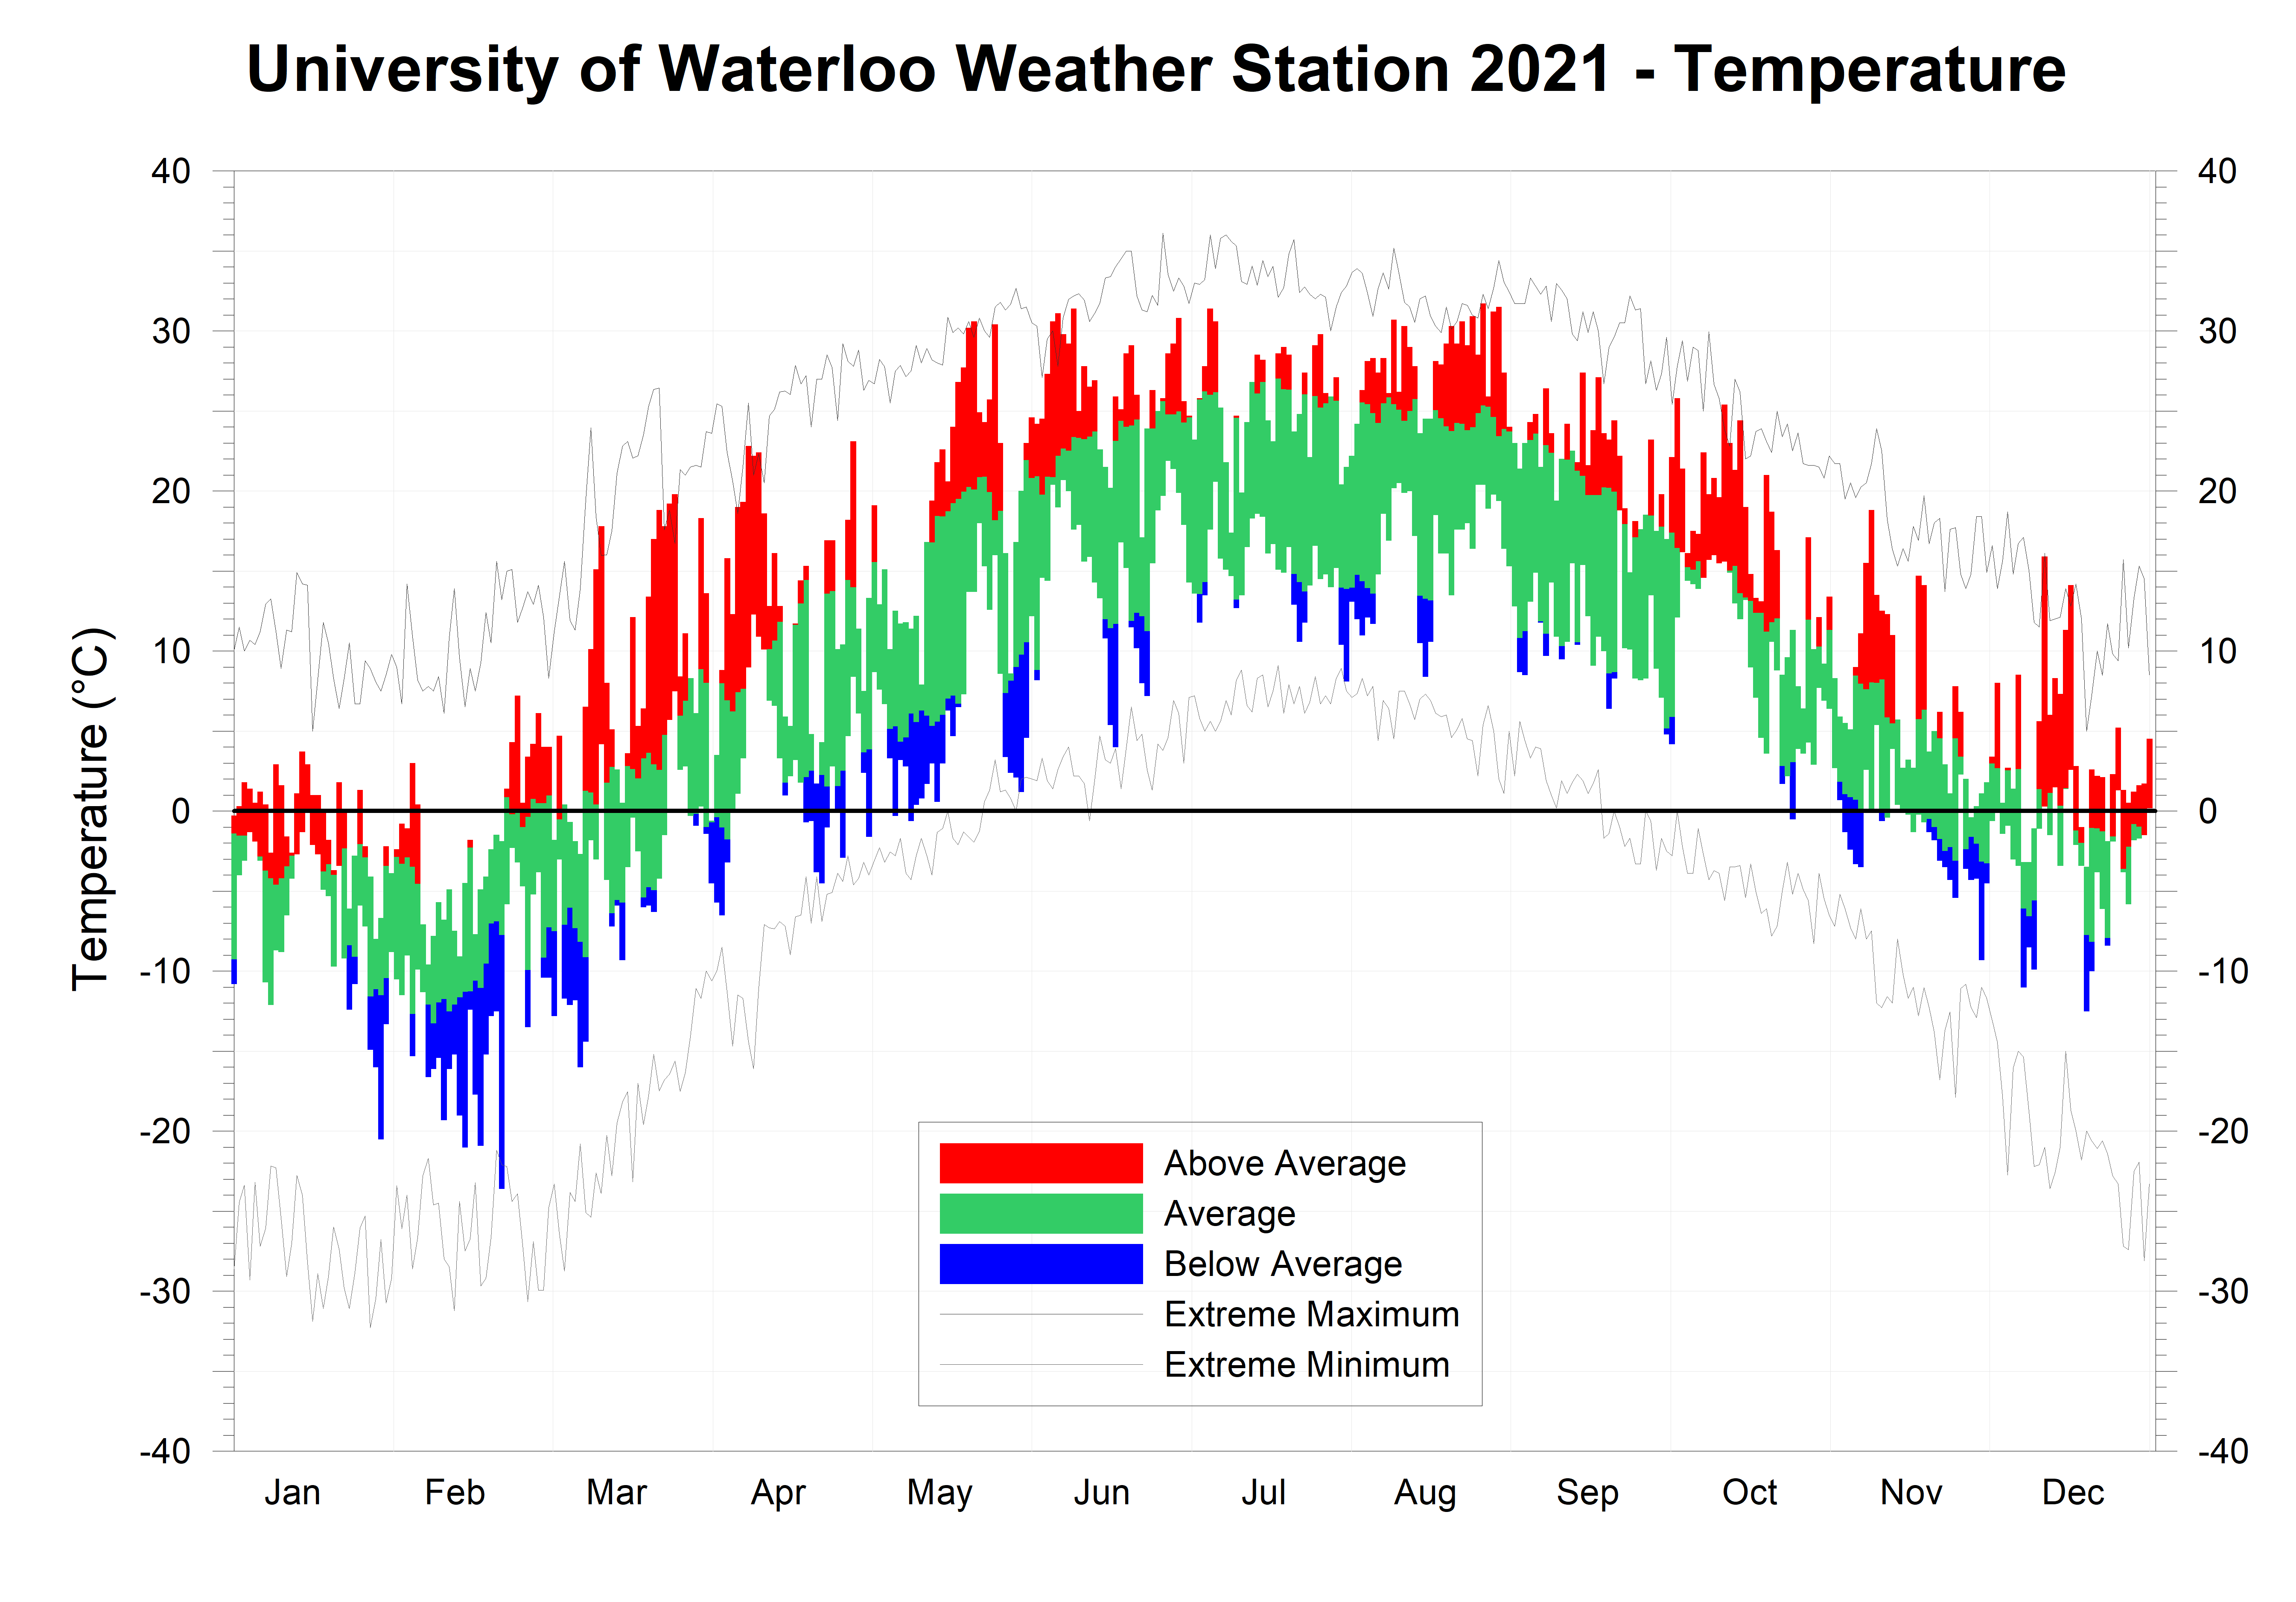
Click on the image below to see the temperature chart:


Click on the image below to see the precipitation chart:


Monday, January 3, 2022

December 2021 Summary

A very warm December with average precipitation

With only 5 colder than average days and lots of warm ones, December was 3.4 degrees above average.  This made it the warmest since 2006 and the fourth warmest since records began in the region a little over 100 years ago.  The high temperature of 15.9°C on the 11th was the fifth hottest December day on record, and the last time it was it was that hot in December was Dec 5, 2001 when it was 16.7°C.

It was pretty wet the first half of the month, but then dried out for the second half.  This resulted in a total precipitation of 71.0 mm, which is almost exactly the average of 71.2 mm.  However, the warm temperatures results in only 28.9 cm of snow compared to the average of 37.2 cm for December.

Summary for December 2021:
Maximum Temperature 15.9°C
Minimum Temperature -12.5°C
Average Daily High Temperature 3.4°C (Long term average 0.2°C)
Average Daily Low Temperature -3.2°C (Long term average -6.8°C)
Total Precipitation 71.0 mm (Long term average 71.2 mm)

(Long term averages based on 1981-2010 data for the Waterloo-Wellington Airport)