Thursday, December 3, 2020

November 2020 Summary

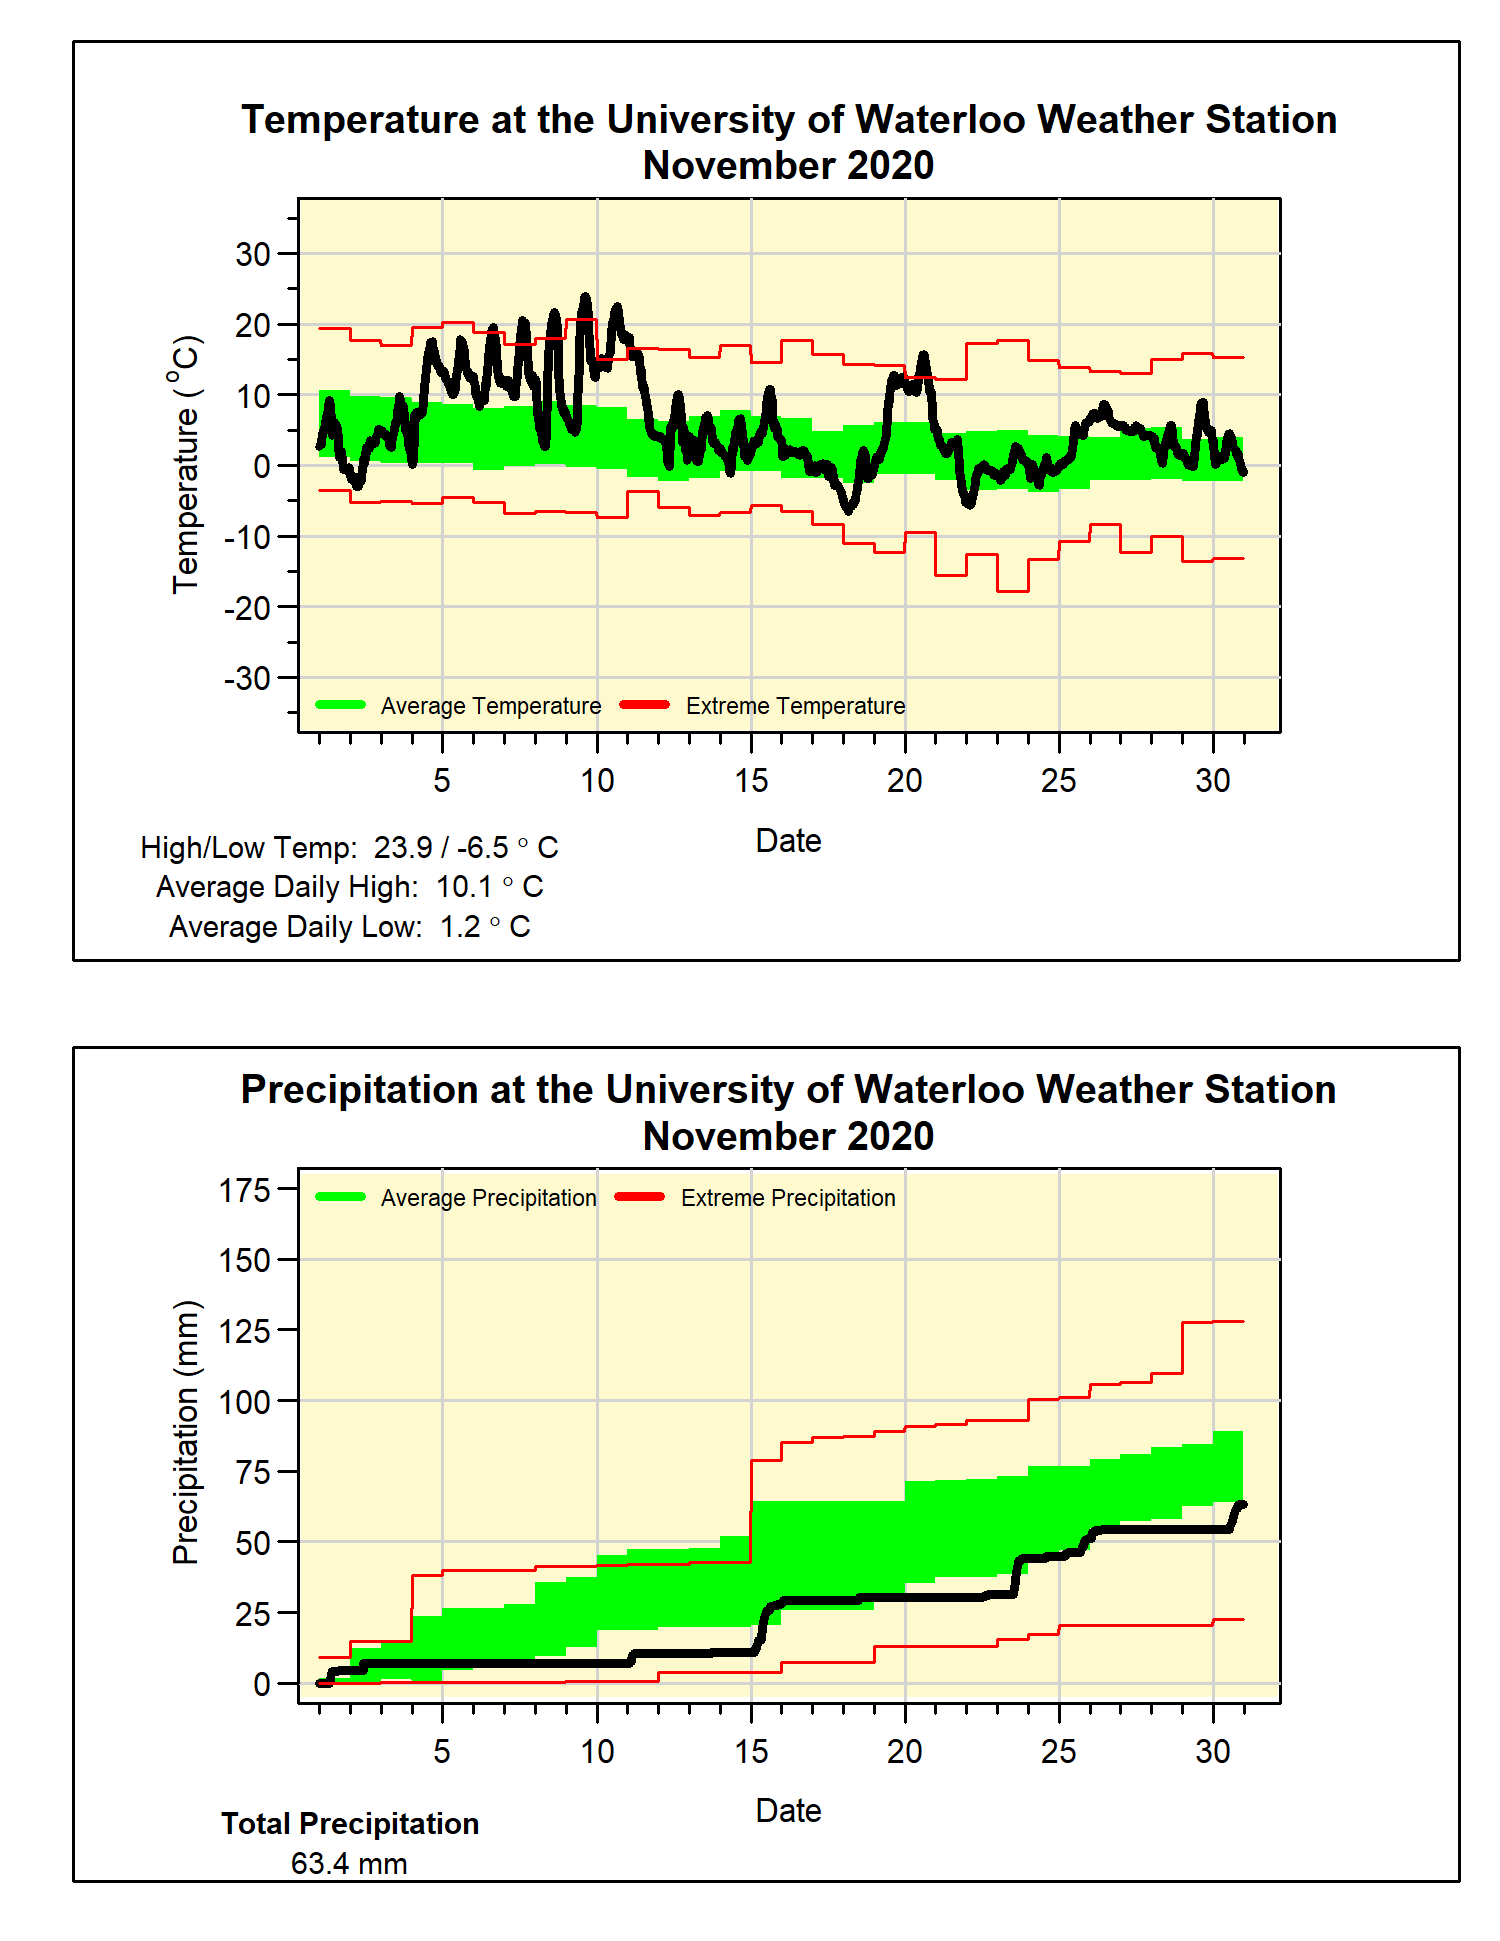
 A very warm November that was a bit drier than average

What a difference a year makes, last year was the coldest November in almost 25 years and this year it was the warmest in almost 10 years.  Overall, it was more than 3 degrees above average, almost 6 degrees higher than last year, and the 5th warmest November in the over 100 years of weather records in the region.

This was a result of a week of record breaking temperatures at the start of the month.  The records that fell include: the high on the 9th of 23.9°C was the second highest November temperature for the region (highest was 25.0°C on Nov. 1, 1950), we had 4 days in a row over 20°C which was the longest such streak in November, and finally the 8 days in a row above 15°C beat the previous longest streak of 7 days.

There were only a few days with any significant precipitation scattered throughout the month, which resulted in a total of 61.4 mm, putting it just below the average range.  The total precipitation of 886.5 mm is above the average for this time of year of 832.9 mm, and with only one more month to go in the year, unless December is very extreme we will probably end year with close to average.

The total snowfall of 22.5 cm was quite a bit more than the average of 13 cm for November.

Summary for November 2020:
Maximum Temperature 23.9°C
Minimum Temperature -6.5°C
Average Daily High Temperature 10.1°C (Long term average 6.3°C)
Average Daily Low Temperature 1.2°C (Long term average -1.4°C)
Total Precipitation 61.4 mm (Long term average 87.1 mm)

(Long term averages based on 1981-2010 data for the Waterloo-Wellington Airport)


Monday, November 2, 2020

October 2020 Summary

An average October for both temperature and precipitation

Although this was the coldest October in over 10 years, it was still only 0.1 degrees below the average, putting it well within the average range.  This is because October has been one of the most above average months in the past decade, after both September and August.

Looking at the graph, you can see just how much the high of 24.2°C on the 23rd was a blip compared to the rest of the month.  As the average temperature goes down a lot between the beginning and end of the month, it is rare that the highest temperature would occur that late.  In fact, that was the warmest day in the second half of October since 1968 when it was 24.4°C on the 17th.

The month started off with pretty average precipitation, got a bit wetter in the middle an ended off dry.  The total was 71.4 mm, a bit above the average of 67.4 mm and just within the average range for the month.

Random fact: we have only had one October that was drier than average in the past 10 years.

This slightly above average month resulted in the total precipitation since January (825.1 mm) staying above the average for this time of year (750.6 mm).


Summary for October 2020:
Maximum Temperature 24.2°C
Minimum Temperature -6.5°C
Average Daily High Temperature 12.6°C (Long term average 13.5°C)
Average Daily Low Temperature 3.6°C (Long term average 2.9°C)
Total Precipitation 71.4 mm (Long term average 67.4 mm)

(Long term averages based on 1981-2010 data for the Waterloo-Wellington Airport)


Sunday, October 4, 2020

September 2020 Summary

Another warm September with average precipitation

I know it seems that every September I talk about how consistently warm the month is compared to the other months of the year.  Well it turns out it is not just my imagination, here is a map (albeit for the US) of which month has warmed the most in the last 30 years:

https://twitter.com/Climatologist49/status/1307864627452149760

and you can see that around the Great Lakes that month is consistently September.

Although we saw some cooler temperatures, the pattern continued as the overall temperature was 0.8 degrees above average.  There were some cold nights during the month, but these were offset by almost a week that got to the mid-20s at the end of the month.

One of those cold nights happened on the 19th when the temperature actually went below zero for the first time since the spring.  This is the earliest it has happened in the 22 year history of the weather station and the coldest September temperature since September 30, 1993.

And now a riddle: What is wet on both ends and dry in the middle? 

Answer: September 2020.  

We saw 28.6 mm in the first 3 days of the month and 36.2 mm in the last 3 days, and only 22.4 mm in the other 24 days.  This included a stretch of 2 weeks with no rain at all between the 14th and 27th.  The total of 87.2 mm was just a little below the average of 87.8 mm for the month.

For the year so far, we have seen 753.7 mm of precipitation which is above the average of 683.5 mm for this time of year.

Summary for September 2020:
Maximum Temperature 27.9°C
Minimum Temperature -1.4°C
Average Daily High Temperature 21.4°C (Long term average 20.4°C)
Average Daily Low Temperature 9.2°C (Long term average 8.6°C)
Total Precipitation 87.8 mm (Long term average 87.8 mm)

(Long term averages based on 1981-2010 data for the Waterloo-Wellington Airport)


Wednesday, September 2, 2020

August 2020 Summary

A hot August that was both wet but also dry

Although it wasn’t as hot as July, August did continue the pattern of hot summer temperatures.  The heat was consistent with the longest stretch of colder than average temperatures being only 3 days.  Overall it was 1.5 degrees above average, contributing to that were 6 days above 30°C, a lot more than the 2 we usually see.

Why did the headline say it was both wet and dry?  In the first three days of the month we saw 72.2 mm of precipitation (more than the average total for 5 months of the year) but then only 11.2 mm the rest of the month.  So both wet and dry.  The total precipitation for the month of 83.4 mm was just a smidge lower than the average of 83.9 mm.

The total precipitation we have seen so far in 2020 of 666.5 mm is still above the average of 596.0 mm for this time of year.

Summary for August 2020:
Maximum Temperature 31.6°C
Minimum Temperature 7.9°C
Average Daily High Temperature 26.6°C (Long term average 24.8°C)
Average Daily Low Temperature 14.2°C (Long term average 12.9°C)
Total Precipitation 83.4 mm (Long term average 83.9 mm)

(Long term averages based on 1981-2010 data for the Waterloo-Wellington Airport)


Monday, August 3, 2020

July 2020 Summary

The third hottest July on record with average precipitation

The month started with a string of 10 days above 30°C, followed by days that were either at or above average (only one day was below average).  So it shouldn’t be a surprise that it was the third hottest July we have seen in the over 100 years of records in the region, 1.3 degrees away from the hottest back in 1955.

Other notes from the month: 

- the 15 days over 30°C was well above the July average of only 3.5 days
- the 10 days in a row over 30°C was the longest streak for any month since the 11 days from August 25th to September 4th 1953
- the 34.5°C reported on July 9th was the hottest July temperature since the 35.7°C on July 21, 2011 and the hottest day of any month since Sept 10, 2013 when it was 34.7°C

Although the total precipitation of 80.0 mm was just within the average range, almost all of it came during just 3 days of the month.  This means that there were also a few long dry streaks during the month, so it might have felt like it was drier than average.

The total precipitation so far this year of 583.1 mm is still above the average of 509.0 mm.

Summary for July 2020:
Maximum Temperature 34.5°C
Minimum Temperature 12.0°C
Average Daily High Temperature 29.6°C (Long term average 26.0°C)
Average Daily Low Temperature 16.6°C (Long term average 14.0°C)
Total Precipitation 80.0 mm (Long term average 98.6 mm)

(Long term averages based on 1981-2010 data for the Waterloo-Wellington Airport)


Wednesday, July 1, 2020

June 2020 Summary


A hot June with average precipitation 

There were lots of really hot days in June, including 8 days above 30°C, while we typically average only 2 of those days.  With only one cool spell that lasted just 3 days, the average overall temperature was 1.6 degrees above average.  This made it the hottest June since 2005.

Although the total precipitation of 76.4 mm was only a little below the average of 82.4 mm, this masks the fact that it was really a very dry month.  This discrepancy is a result of over half the month’s precipitation coming in one day (41.8 mm on June 10th), but only about 15 mm came down the rest of the month. 

For the first half of the year, the total precipitation we have seen of 503.1 mm is well above the average total of 416.1 mm at the halfway mark.  Most of this above average total is still a result of the very wet January.


Summary for June 2020:
Maximum Temperature 32.2°C
Minimum Temperature 4.6°C
Average Daily High Temperature 26.2°C (Long term average 23.6°C)
Average Daily Low Temperature 12.2°C (Long term average 11.5°C)
Total Precipitation 76.4 mm (Long term average 82.4 mm)

(Long term averages based on 1981-2010 data for the Waterloo-Wellington Airport)


Wednesday, June 3, 2020

May 2020 Summary


A cold May with average precipitation

Clearly it was a very cold start to the month, followed by some very hot temperatures (more on that later).  But we didn’t see enough of the warmth to make up for the cold start, so overall the month was 0.9 degrees below average, making it the coldest May since 2008.

Part of the cold start to the month saw the temperature go down to -4.3°C on May 9, which was tied for the 3rd lowest May temperature in the 100+ year history of weather records in the region.  Then on May 26, the high temperature of 31.8°C, was the 5th warmest day in May on record.  OK I know this one is a stretch, but the temperature range of 36.1 degrees was the second largest range in May temperatures we have seen in the region.

As well, it was not only the latest date (May 16) for the winner of the UW Weather Station Contest (when the temperature goes above 20°C), but it was the latest 20°C day in the last 100 years (previous record May 13 in 1919).

A storm late in the month that brought us 21.6 mm of rain in one day put the total precipitation up to 85.2 mm, just above the average of 82.3 mm.  The total for the year so far of 426.7 mm is well above the average of 340.2 mm.

So can we finally call an end to the snow season!  The 5.5 cm of snow on May 11th was quite a surprise that late in the month, but it was not the latest snow in the region, as back on May 18, 1923 there is a reading of 9 cm.  With the snow we did get in May, the total for the 2019-20 snowfall season was 159.5 cm, as close as you can get to the average of 159.7 cm.


Summary for May 2020:
Maximum Temperature 31.8°C
Minimum Temperature -4.3°C
Average Daily High Temperature 17.2°C (Long term average 18.5°C)
Average Daily Low Temperature 5.9°C (Long term average 6.4°C)
Total Precipitation 85.2 mm (Long term average 82.3 mm)

(Long term averages based on 1981-2010 data for the Waterloo-Wellington Airport)


Saturday, May 16, 2020

2020 Weather Station contest winners

As if this year wasn't crazy enough already, the winning date for the UW Weather Station Contest was not only the latest date we have seen in the history of the contest, but also the latest first 20°C day in the over 100 years of weather records in the region (the previous record was May 13th, 1919)

The temperature first went above 20°C at 3:15 pm on May 16th.

Out of the 1191 entries, it was Valerie Christie whose guess of 2:15 pm was the closest to the correct time.  While in second place was Mary Grummett.

I have a lot of respect for everyone who chose dates that were much later than any winning date in the past 100 years.

Congratulations to all the winners and thanks to everyone who entered.

And a question, should we allow people to choose dates in June next year?

Sunday, May 3, 2020

April 2020 Summary


A cold April with just barely average precipitation

The warmth of March carried on into the first week of April, but after that, there was a two week stretch of cold temperatures.  Even though it warmed up a bit right at the end of the month, the overall temperature was still a little over a degree colder than average.

This was the first colder than average month since November of last year, as well it means that 4 of the last 5 Aprils have been colder than average.  Also, the highest temperature for the month was only 17.0°C, the last time it didn’t get warmer than that during April was back in 1995.

If it wasn’t for the 20 mm of rain we got on the last day of the month, it would have been a drier than average April.  But that last day brought the total up to 55.2 mm, below the average of 74.5 mm, but enough to just get it into the average range.

At the end of April, the total for the year of 341.5 is still well above the 264.4 mm we would expect for the first four months of the year.

The only measurable snow during the month was one day with 1.5 cm, this put the total for the snowfall season at 153.5 cm, very close to the average of 159.7 cm.


Summary for April 2020:
Maximum Temperature 17.0°C
Minimum Temperature -7.0°C
Average Daily High Temperature 10.2°C (Long term average 11.5°C)
Average Daily Low Temperature -0.4°C (Long term average 0.8°C)
Total Precipitation 55.2 mm (Long term average 74.5 mm)

(Long term averages based on 1981-2010 data for the Waterloo-Wellington Airport)


Thursday, April 2, 2020

March 2020 Summary


A warm and wet March

For only the second time in the 100+ year history of weather records in the region, the temperature went above zero every day during the month of March (the other year was 2010).  But it was close as the high only got up to 0.1°C on the 14th, but hey it still counts.

Knowing this, it isn’t surprising that the overall temperature was 3 degrees above average and the fourth warmer than average month in a row.

There was pretty consistent precipitation throughout March, with the total of 79.0 mm being well above the average of 61.0 mm.  This year has started out very wet with 286.3 mm compared to an average of 187.6 mm.

Even with this high total precipitation, with the warm temperatures there was only 12.5 cm snow, less than half the average of 26.5 cm.  Although we average 7 cm of snow in April, if we don’t get any more this year the total for the snowfall season at 152 cm was just below the average of 159.7 cm.

Summary for March 2020:
Maximum Temperature 17.8°C
Minimum Temperature -16.4°C
Average Daily High Temperature 6.7°C (Long term average 3.6°C)
Average Daily Low Temperature -2.7°C (Long term average -5.6°C)
Total Precipitation 79.0 mm (Long term average 61.0 mm)


(Long term averages based on 1981-2010 data for the Waterloo-Wellington Airport)


Sunday, March 1, 2020

February 2020 Summary


A warm February with average precipitation and lots of snow

Although there were a few wide temperature swings during the month, the colder parts of those swings only lasted from a few hours to a few days.  This resulted in an overall temperature 0.8 degrees above average.  Continuing the pattern we have seen this winter, we haven’t gone more than 5 days in a row without a temperature above zero, I think this is a reason why so many people think it has not been a hard winter.

The precipitation was pretty steady throughout the month staying within the average range for most of the time.  The total precipitation at 52.6 mm was just below the average of 54.9 mm.

There were a few big snowfalls during the month which brought the total to 66.0 cm which is over twice as much as the average of 30.3 cm.  This also pushed the total snowfall for the season up to 139.5 cm, more than the average of 125.6 cm for this point in the season.

Finally, if you haven’t already, there is still time to enter the annual UW Weather Station Contest.  We are looking for your guess for the first time the temperature will go above 20°C this spring.  Find out all the details and enter here:
http://weather.uwaterloo.ca/2020contest/contest.html
Just remember you have to enter the contest by 2:00 pm on Wednesday, March 4th.


Summary for February 2020:
Maximum Temperature 8.2°C
Minimum Temperature -27.5°C
Average Daily High Temperature -0.2°C (Long term average -1.2°C)
Average Daily Low Temperature -9.1°C (Long term average -9.7°C)
Total Precipitation 52.6 mm (Long term average 54.9 mm)

(Long term averages based on 1981-2010 data for the Waterloo-Wellington Airport)


Monday, February 3, 2020

January 2020 Summary


A record wet January with a lot of warmth as well 

I know that the precipitation was the big story of this month, but first let’s examine just how warm it was.  At almost 4 degrees above average, it was the 6th warmest January in the over 100 years of weather records in the region and the warmest one since 2006.  During the month there was really only one really cold day, the 20th when it briefly went down just a bit below -20°C.

Of course the big story of the month was the heavy rain that fell on January 11th, it started in the morning and lasted the entire day, ending with a total of 79.6 mm.  This was almost double the previous record single day’s precipitation in January of 43.0 mm on January 15th, 1995 and more than the average for the entire month.  Not only that, it was the wettest day for any month since July 7, 1991 when 82.0 mm came down.

However, it was also wet the rest of the month, as even without the 11th the precipitation for January still would have been above average. As it stands, the 154.7 mm was more than 2.5 times the average of 65.2 mm, not surprisingly this was the wettest January on record in the region, eclipsing the previous record of 134.9 mm in 1929.

Even though there was lots of rain, we also had 38.5 cm of snowfall in January, which is less than the average of 43.7 cm for the month.  The total snowfall since the beginning of the fall is 73.5 cm, below the average of 95.3 cm for this point in the snowfall season.


Summary for January 2020:
Maximum Temperature 11.0°C
Minimum Temperature -20.3°C
Average Daily High Temperature 0.8°C (Long term average -2.6°C)
Average Daily Low Temperature -5.8°C (Long term average -10.3°C)
Total Precipitation 154.7 mm (Long term average 65.2 mm)

(Long term averages based on 1981-2010 data for the Waterloo-Wellington Airport)


Tuesday, January 14, 2020

2019 Summary

University of Waterloo Weather Station Annual Summary - 2019

First half of 2019: cold and wet
Second half of 2019: (mostly) warm and (mostly) dry
Overall for 2019: average temperature and precipitation

As you can see above, there were really two parts to the weather story for 2019 in the Waterloo Region.  The first half of the year didn’t have any above average months for temperature or below average months for precipitation.  In the second half of the year, 5 of the 6 months were above average for temperature and only 1 month that was wetter than average.  When you put that all together, you come up with a year that was very average.

At 1.5 degrees below average, January started off the year cold including the 30th when it only got up to -17.2°C, this was the lowest daily high temperature since Feb 19, 2015.  February and early March saw a lot of variation in the temperature with some warmer spells and cold patches.  It wasn’t until about mid-March before we experienced a few weeks of generally average temperatures.

Then we had what has been typical in the last few years, with colder than average Spring temperatures, particularly in April.  Although it was never really extremely cold during this time, there were a lot of days enough below average to result in a colder than average April and May.

June was the first month of year that was at least a little bit higher than average (even if it was just by 0.04 degrees).  This started off the warm summer, which peaked in July when it was over 2 degrees higher than average, making the hottest month since July of 2012, also that month had 9 days over 30°C which is well above the average of only 3.5 days.

Continuing the pattern we have seen for the last 20 years, September was warmer than average, even though it was the least warm September in the previous 6 years, it was still 2 degrees above average. October started off with a daily high temperature near 30°C, which was only the third time there has been a day of at least 30°C during the month of October in the over 100 years of weather data in the region.  Overall October was 1.2 degrees above average.

November was definitely the anomaly for the second half of the year, coming in at 2.5 degrees colder than average, enough to make it the coldest in the past 25 years, while the high temperature of 10.4°C on the 27th was the lowest daily high temperature for November on record.  It then turned around in December with a generally warm month that was 1.5 degrees above average.
 
So when you combine the colder first half of the year with the warmer second half, it not surprising that the result is an overall temperature just 0.1 degrees above the average, which is the least warm overall temperature since 2014.

As for precipitation, it was above average from February to May, but then it got a little bit drier, with July the driest month of the year with only 39.8 mm.  Although the wettest month was October (152.4 mm) it was an outlier in an otherwise drier than average second half of the year.

The final total precipitation for 2019 of 923.0 mm was only a little over the average of 916.3 mm and well within the average range.  Fun fact, this was the closest final total to the average in the 20 year history of the UW weather station.

Frank Seglenieks
weather@uwaterloo.ca
University of Waterloo Weather Station Coordinator

Summary for 2019 (averages from 1981-2010 data for the Waterloo-Wellington Airport):
Average Daily High Temperature: 12.28°C (average 12.05ºC)
Average Daily Low Temperature: 1.95°C  (average 1.94ºC)
Total Precipitation: 923.0 mm (average 916.3 mm)

Extremes for 2019 (all time UW weather station extreme in brackets):
Highest temperature:
33.2°C Jul 5 4:00 pm (35.7 °C July 21, 2011 3:00 pm)
Highest humidex:
43.4 Jul 5 4:15 pm (47.6 July 17, 2013 5:00 pm)
Lowest temperature:
-26.7°C Feb 28 6:45 am (-35.5 °C Feb 16, 2015 7:00 am)
Lowest windchill:
-39.1 Jan 31 7:45 am (-47.3 Feb 15, 2015 6:15 am)
Greatest temperature drop in 15 minutes:
-5.2°C Jun 28 12:00 pm (-9.5 °C July 19, 2013 5:00 pm)
Greatest temperature drop in 60 minutes:
-8.6°C Jun 28 12:00-1:00 pm (-11.8 °C July 19, 2013 4:45-5:45 pm)
Greatest temperature rise in 15 minutes:
3.8°C Jan 1 8:00 am (8.6 °C Jan 2, 2001 6:15 am)
Greatest temperature rise in 60 minutes:
8.0°C Feb 28 8:00 - 9:00 am (12.2 °C Jan 2, 2001 4:45-5:45 am)
Highest precipitation in 15 minutes:
12.8 mm Aug 18 4:45-5:00 pm (23.0 mm Jul 22, 2008 1:45-2:00 pm)
Highest precipitation in 60 minutes:
14.8 mm Aug 18 4:30-5:30 pm (36.7 mm Jun 16, 1998 3:30-4:30 pm)
Highest Precipitation in 1 day:
36.6 mm Aug 18 (78.0 mm July 11, 2008)
Highest 15 minute average wind speed:
22.5 km/h Feb 24 12:15 pm (44.6 km/h Mar 9, 2002 6:30 pm)
Highest wind gust (only available since 2015):
36.9 km/h Feb 24 12:15 pm (44.4 km/h Apr 13, 2015 2:30 pm)
Last time the temperature went below 0 before the summer:
Apr 29 6:30 am (Has ranged between Apr 26- May 23)
First time the temperature went below 0 after the summer:
Oct 19 12:45 am (Has ranged between Oct 2-29)
Length of frost-free season
173 Days (Has ranged between 146-175 days)
Highest daily low temperature:
22.2°C Jul 19 (25.3 °C Aug 1, 2006)
Lowest daily high temperature:
-17.2°C Jan 30 (-20.6 °C Feb 15, 2015)
Largest daily temperature range:
22.1°C Mar 1 (29.6 °C Feb 19, 2007)
Smallest daily temperature range:
1.7°C Feb 11 (0.45 °C Dec 7, 2005)

(averages are calculated from 1981-2010 data for the Waterloo-Wellington Airport)

Click on the image below to see the temperature chart:

Click on the image below to see the precipitation chart:

Wednesday, January 1, 2020

December 2019 Summary


A warm December with average precipitation

Apart from 8 hours of really cold temperatures overnight between the 19th and the 20th, the rest of the month was relatively warm.  This put the overall temperature at 1.5 degrees above average.  Interestingly, it seems that most of the recent Decembers have gone one way or the other, in the past 10 years we have had 6 above average, 3 below average, and only one average December.

There was pretty steady precipitation throughout the month and although the total of 57.0 mm was less than the average of 71.2 mm, it was still within the average range.

December only saw 19.0 cm of snow, about half the average of 37.2 cm for the month.

Summary for December 2019:
Maximum Temperature 10.1°C
Minimum Temperature -21.2°C
Average Daily High Temperature 1.9°C (Long term average 0.2°C)
Average Daily Low Temperature -5.5°C (Long term average -6.8°C)
Total Precipitation 57.0 mm (Long term average 71.2 mm)


(Long term averages based on 1981-2010 data for the Waterloo-Wellington Airport)