University of Waterloo Weather Station Annual Summary - 2013
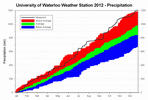
This year the weather story in the region was the amount of precipitation we saw throughout the year. The total amount we got at the UW weather station was 1204.7 mm, not only was this much more than the average of 904.0 mm, but it was also the most I was able to find ever recorded in the 99 years of records in the region. This total was quite a contrast to 2012 when we only got 782.7 mm.
I should also mention that this amount of precipitation was not the same as was recorded at the most visible weather station in the area at the Waterloo Wellington Airport. I did a bit of investigation and looked at precipitation measured at gauges operated by the Grand River Conservation Authority (big thanks to the GRCA) and historical Environment Canada weather radar. When comparing all this information, the readings seen at the UW weather station were reasonable and based on all the evidence I’m going to stick with the precipitation numbers from the UW weather station.
The year was very evenly wet with only 3 months that were drier than average, the standouts were July (most since 1991) and October (second wettest ever in the region). Then there was the 24 hour period in September when we had an astonishing 94.1 mm of precipitation.
Even with the large amount of precipitation seen during the year, the total snowfall for the year was 179 cm, which is not that much over the average of 159.5 cm. Interestingly, over half of the total for the year came in February, which was the second snowiest on record in the region.
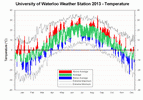
As for temperature, overall it was 0.4 degrees above the 1971-2000 average (yes that is still the official 30 year average) which puts it somewhere between the 15th and 20th warmest we have seen.
January was very warm but then a cold late winter and early spring left people wondering if summer would ever come. Once it did, the summer was about a degree hotter than average. This heat lasted until about mid-October when the end of the year chill came in, ending with a December that was the most below average month in almost 3 years.
The high of 14.2°C on the 30th was tied for the second warmest January day we have seen in the region since records began almost 100 years ago. Then there was the dramatic change in temperature from 5:15 pm to 5:30 pm on July 19th, when the temperature dropped almost 9.5 degrees, this was the largest 15 minute temperature drop in the 15 year history of the UW weather station. On September 10th the temperature got up to 34.7°C, this was the hottest September day since 1953 (36.7°C), and the 4th hottest September day ever in the region.
With the earliest date for the last frost of the year (April 26th) and the latest date for the first frost (October 29th), it follows that it was the longest frost-free season we have seen in the region at 186 days.
Summary for 2013 (averages are calculated from 1971-2000 data for the Waterloo-Wellington Airport):
Average Daily High Temperature: 11.92 °C (average 11.89 °C)
Average Daily Low Temperature: 2.43 °C (average 1.71 °C)
Total Precipitation: 1204.7 mm (average 904.0 mm)
Click on the image below to see the temperature chart:

Click on the image below to see the precipitation chart:


