An average August for both temperature and precipitation
Although we didn’t see lots of really hot temperatures this month (only one day above 30°C), we also didn’t see lots of cold ones. This resulted in the overall temperature being just 0.2 degrees below average, but this is still within the average range.
This may be surprising to some, but the fact is we have seen a string of warm months of August in recent years with this year’s overall temperature being the coolest since 2008. In the 20 years of data at the UW Weather Station, only one August (2004) was cold enough to be in the below average range. It was also a lot cooler than last year when we had 8 days over 30°C in August.
The month started out very wet, but with drier conditions in the last week the total precipitation of 93.6 mm was within the average range coming in a bit higher than the average for August of 83.9 mm.
The total precipitation for the year of 775.4 mm is well above the average of 596.0 mm. For the last few months we have been in second in the “wettest year to date” category, however, there were lots of wet months of August in the past so we have dropped down to the sixth wettest year so far since records in the area began just over 100 years ago.
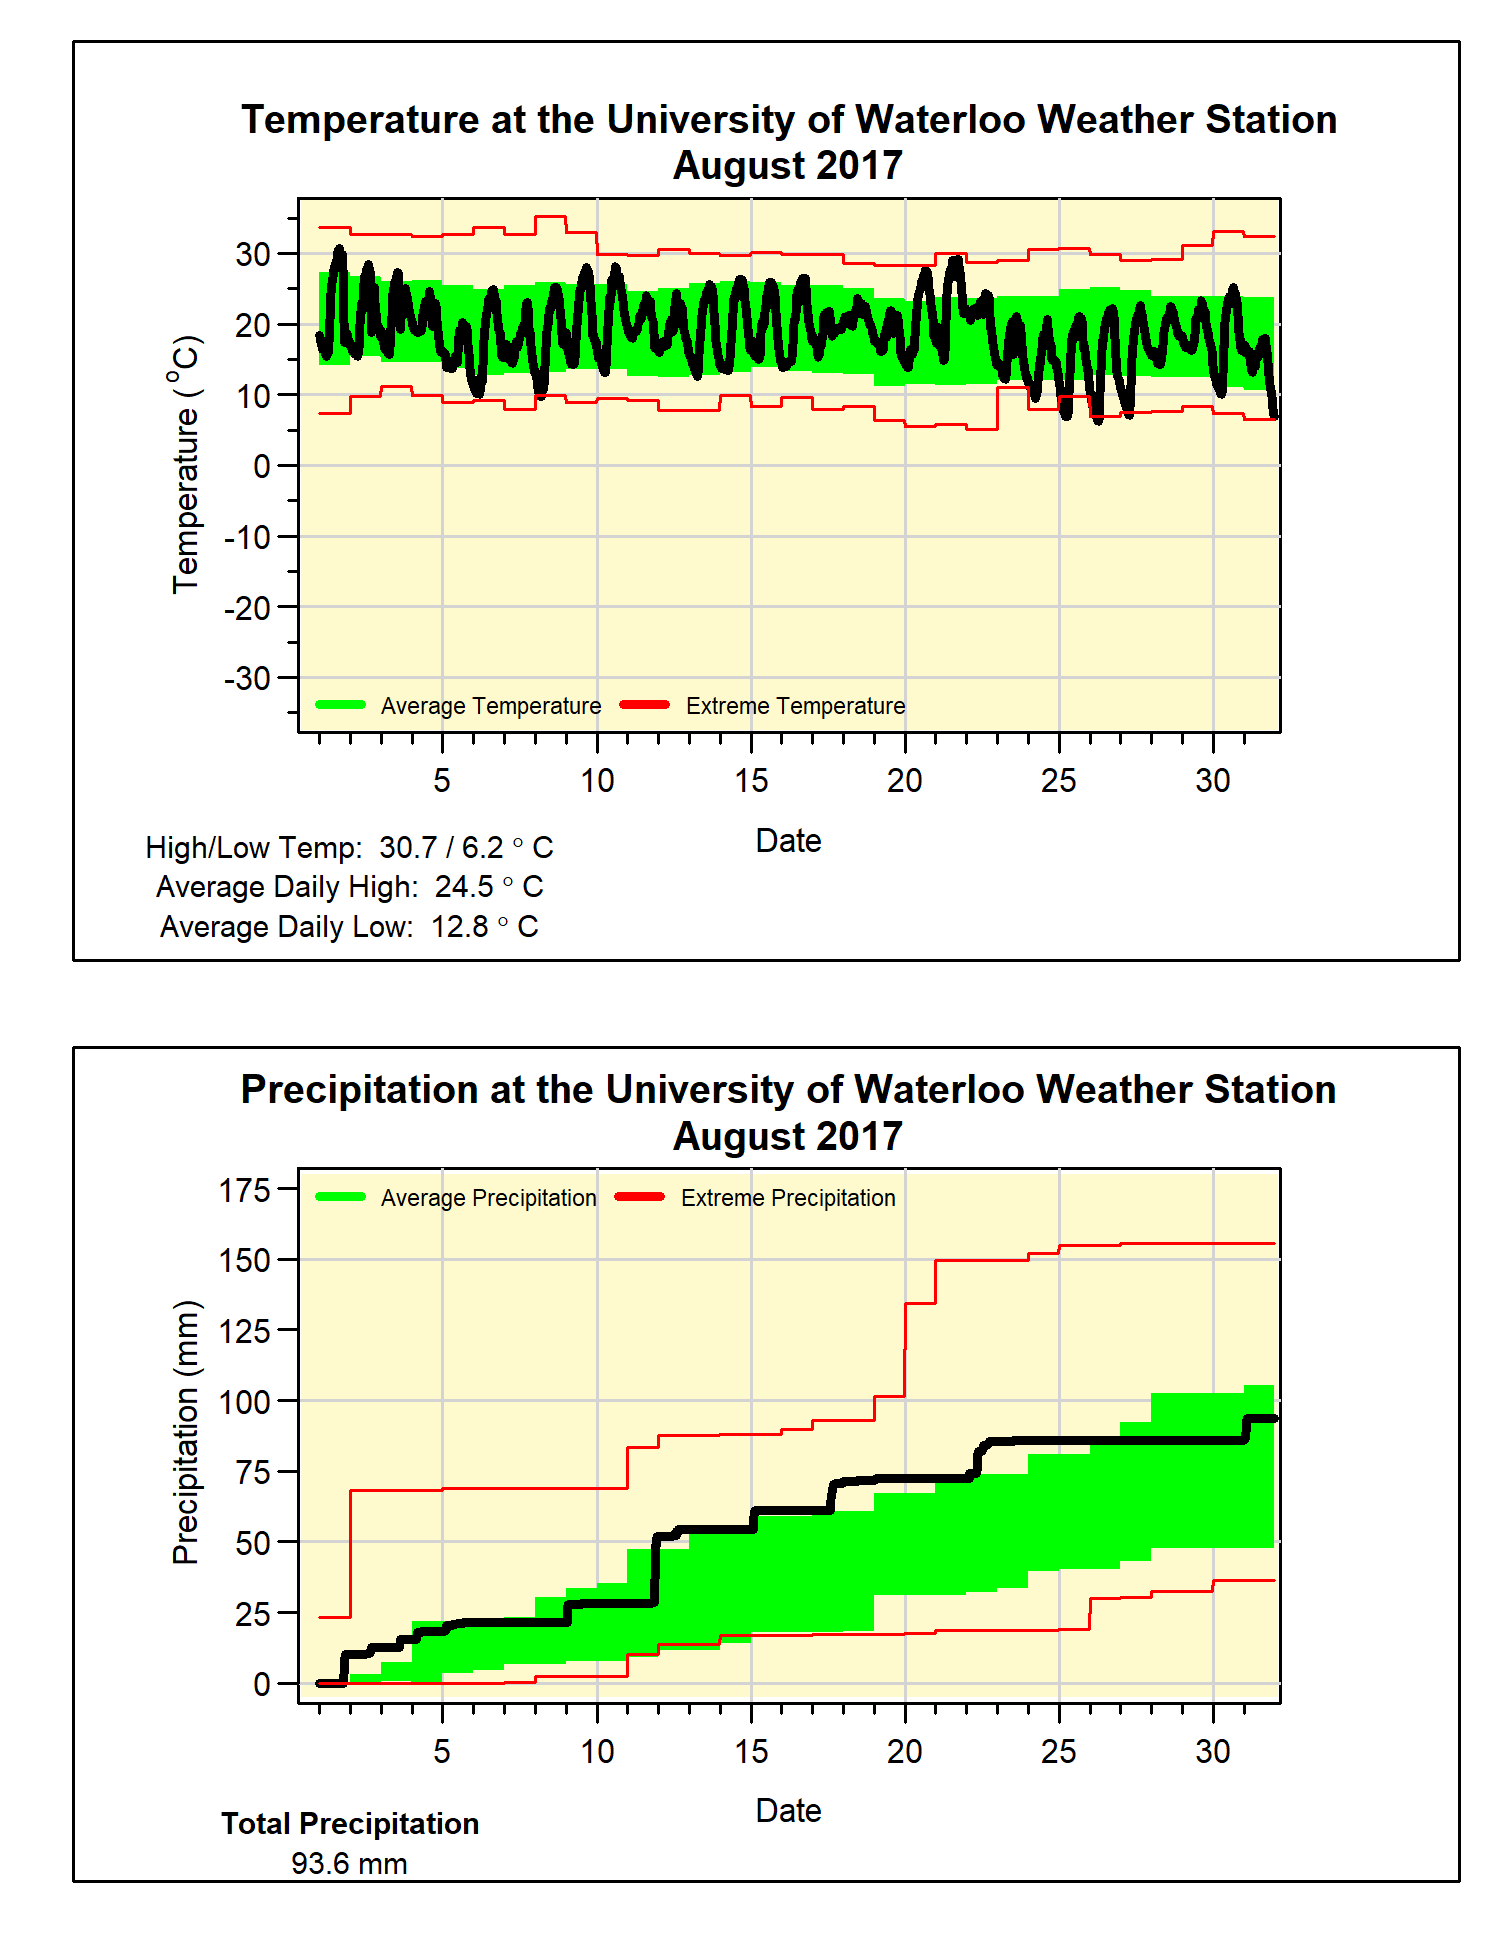
Summary for August 2017:
Maximum Temperature 30.7°C
Minimum Temperature 6.2°C
Average Daily High Temperature 24.5°C (Long term average 24.8°C)
Average Daily Low Temperature 12.9°C (Long term average 12.9°C)
Total Precipitation 93.6 mm (Long term average 83.9 mm)
(Long term averages based on 1981-2010 data for the Waterloo Wellington Airport)


No comments:
Post a Comment