University of Waterloo Weather Station Annual Summary - 2017
There weren’t that
many individual notable moments during 2017, but what was notable was how many
times there were consecutive days of interesting weather leading me to call
this the “year of streaks”. There is no
official measure of streaks so it can’t be said definitively that it was the
most ever, but it seemed like there were lots of them.
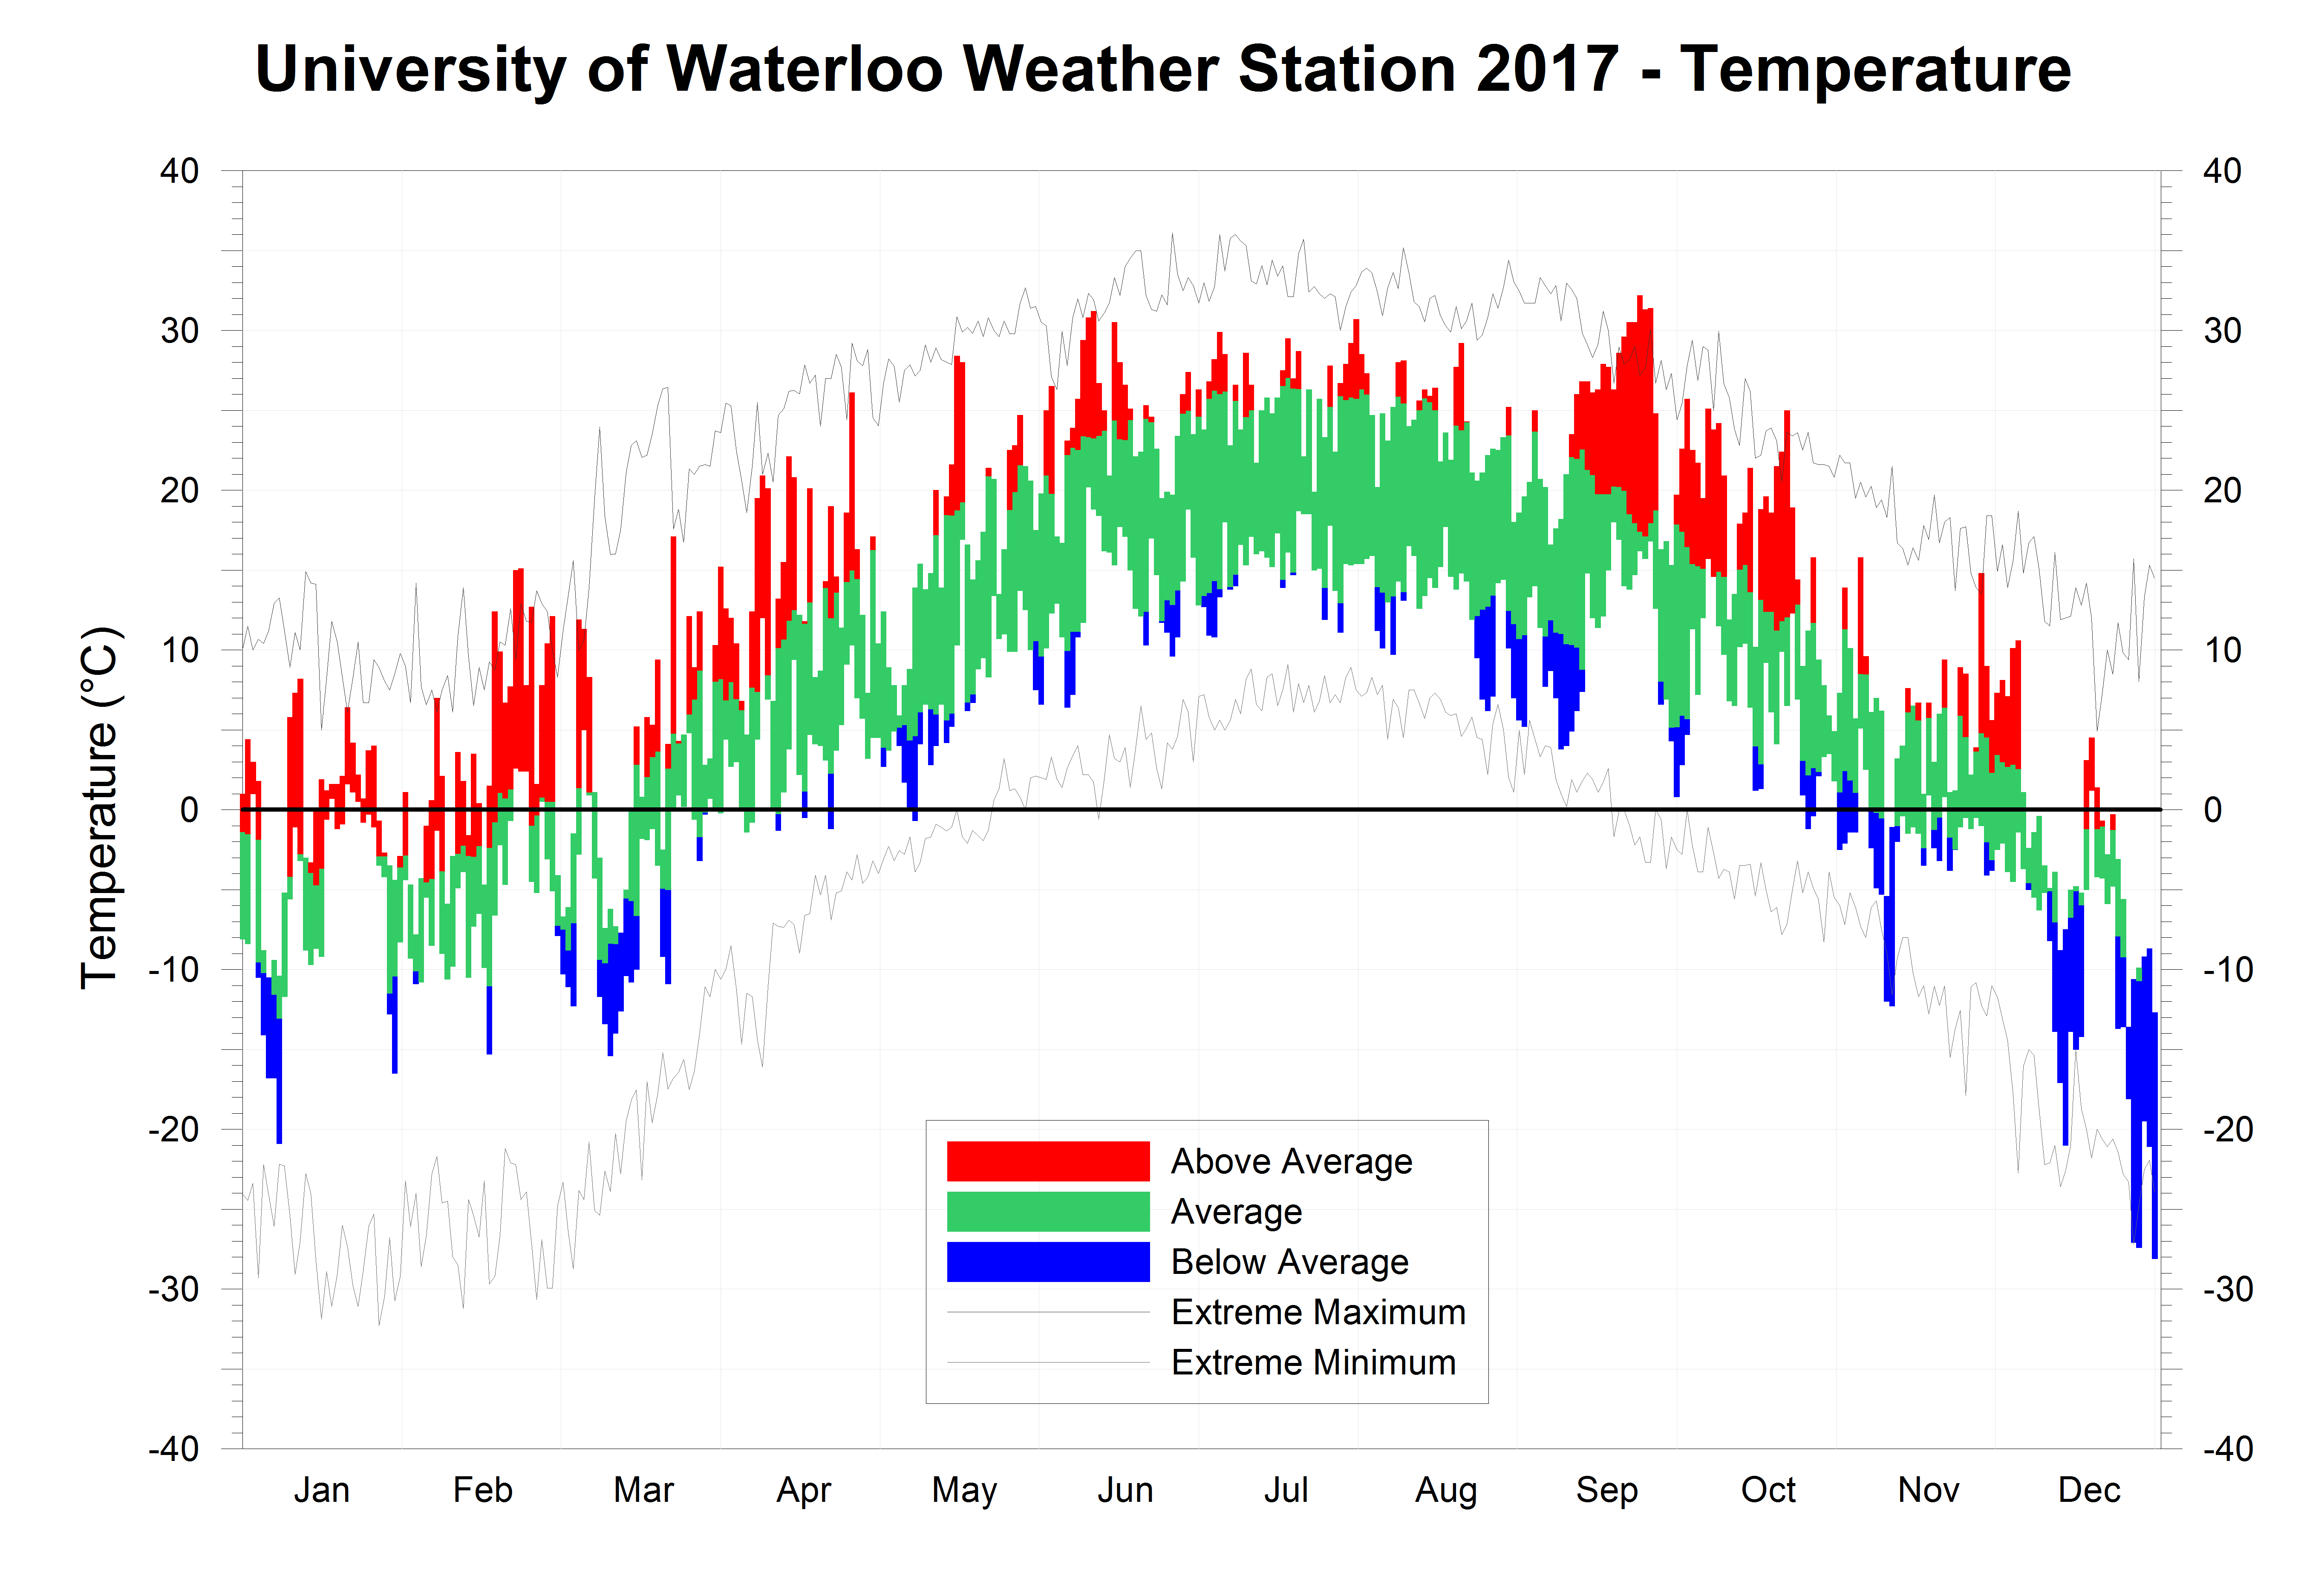
It started in
January when we saw 12 days in a row that went over 0 degrees, this is
something that we had not seen since 1944.
There were also a lot of days were the sun did not make an appearance,
leading me to invent something called “dreary” days and there were more of
these in January then in any other January in the history of the UW Weather
Station.
The next streak came
in February with another 12 days in a row above 0, something that hasn’t
happened in the over 100 years of weather data in the region and leading to it
being the warmest February we have seen.
Also notable was the high of 15.1°C on the 23rd which was
the highest February temperature we have ever seen in the region, while in
second place was the 15.0°C which happened the day before.
Then for only the 5th
time in 100 years March was colder then February followed by a warm April and
the see saw continued with a cold May.
The summer was generally very close to average with not a lot of really
hot or cold days.
It wasn’t till the end of September that we saw the longest
heat wave of the “summer”. The most
significant streak was the 15 days above 25°C between the 12th and
the 26th, which is something we have never seen before in September.
In October there were 12 days where the temperature was over
20°C, we haven’t seen that many since October 1971. But the most significant day was the 22nd
when the temperature topped out at 25°C, this was tied with 1947 as the latest
day of the year with a temperature above 25°C.
However, the cold
temperatures came back with a vengeance in December, the coldest one since
2000, that featured a streak of very cold days at the end that went into the
next year. It was so cold that
during the last 6 days of the month, the daily high temperatures didn’t even
get above the average daily low temperatures for those days.
Overall the year was
1.1 degrees above average, making it the tenth warmest we have seen in the
region.
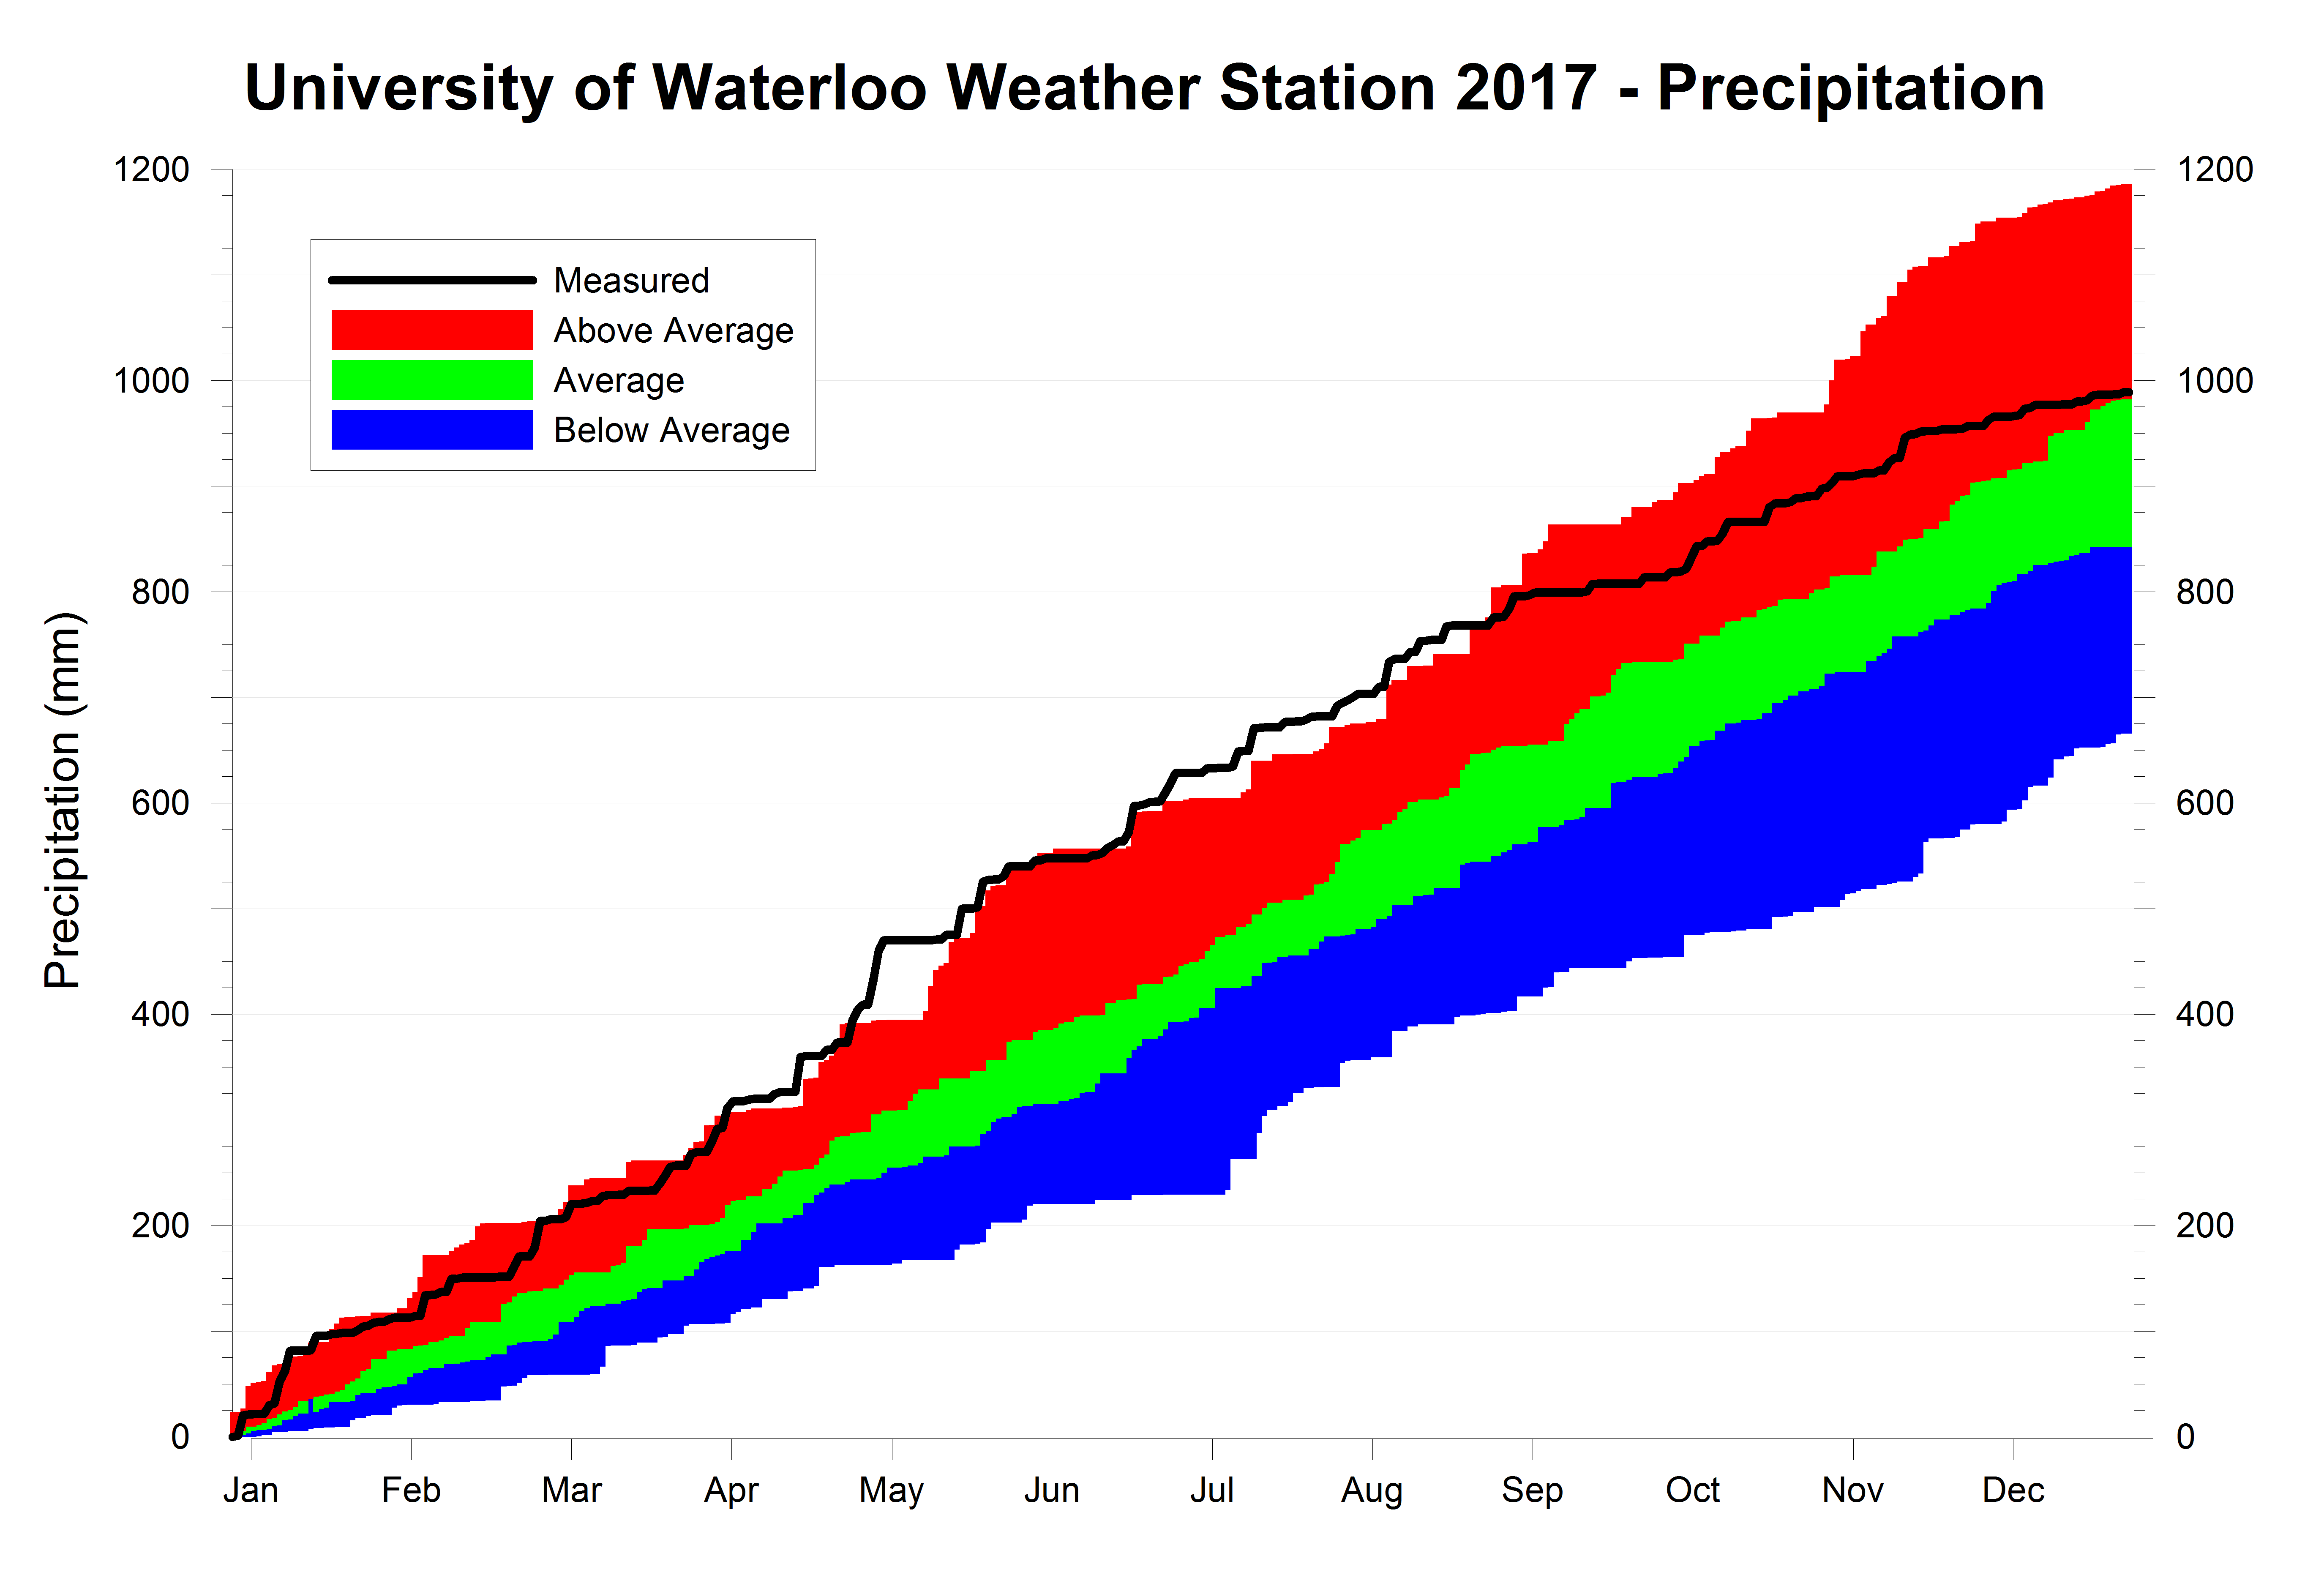
The first half of
the year was the second wettest on record, fueled by a very wet April followed
by an even wetter May. The rest of the
year was more or less average with the final total of 988.6 mm coming in just
within the above average range.
Average Daily High Temperature: 13.09°C (average 12.05ºC)
Average Daily Low Temperature: 3.20°C (average 1.94ºC)
Total Precipitation: 988.6 mm (average 916.3 mm)
(averages are calculated from 1981-2010 data for the Waterloo-Wellington Airport)
Click on the image below to see the temperature chart:
Click on the image below to see the precipitation chart:


No comments:
Post a Comment