Wednesday, September 2, 2015

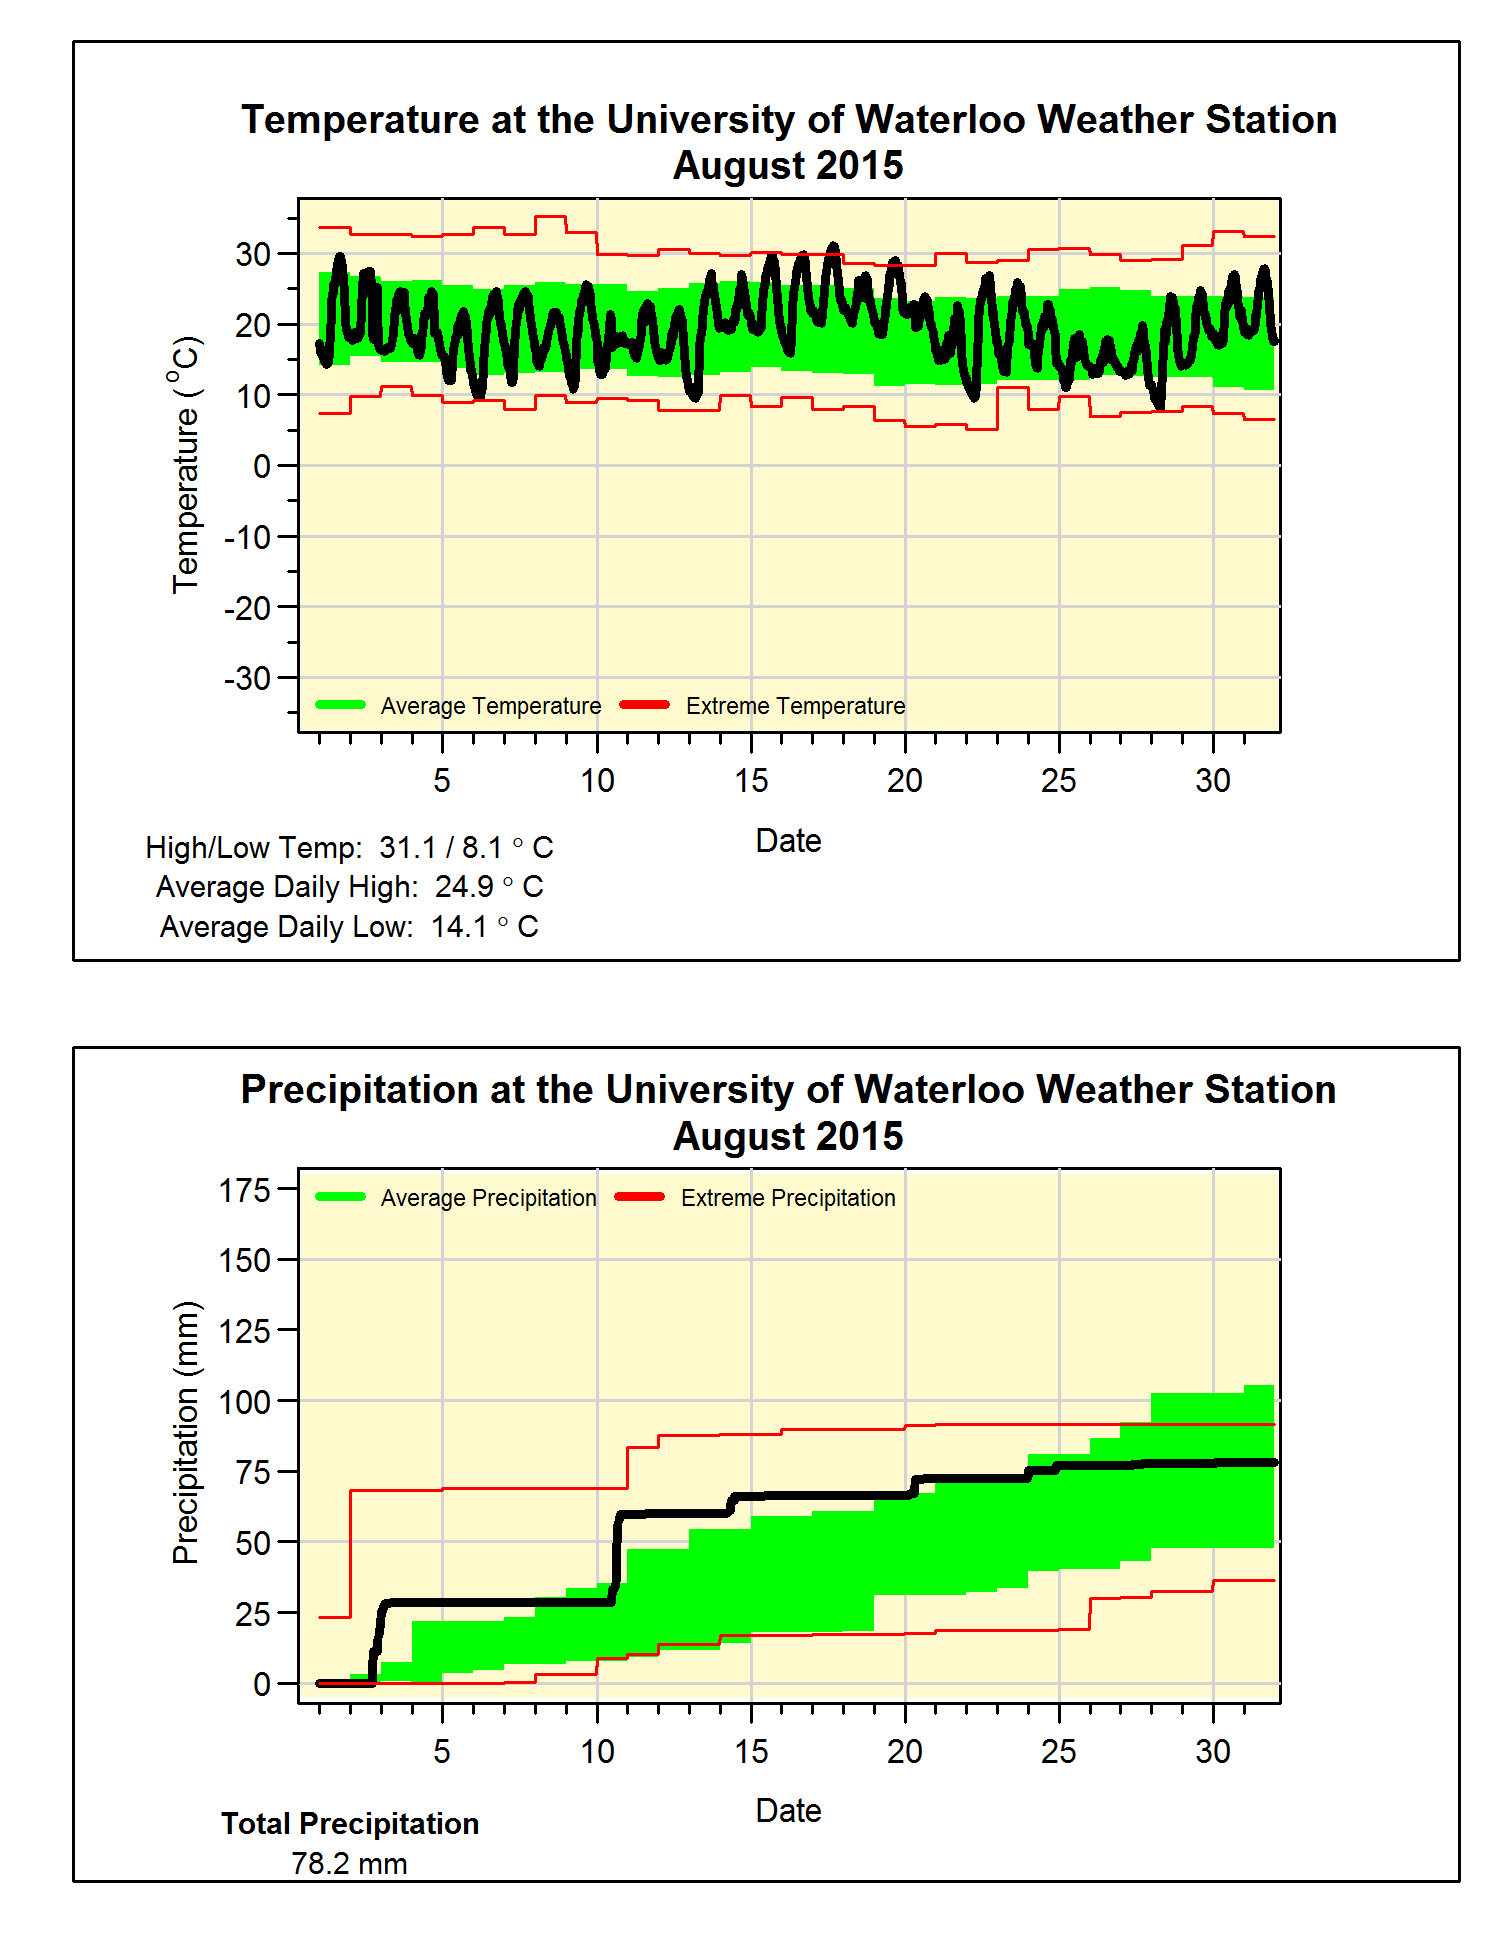
August 2015 Summary

An average August for both temperature and precipitation

Even though we had 3 days in a row where the high temperature didn’t go above 20°C (the first time that has happened in August since 2000), overall it was a little over half a degrees hotter than average which is on the high end of the average range.  As sometimes happens, there was a big difference between the daily high temperature (just 0.2 degrees above average) and the daily low temperature (1.2 degrees above average).

About 60 mm of the month’s 78.2 mm of precipitation came during the first 10 days of the month and most of that came during just 2 days (23.0 mm on the 2nd and 31.2 mm on the 10th).  It has been pretty dry since then, but it was enough to make the total close to the average of 83.9 mm.

This pretty average month kept the total precipitation for the year (516.4 mm) pretty much the same distance from what we would expect at this time of year (596.0 mm).


Summary for August 2015:
Maximum Temperature 31.1°C
Minimum Temperature 8.1°C
Average Daily High Temperature 25.0°C (Long term average 24.8°C)
Average Daily Low Temperature 14.1°C (Long term average 12.9°C)
Total Precipitation 78.2 mm (Long term average 83.9 mm)

(Long term averages based on 1981-2010 data for the Waterloo Wellington Airport)

Thursday, August 6, 2015

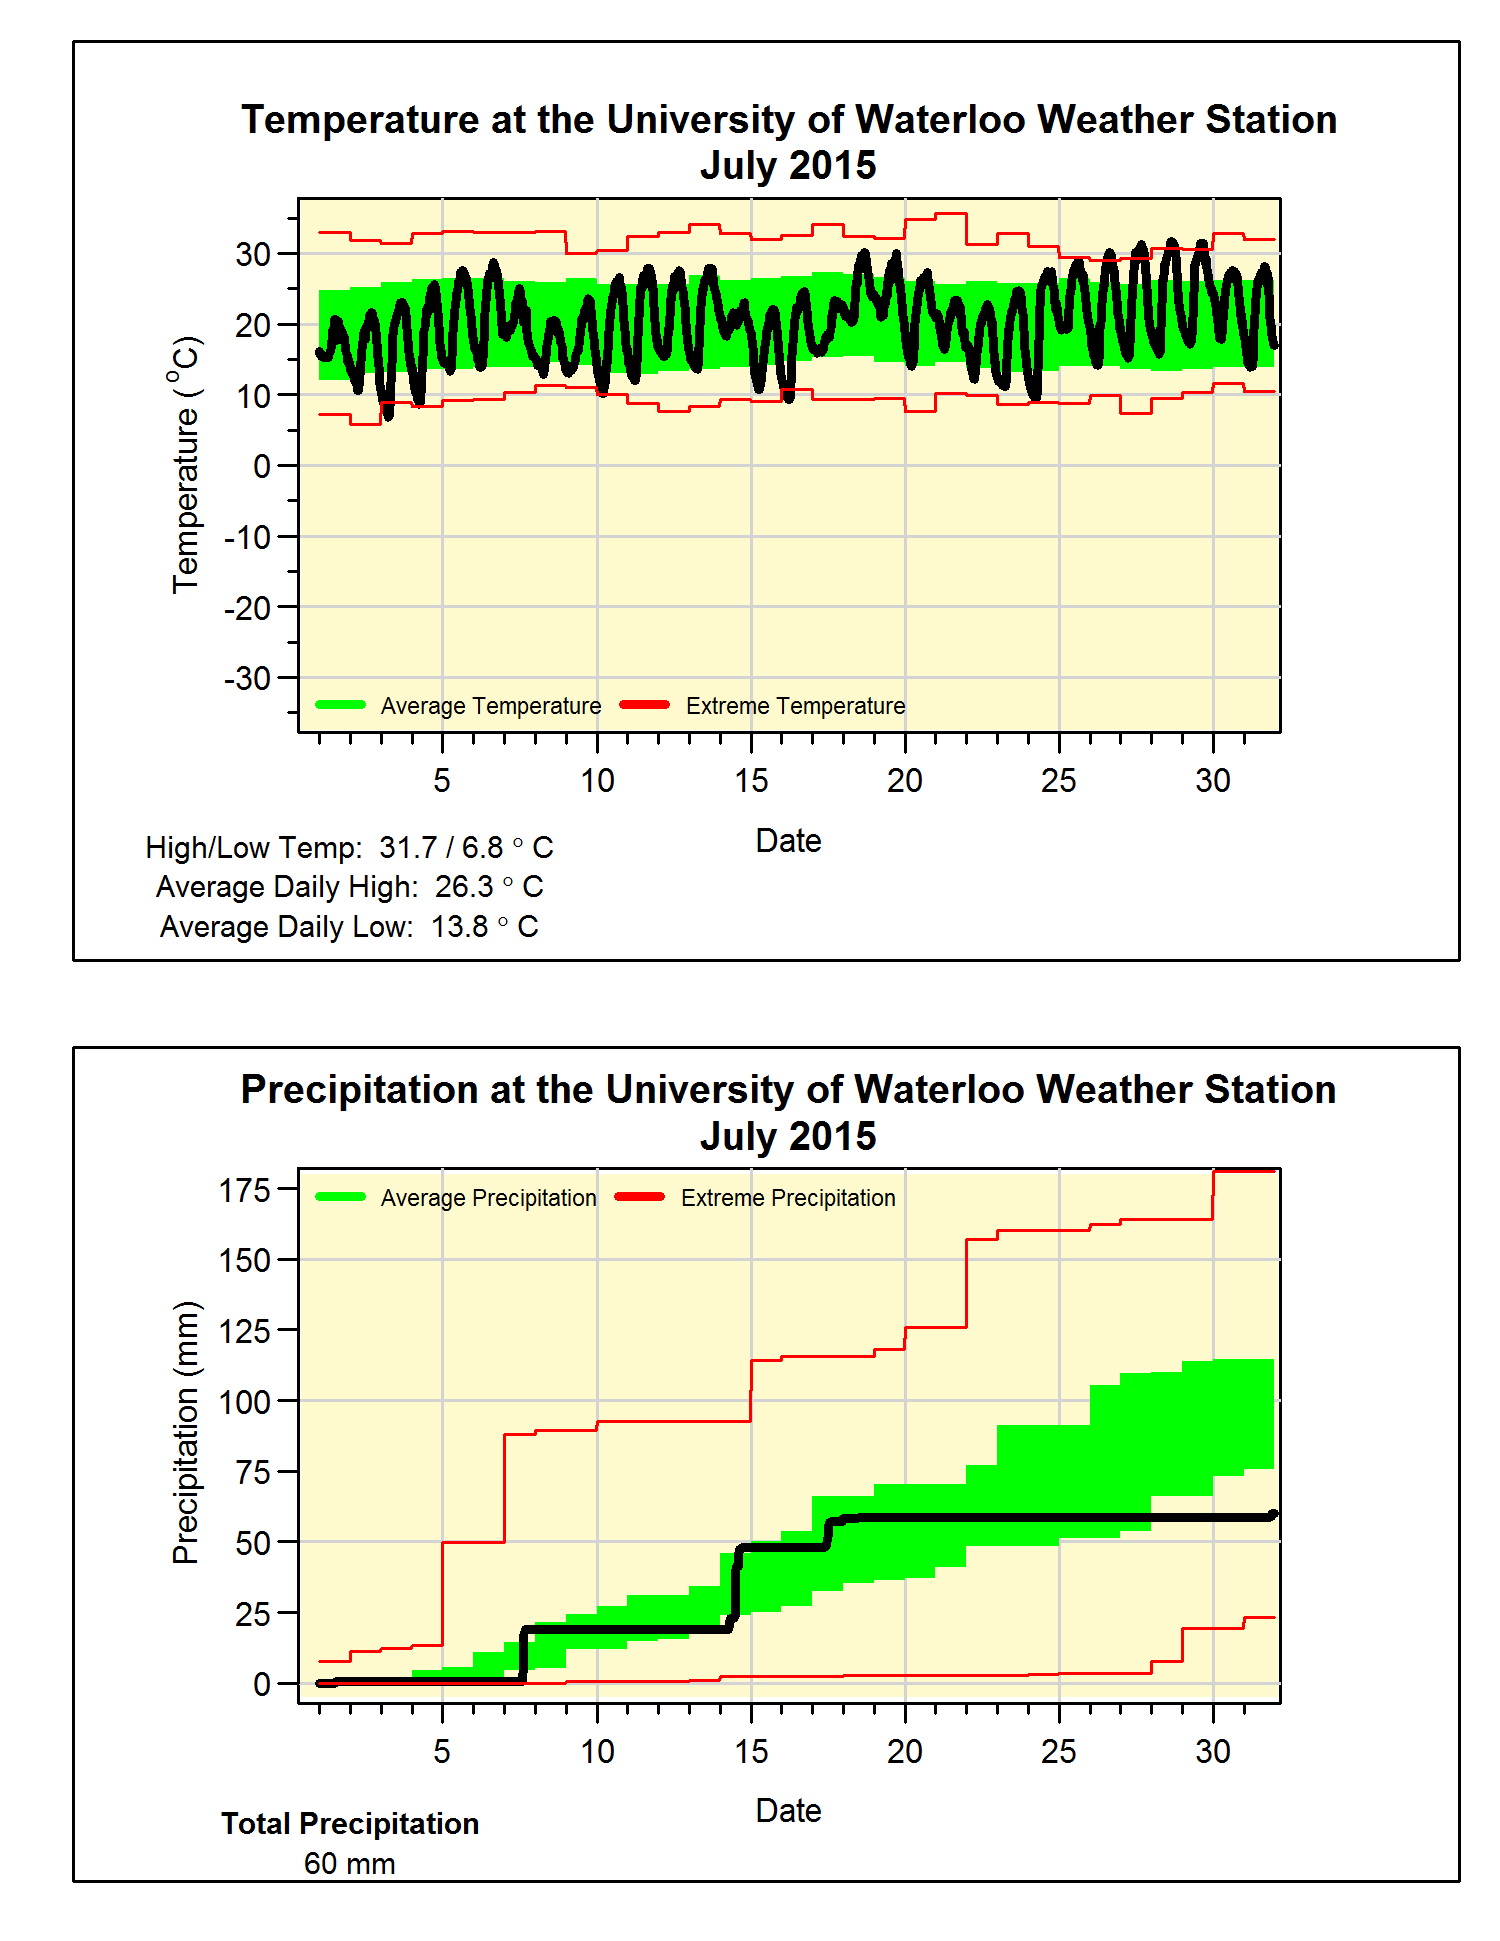
July 2015 Summary

July was dry with average temperature

Even with the mini-heatwave we saw at the end of July with 4 days over 30°C, for the second month in a row it was a very average month for temperature, coming in again as just 0.1 degrees above average.    These 4 days over 30°C might have felt like something significant, but it is something we have seen in over half of the last 30 years.

Also interesting was that the low of 6.8°C on the 3rd was the lowest July temperature since 2001.

The first half of the month was a pretty average for precipitation, but then the tap was shut off with only 1.6 mm after the 18th.  This caused the total for the month (60.0 mm) to be well below the average (98.6 mm).

A dry month meant that the total for the year so far (438.2 mm) fell further away from the average (509.0 mm).


Summary for July 2015:
Maximum Temperature 31.7°C
Minimum Temperature 6.8°C
Average Daily High Temperature 26.3°C (Long term average 26.0°C)
Average Daily Low Temperature 13.8°C (Long term average 14.0°C)

Total Precipitation 60.0 mm (Long term average 98.6 mm)


(Long term averages based on 1981-2010 data for the Waterloo Wellington Airport) 


Thursday, July 2, 2015

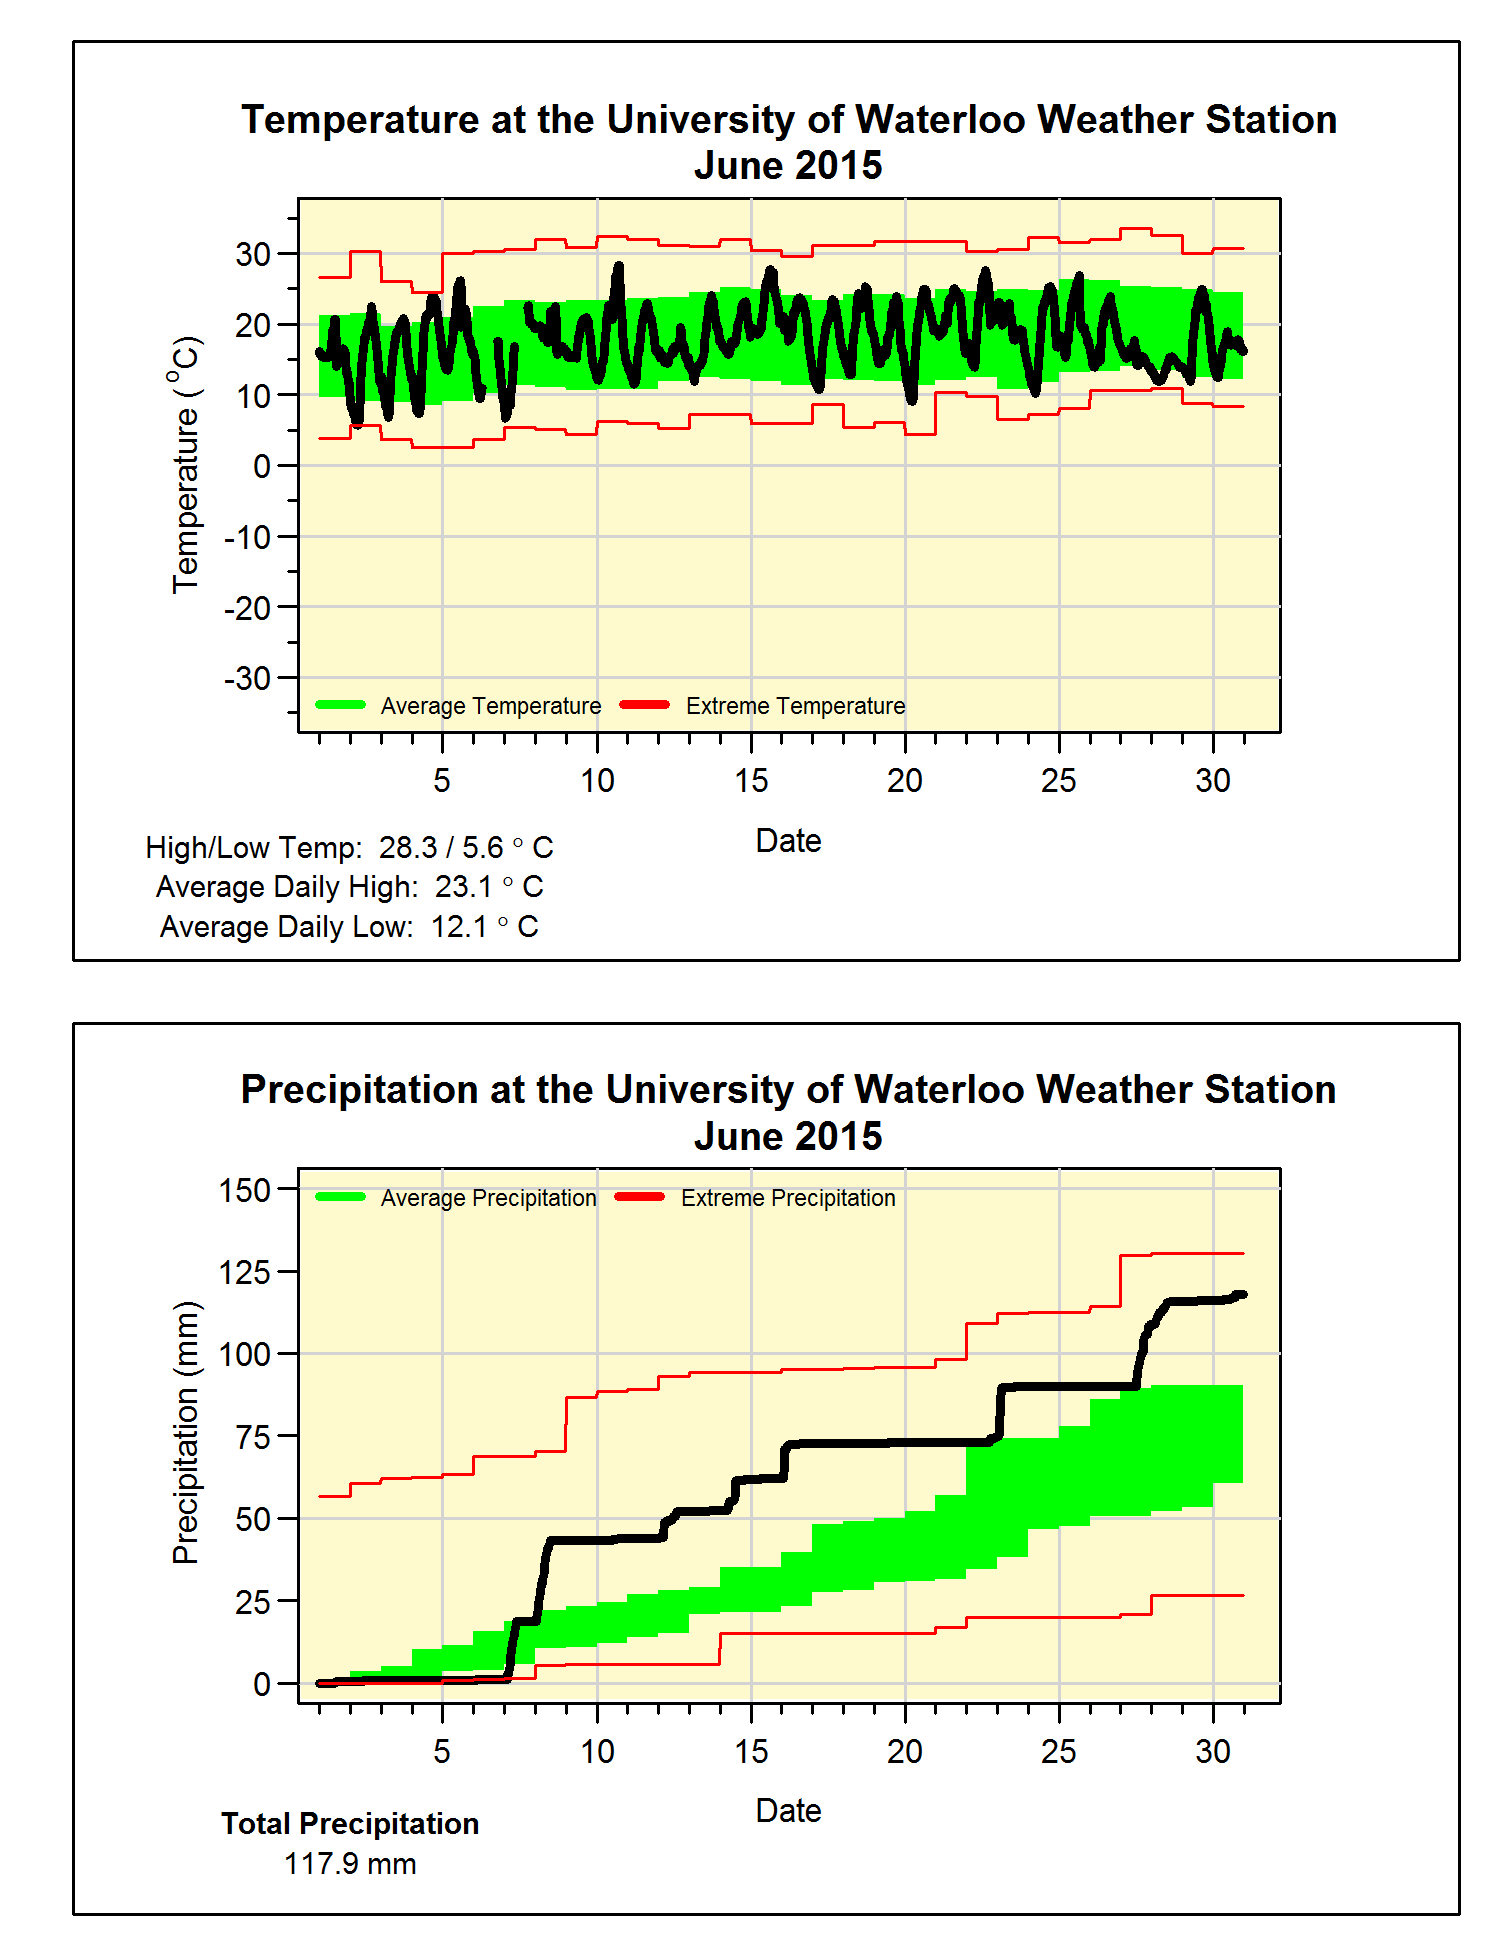
June 2015 Summary

A very wet June with average temperature

About as average of a month for temperature as you can have with just a few colder and a few warmer than average days.  Overall, it was a mere 0.1 degree above average, but this was still the coldest June we have seen in the region since 2009.

It was a very wet month with 4 days over 15.0 mm along with 18 days of some precipitation compared to the average of 11.5.  The total of 117.9 mm was much more than the long-term average of 82.4 mm well outside the average range, but we only have to go back to a couple of years to find a wetter month of June.  Another interesting thing that I found out was that it is month of extremes, in the last 10 years only once has the total precipitation been in the average range, the rest were either very dry or very wet.  

This soggy month put the total precipitation we have seen this year (378.2 mm) closer to the average (416.1 mm).


Summary for June 2015:
Maximum Temperature 28.3°C
Minimum Temperature 5.6°C
Average Daily High Temperature 23.1°C (Long term average 23.6°C)
Average Daily Low Temperature 12.1°C (Long term average 11.5°C)
Total Precipitation 117.9 mm (Long term average 82.4 mm)


(Long term averages based on 1981-2010 data for the Waterloo Wellington Airport) 

Thursday, June 18, 2015

May 2015 Summary

A very warm May with just barely average precipitation

Although it went below zero a couple of times during the month, overall it was three and half degrees higher than average making it the warmest May since 1998.  This was also the first warmer than average month we have seen this year.

Up until the last 2 days of the month it was looking like this May might have been one of the driest every recorded in the region.  However, the almost 50 mm in those last 2 days managed to get the total (61.6 mm) just into the bottom end of the average range.

The total precipitation for the year so far (260.3 mm) is still considerably less than the average for this time of year (337.7 mm).


Summary for May 2015:
Maximum Temperature 30.4°C
Minimum Temperature -0.8°C
Average Daily High Temperature 22.6°C (Long term average 18.5°C)
Average Daily Low Temperature 9.0°C (Long term average 6.1°C)

Total Precipitation 61.6 mm (Long term average 82.3 mm)
(Long term averages based on 1981-2010 data for the Waterloo Wellington Airport)
Sunday, May 10, 2015

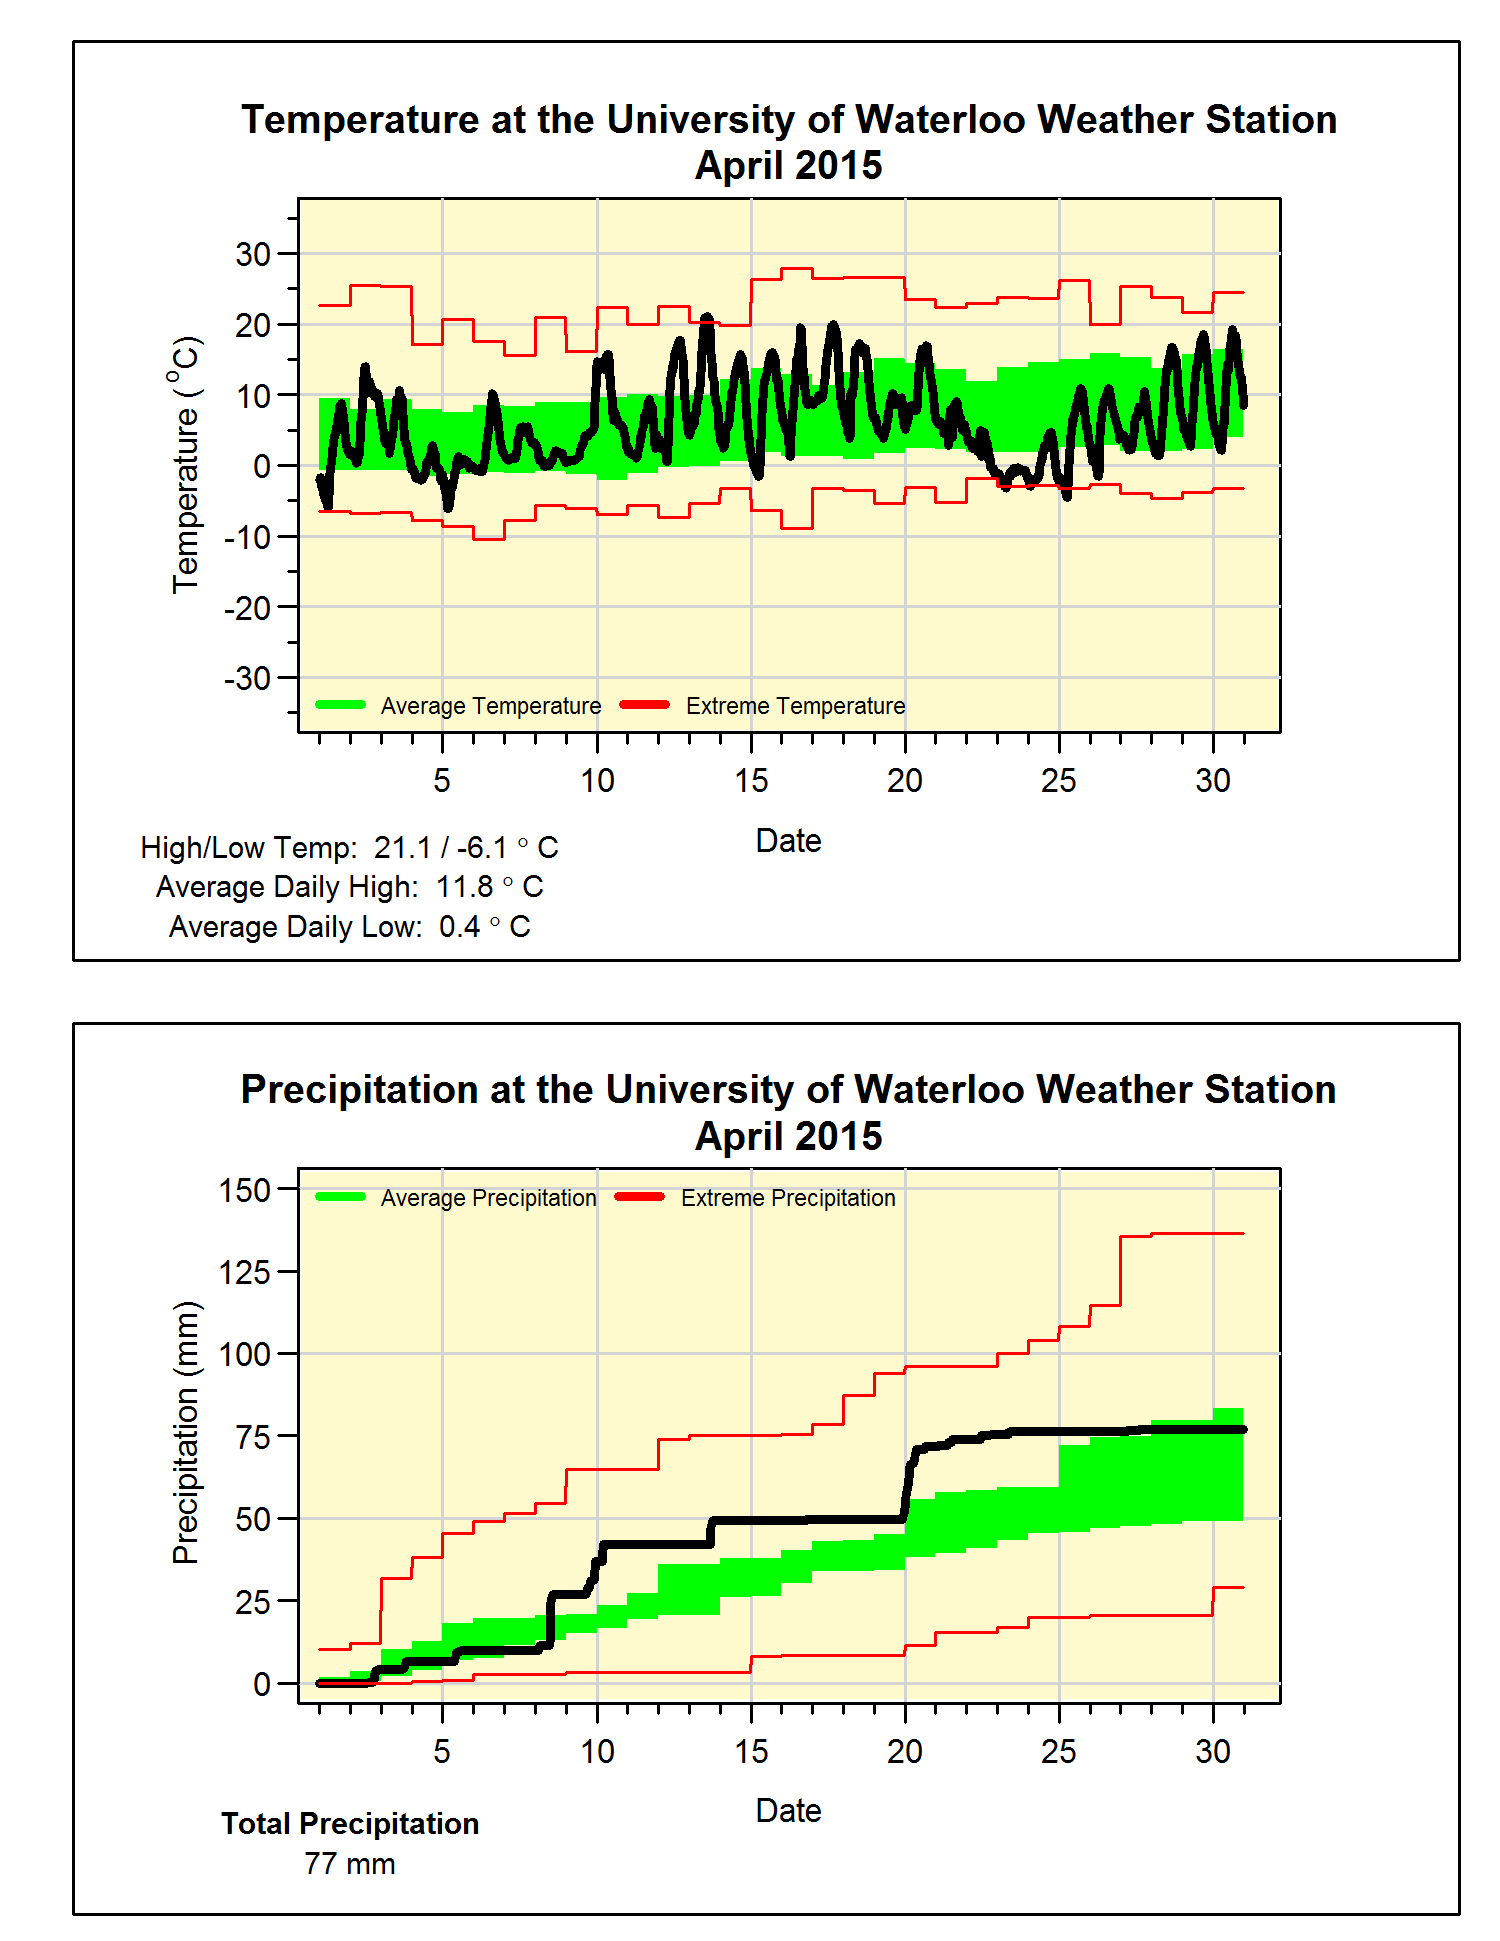
April 2015 Summary


A very average April for both temperature and precipitation

There were quite a few really warm days during the month, but these were offset by a cold spell during the last half of the month.  It was an average month for temperature as the overall temperature was just 0.1 degrees below the average and the first month of the year that wasn’t in the colder than average range.

It was also a pretty typical April for precipitation with a just few storms here and there.  The 77.0 mm we saw was a bit higher that the average of 74.5 mm, but still within the average range.

A close to average month for precipitation means that we didn’t really close the gap between what we have seen so far this year (198.7 mm) and that we would expect at this point in the year (264.4 mm).

I’m hoping it is now safe to call an end to the 2014-15 snowfall season, with April adding 3 cm, the total for the season was 127.5 cm.  This is a lot less than the average of 159.7 cm and the lowest total since 2011-12.  I would like to thank our snow measurement volunteers Melinda, Eric, Stephen, and Dave.


Summary for April 2015:
Maximum Temperature 21.1°C
Minimum Temperature -6.1°C
Average Daily High Temperature 11.8°C (Long term average 11.5°C)
Average Daily Low Temperature 0.4°C (Long term average 0.8°C)
Total Precipitation 77.0 mm (Long term average 74.5 mm)

(Long term averages based on 1981-2010 data for the Waterloo Wellington Airport)