A very warm fall that was also the wettest on record
The fall was over 2.5 degrees warmer than average, the heat was very consistent throughout the entire season except for a relatively cool week at the end of October. But even for that week it was only 3 or 4 degrees colder than average compared too many days that were more than 5 degrees warmer throughout the fall. However, as we have seen many warm falls in the recent past, we only have to go back to 2001 to find one that was hotter.
It was a very wet fall with 349.2 mm of total precipitation compared to the average of only 218.1 mm. This was the highest fall precipitation I could find, just beating out 1955 which had 339.5 mm.
There was only 5 cm of snow recorded this fall which is much less than the average of 30 cm. The fall of 1998 was the last time we have seen anything like this, as that year we only had 2 cm.
Summary for Fall 2011:
Maximum Temperature 26.7 °C
Minimum Temperature -9.7 °C
Average Daily High Temperature 10.7 °C (Long term average 8.3 °C)
Average Daily Low Temperature 2.5 °C (Long term average -0.5 °C)
Total Precipitation 349.2 mm (Long term average 218.1 mm)
(Long term averages based on 1970-2000 data for the Waterloo Wellington Airport)
Sign up to get the monthly weather station summary by e-mail
Friday, December 23, 2011

Tuesday, December 6, 2011
November 2011 Summary
The 5th warmest November on record that was also wetter than average
It was another warm month at an incredible 3.6 degrees higher than average. You have to go back to October of 2007 to find a month that was this much above average. As well, it was the warmest November since 2001 and the 5th warmest since records began in the region (the warmest was 1931 at 4.3 degrees above average).
Up until the last couple of days of the month it was looking like a dry month, however an amazing 51 mm on the 29th put us in the above average range. The final total was 106.6 mm compared to an average of 82.3 mm.
There has now been 1047.6 mm of precipitation this year, well over the average of 932.9 mm and the third most ever recorded for the end of November. However, we will have to get over 140 mm in December to beat the all time annual record.
Summary for November 2011:
Maximum Temperature 17.7°C
Minimum Temperature -4.6°C
Average Daily High Temperature 9.8°C (Long term average 5.6°C)
Average Daily Low Temperature 1.6°C (Long term average -1.6°C)
Total Precipitation 106.6 mm (Long term average 82.3 mm)
(Long term averages based on 1971-2000 data for the Waterloo Wellington Airport)
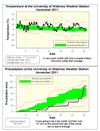
It was another warm month at an incredible 3.6 degrees higher than average. You have to go back to October of 2007 to find a month that was this much above average. As well, it was the warmest November since 2001 and the 5th warmest since records began in the region (the warmest was 1931 at 4.3 degrees above average).
Up until the last couple of days of the month it was looking like a dry month, however an amazing 51 mm on the 29th put us in the above average range. The final total was 106.6 mm compared to an average of 82.3 mm.
There has now been 1047.6 mm of precipitation this year, well over the average of 932.9 mm and the third most ever recorded for the end of November. However, we will have to get over 140 mm in December to beat the all time annual record.
Summary for November 2011:
Maximum Temperature 17.7°C
Minimum Temperature -4.6°C
Average Daily High Temperature 9.8°C (Long term average 5.6°C)
Average Daily Low Temperature 1.6°C (Long term average -1.6°C)
Total Precipitation 106.6 mm (Long term average 82.3 mm)
(Long term averages based on 1971-2000 data for the Waterloo Wellington Airport)
Monday, October 24, 2011
Longest frost free season ever seen
On the morning of October 23rd at 4:45 am the temperature went below zero for the first time since the spring. It stayed below zero for almost 4 hours with the lowest temperature being -0.9°C.
The bigger news is that by my calculations the frost free season went from May 1st to October 22nd this year which is a total of 175 days. This is the longest frost free season I have been able to find since records began in the region in 1915. This year just beat out 1941 when they had a stretch of 174 days above zero.
For full disclosure I just want to mention that there isn't enough data for 1937 and 1938 to be included in the analysis.
The bigger news is that by my calculations the frost free season went from May 1st to October 22nd this year which is a total of 175 days. This is the longest frost free season I have been able to find since records began in the region in 1915. This year just beat out 1941 when they had a stretch of 174 days above zero.
For full disclosure I just want to mention that there isn't enough data for 1937 and 1938 to be included in the analysis.
Thursday, October 20, 2011
Wettest day in over a year
The 51.6 mm of rain in the 24 hours between 8 am on the 19th and 20th was the single wettest day we have had since July 23rd, 2010 when we had 62.5 mm.
Thursday, October 6, 2011
September 2011 Summary
Another hot month with average precipitation
With an average temperature that was 1.8 degrees above average, September was the third hotter than average month in a row. But it certainly wasn't consistent warm as the month was a battle between the cold arctic air masses and hotter air from the south. As a result we saw some drastic temperature changes such as a high of 30.5 C on the third and then a high of only 15.5 C two days later.
The precipitation for September was within the average range (95.3 mm compared to an average of 87.5 mm) even though there were 17 days with some measured precipitation, which is more than the average of 12. There were a couple of days with over 20 mm (the 19th and 27th) while the rest of it was was spread over many days with a bit of precipitation here and there.
The total precipitation at the end of September is 799.3 mm, which is still above the average of 680.7 mm for the end of the month.
Summary for September 2011:
Maximum Temperature 30.5°C
Minimum Temperature 3.5°C
Average Daily High Temperature 20.8°C (Long term average 20.0°C)
Average Daily Low Temperature 11.1°C (Long term average 8.3°C)
Total Precipitation 95.3 mm (Long term average 87.5 mm)
(Long term averages based on 1971-2000 data for the Waterloo Wellington Airport)
With an average temperature that was 1.8 degrees above average, September was the third hotter than average month in a row. But it certainly wasn't consistent warm as the month was a battle between the cold arctic air masses and hotter air from the south. As a result we saw some drastic temperature changes such as a high of 30.5 C on the third and then a high of only 15.5 C two days later.
The precipitation for September was within the average range (95.3 mm compared to an average of 87.5 mm) even though there were 17 days with some measured precipitation, which is more than the average of 12. There were a couple of days with over 20 mm (the 19th and 27th) while the rest of it was was spread over many days with a bit of precipitation here and there.
The total precipitation at the end of September is 799.3 mm, which is still above the average of 680.7 mm for the end of the month.
Summary for September 2011:
Maximum Temperature 30.5°C
Minimum Temperature 3.5°C
Average Daily High Temperature 20.8°C (Long term average 20.0°C)
Average Daily Low Temperature 11.1°C (Long term average 8.3°C)
Total Precipitation 95.3 mm (Long term average 87.5 mm)
(Long term averages based on 1971-2000 data for the Waterloo Wellington Airport)
Subscribe to:
Posts (Atom)


 Posts
Posts

