Saturday, March 2, 2019

February 2019 Summary


A snowy February with average temperatures

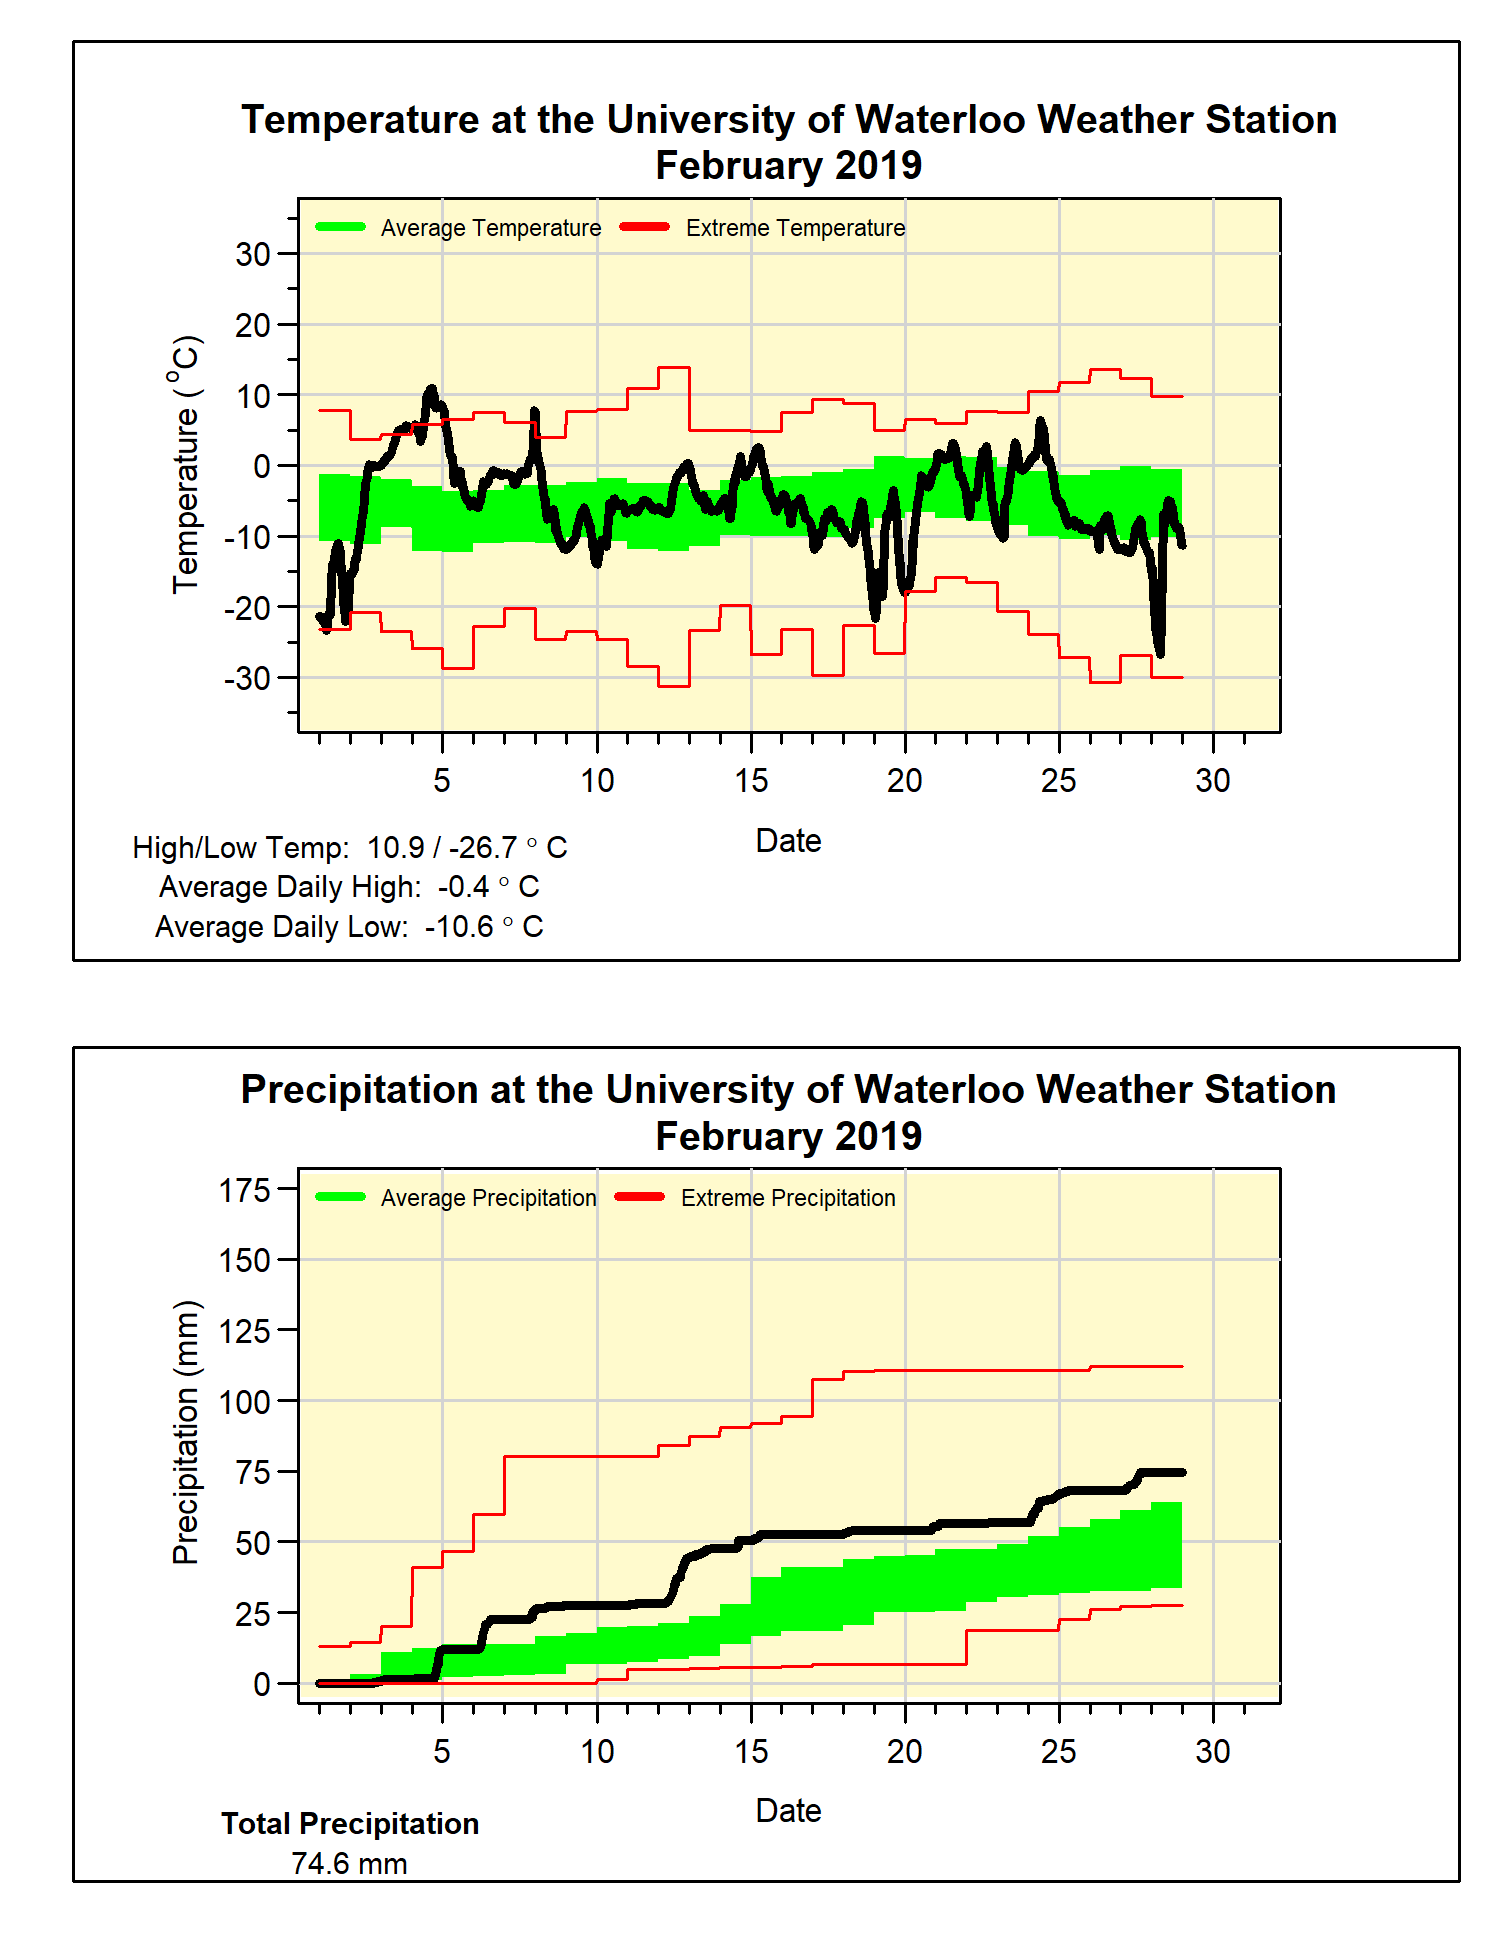
The month saw some dramatic temperature swings, starting with some lows below -20°C followed a couple of days later with a high above 10°C.  Then a week of colder than average temperatures was followed by almost a week of highs above zero.  Cold weather returned at the end of February with its coldest temperature of -26.7°C.

As often happens in a month with temperature swings like this, everything balances out and the overall temperature comes out to being about average, this happened in February with the overall temperature coming in at just 0.05 degrees below the average.

Not only was the total precipitation amount of 74.6 mm well above the average of 54.9 mm, there were also 20 days that showed some precipitation.  This is the highest number of days of precipitation in February since 2003.

A series of storms brought a lot of snow during February, 41.5 cm of snow fell which is much more than the average of 30.3 cm.  However, as we had a slow start to the snowfall season, even with this snowy month, the total we have seen far of 116.5 cm is still below the average of 125.6 for this point in the season.

Finally, if you haven’t already, there is still time to enter the annual UW Weather Station Contest.  We are looking for your guess for the first time the temperature will go above 20°C this spring.  Find out all the details and enter here: http://weather.uwaterloo.ca/contest/contest.html


Summary for February 2019:
Maximum Temperature 10.9°C
Minimum Temperature -26.7°C
Average Daily High Temperature -0.4°C (Long term average -1.2°C)
Average Daily Low Temperature -10.6°C (Long term average -9.7°C)
Total Precipitation 74.6 mm (Long term average 54.9 mm)
(Long term averages based on 1981-2010 data for the Waterloo-Wellington Airport)


Friday, February 1, 2019

January 2019 Summary


A cold January with average precipitation 

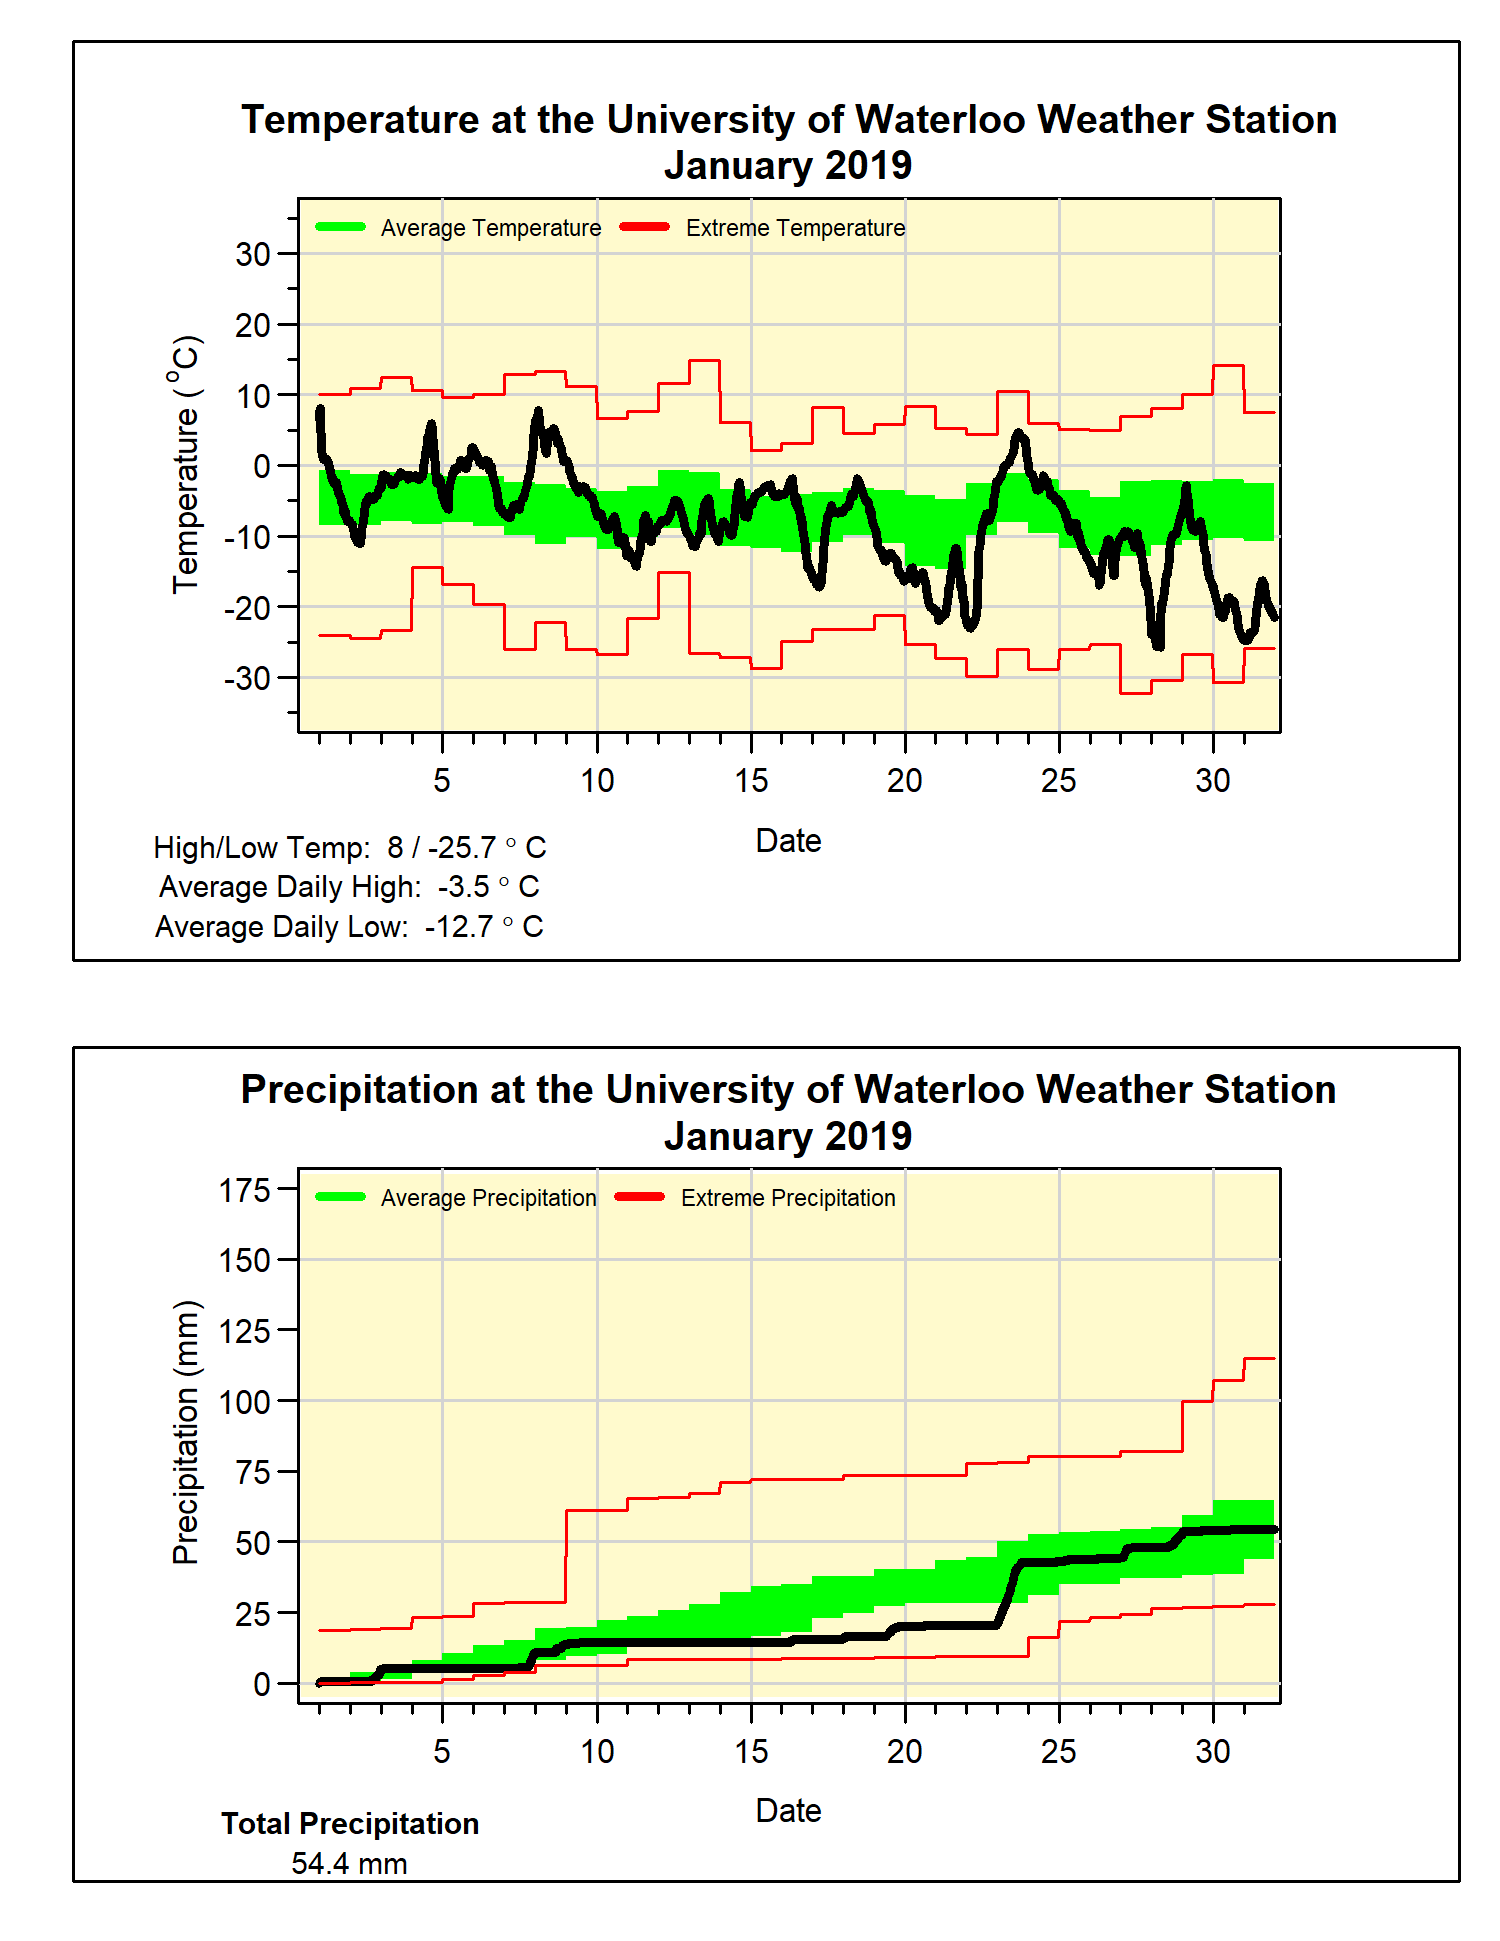
January was a month that had a lot of variations, there were days much above average in the beginning of the month and many much below average in the second half.  In fact, over half of the days of the month were 5 degrees or more either above or below the average.

The very cold end of the month brought the overall average temperature down to 1.7 degrees below average.  The high temperature on the 30th only got up to -17.2°C, this was the lowest daily high temperature since Feb 19, 2015 and only the 10th time there was such a cold day in the last 50 years.

The total precipitation that fell was 54.4 mm, less than the average of the 65.2 mm but within the above average range.  We had 40.5 cm of snowfall in January, which is just a little less than the average of 43.7 cm for the month.  The total snowfall since the beginning of the fall is 75 cm, this is less than the average of 95.3 cm for this point in the snowfall season.

Summary for January 2019:
Maximum Temperature 8.0°C
Minimum Temperature -25.7°C
Average Daily High Temperature -3.5°C (Long term average -2.6°C)
Average Daily Low Temperature -12.7°C (Long term average -10.3°C)
Total Precipitation 54.4 mm (Long term average 65.2 mm)

(Long term averages based on 1981-2010 data for the Waterloo-Wellington Airport)


Saturday, January 12, 2019

2018 Summary

University of Waterloo Weather Station Annual Summary - 2018

Missing Seasons Alert!
If anyone knows the whereabouts of the Spring and Fall of 2018
please contact the UW Weather Station

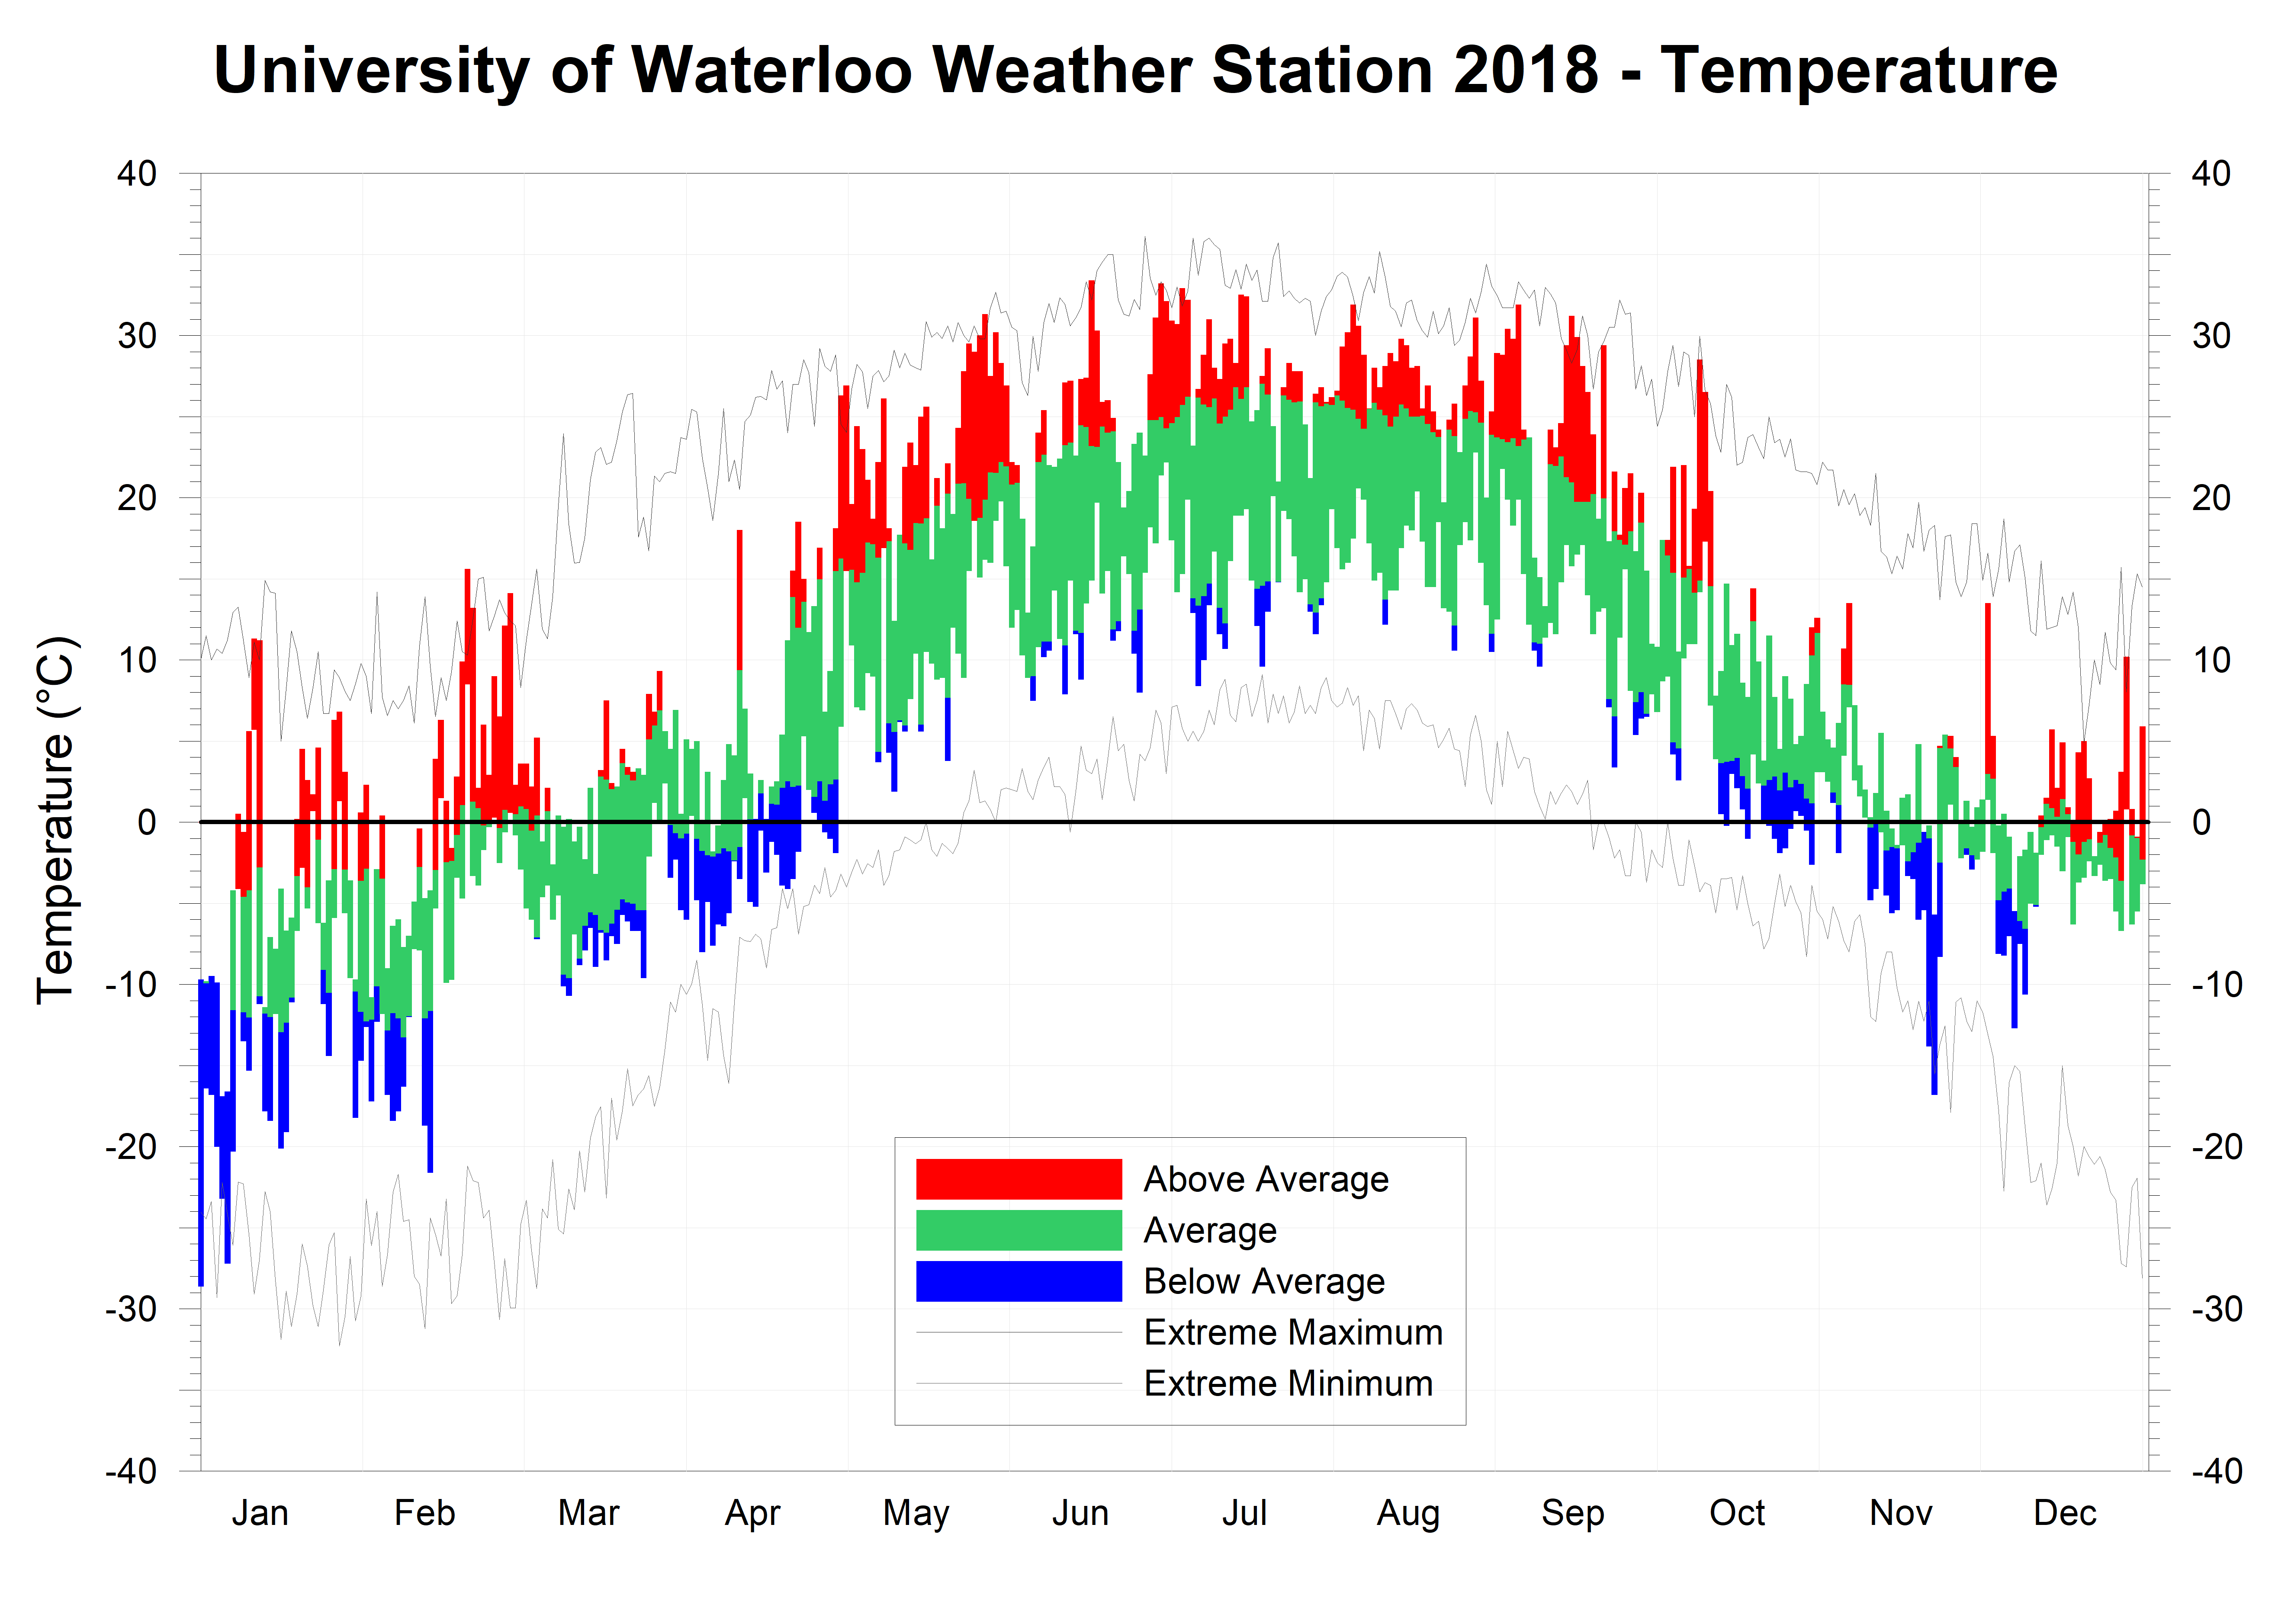
Although this is a bit of an exaggeration, the year 2018 saw a rapid transition both between colder and warmer temperatures in May and then back again in mid-October.  Typically, both the Spring and Fall see times when the temperatures will swing between warmer and colder episodes, but this year it seemed like the transitions happened within a day.  It is hard to quantify just how unique this is, but by looking over the temperature graphs from the past 10 years I couldn’t see anything like it.

The year started out really cold, in fact the coldest temperatures of the 2018 occurred in the first few hours of the year on New Year’s Day.  These were followed by days with lows in the minus 20s, however just a week later there were days with highs over 10°C.  This oscillation of temperatures continued into February and included the high of 15.6°C on the 20th which was not only the highest February temperature in over 100 years of weather data in the region, it was also the highest temperature we saw until April 12th. 

Then came a good example of weather whiplash, with April setting the record for the coldest April in the region’s records followed by May which was the warmest.  Summer really started in May, a month which saw 8 days above 25°C (something that has only happened one other time during May) and another streak of 3 days over 30°C.

The warmer than average temperatures continued in June and July including the warmest June day since 2005 (on the 17th when it was 33.4°C) and 10 days in July over 30°C (the average is only 3.5).

But the real heat was still to come, as August was almost 3 degrees higher than average and the second warmest in the past 20 years.  This was followed by a September that was 3.5 degrees higher than average (the 5th warmest in the historical record) and gave us one heat wave with 5 days over 30°C followed by a second one with 5 more days that were over 25°C.

All this heat came to a crashing halt in mid-October with temperatures dropping by 10 degrees after the 12th.  The cold continued in November, which was the coldest since 1996 and the 5th coldest in the region’s history.  This colder pattern continued into mid-December after which we saw a bit of a warm up, resulting in the overall December temperature coming in at 2 degrees above average.

The 2018 overall average temperature was 0.9 degrees above the 1981-2010 average, but only just a little above the average for the last 10 years.

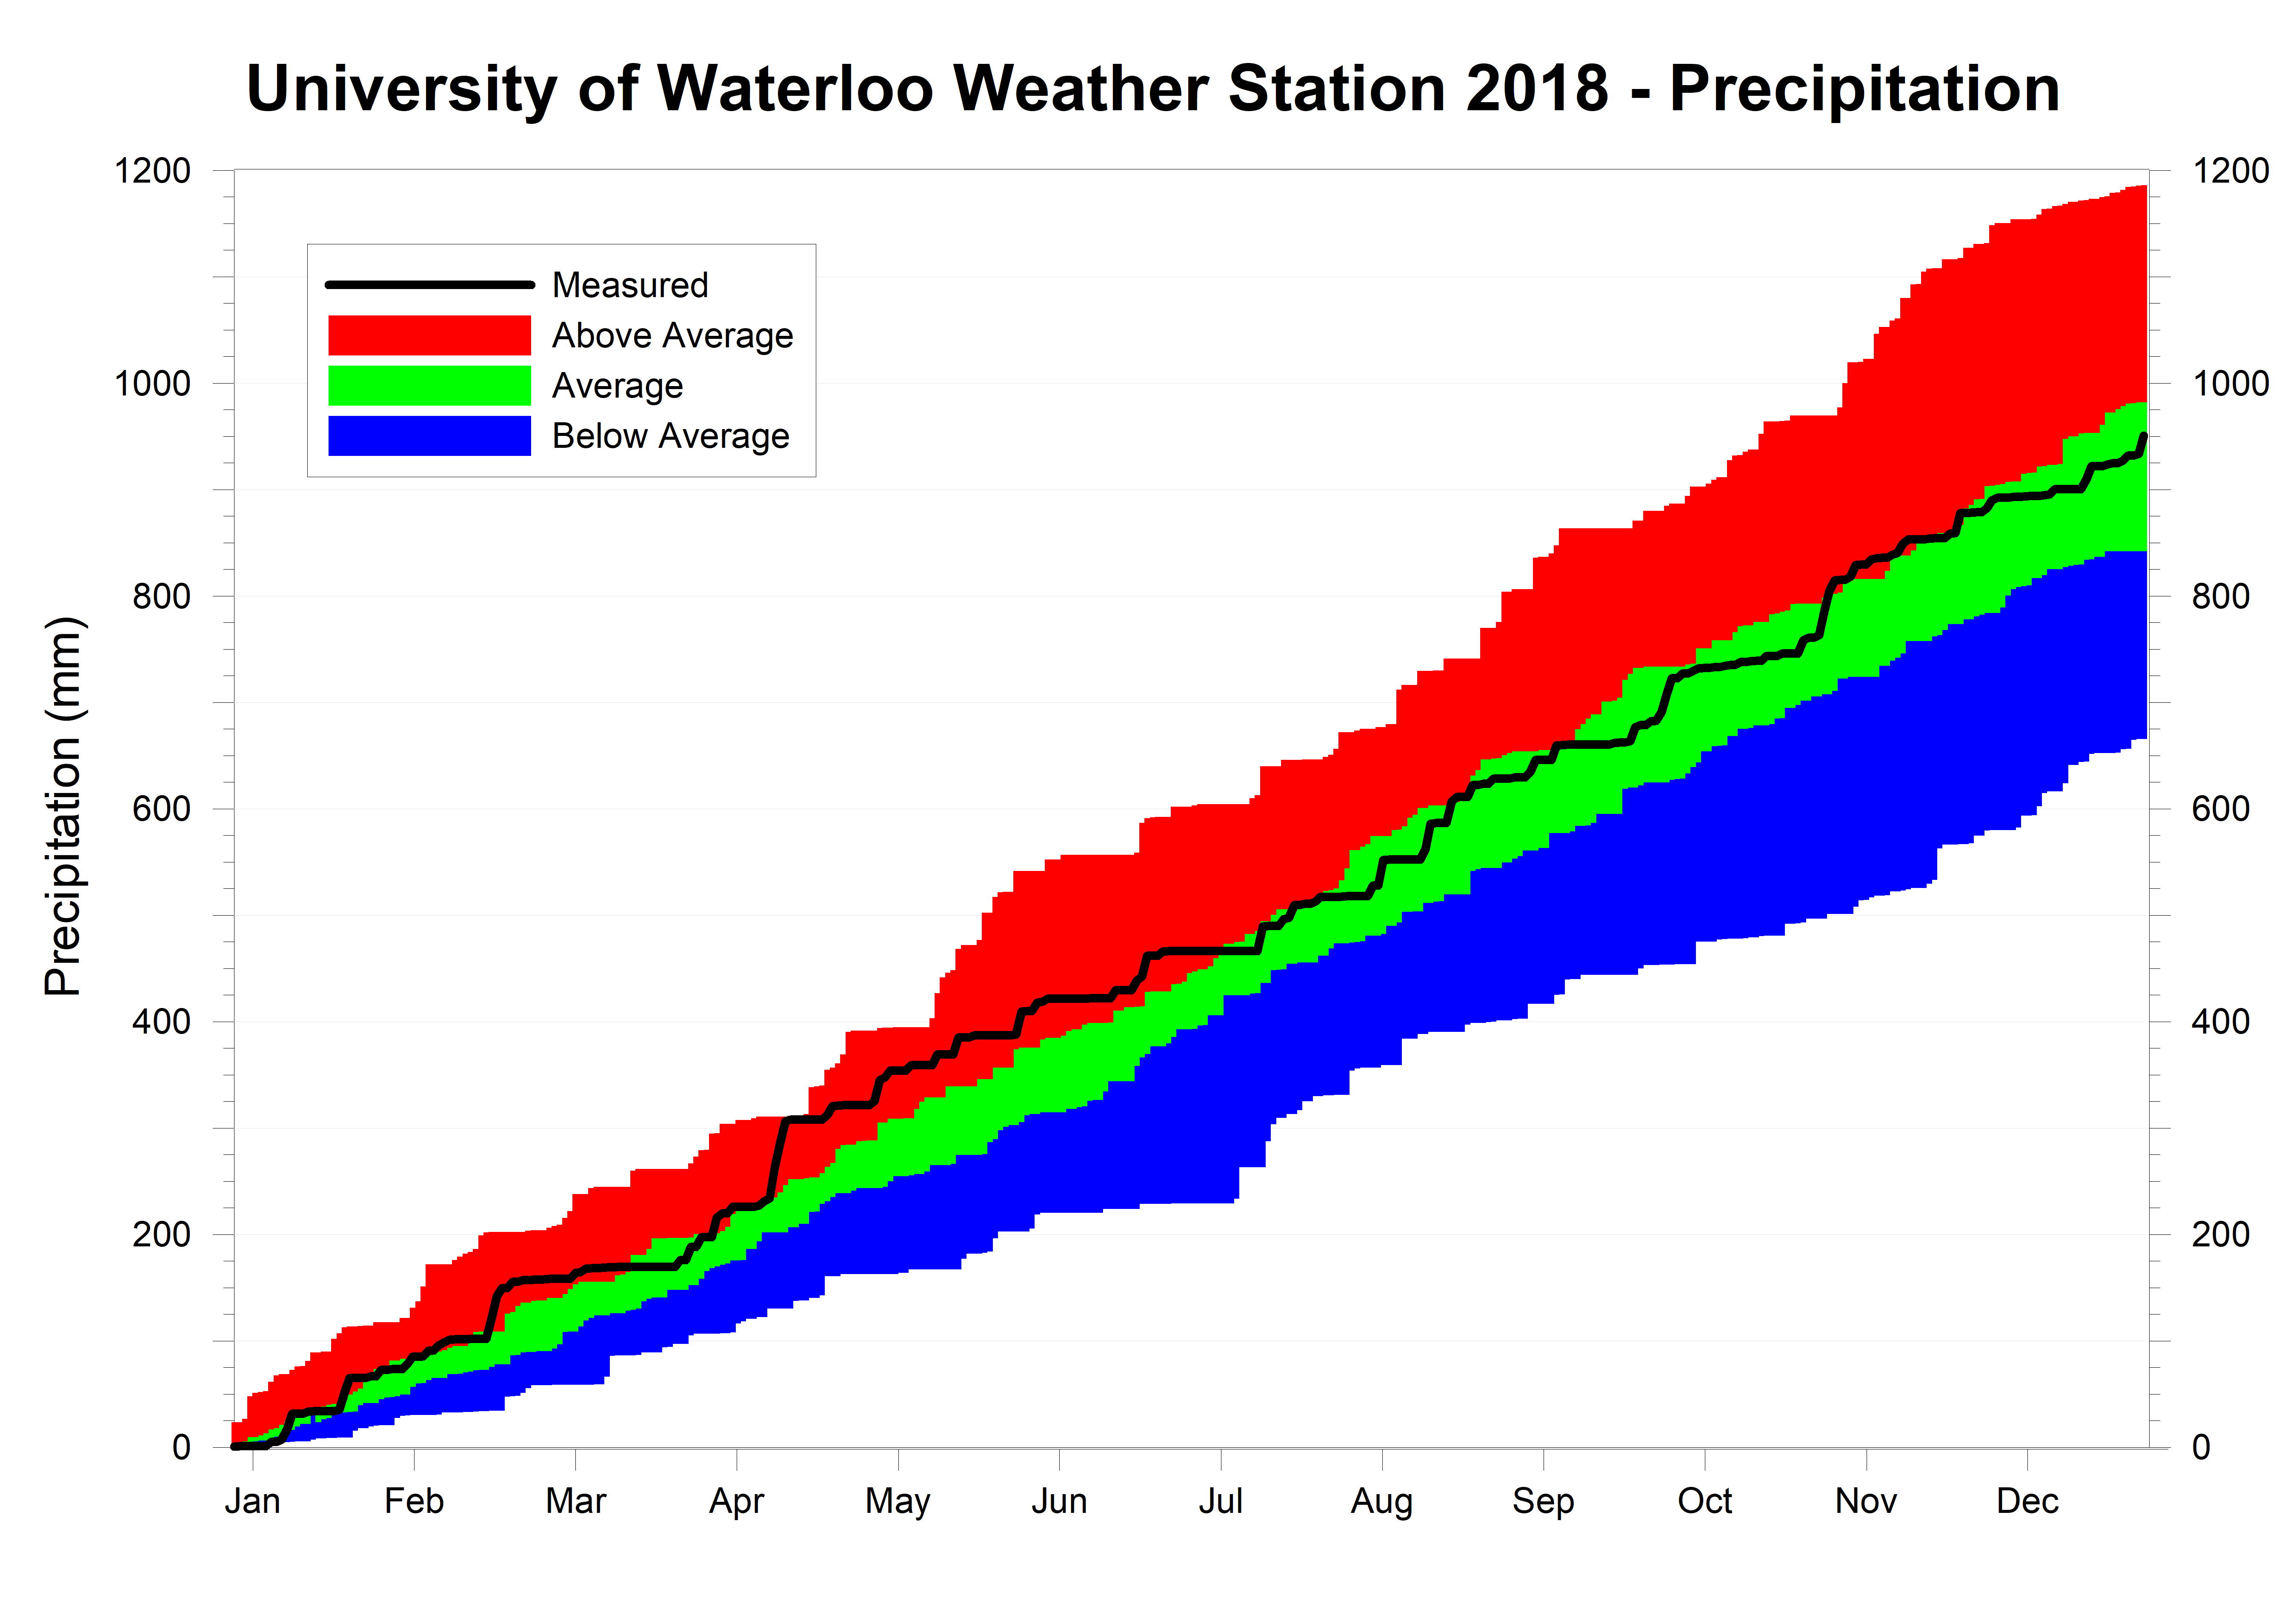
As for precipitation, the first few months of the year were wet with only March coming in drier than average.  One highlight was a period of 3 days in April with 72.6 mm of precipitation, which is almost as much as the average for the month.  This wet start to 2018 turned around in June which saw 12 dry days and a dry first half of July.  This brought the total for the year back into the average range where it pretty much stayed for the rest of the year except for a wet few weeks at the end of October.

The final total precipitation for 2018 of 950.1 mm was only a little over the average of 916.3 mm and well within the average range.

Frank Seglenieks
weather@uwaterloo.ca
University of Waterloo Weather Station Coordinator

Summary for 2018:
Average Daily High Temperature: 12.71°C (average 12.05ºC)
Average Daily Low Temperature: 3.03°C  (average 1.94ºC)
Total Precipitation: 950.1 mm (average 916.3 mm)


(averages are calculated from 1981-2010 data for the Waterloo-Wellington Airport)

Click on the image below to see the temperature chart:

Click on the image below to see the precipitation chart:

Tuesday, January 1, 2019

December 2018 Summary


A warm December with average precipitation and low snowfall

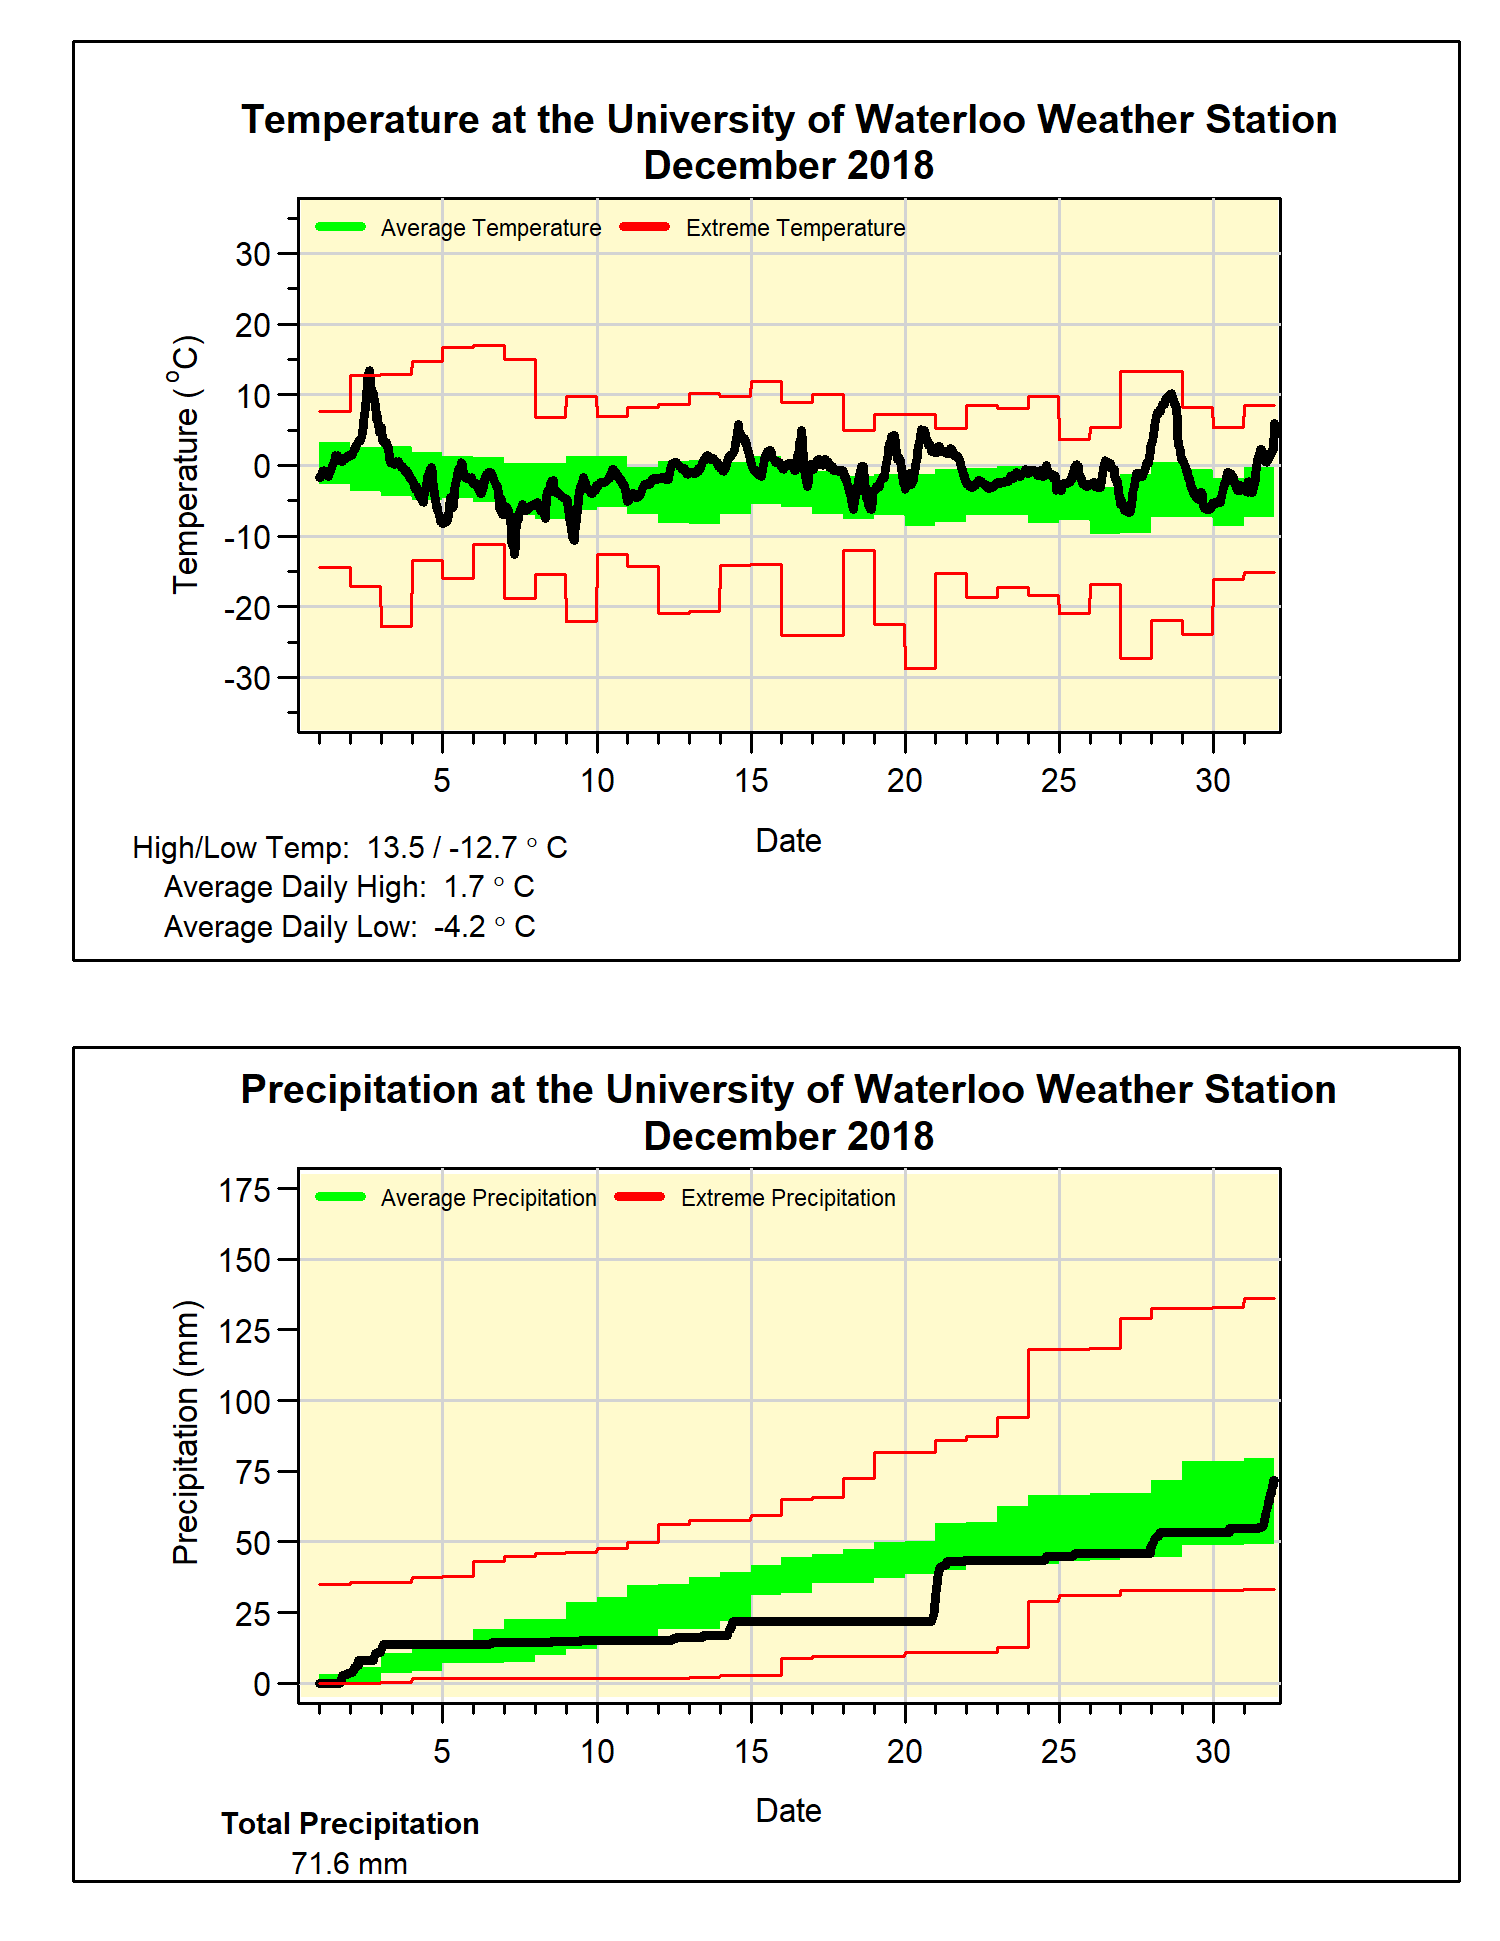
After a start to the month that was a bit colder than average (except for the 2nd when it shot up to 13.5°C, the high temperature for the month), it was generally a bit warmer than average for the rest of December.  The overall average temperature came in at 2 degrees above the average.

A very rainy last few hours of the month pushed the total to just a half a mm above the average of 71.2 mm.  It shouldn’t be surprising with the higher temperatures that December only saw 11.5 cm of snow, much less than the average of 37.2 cm for the month.

Summary for December 2018:
Maximum Temperature 13.5°C
Minimum Temperature -12.7°C
Average Daily High Temperature 1.7°C (Long term average 0.2°C)
Average Daily Low Temperature -4.2°C (Long term average -6.8°C)
Total Precipitation 71.6 mm (Long term average 71.2 mm)

(Long term averages based on 1981-2010 data for the Waterloo-Wellington Airport)


Sunday, December 2, 2018

November 2018 Summary


A wet November that was the coldest in over 20 years

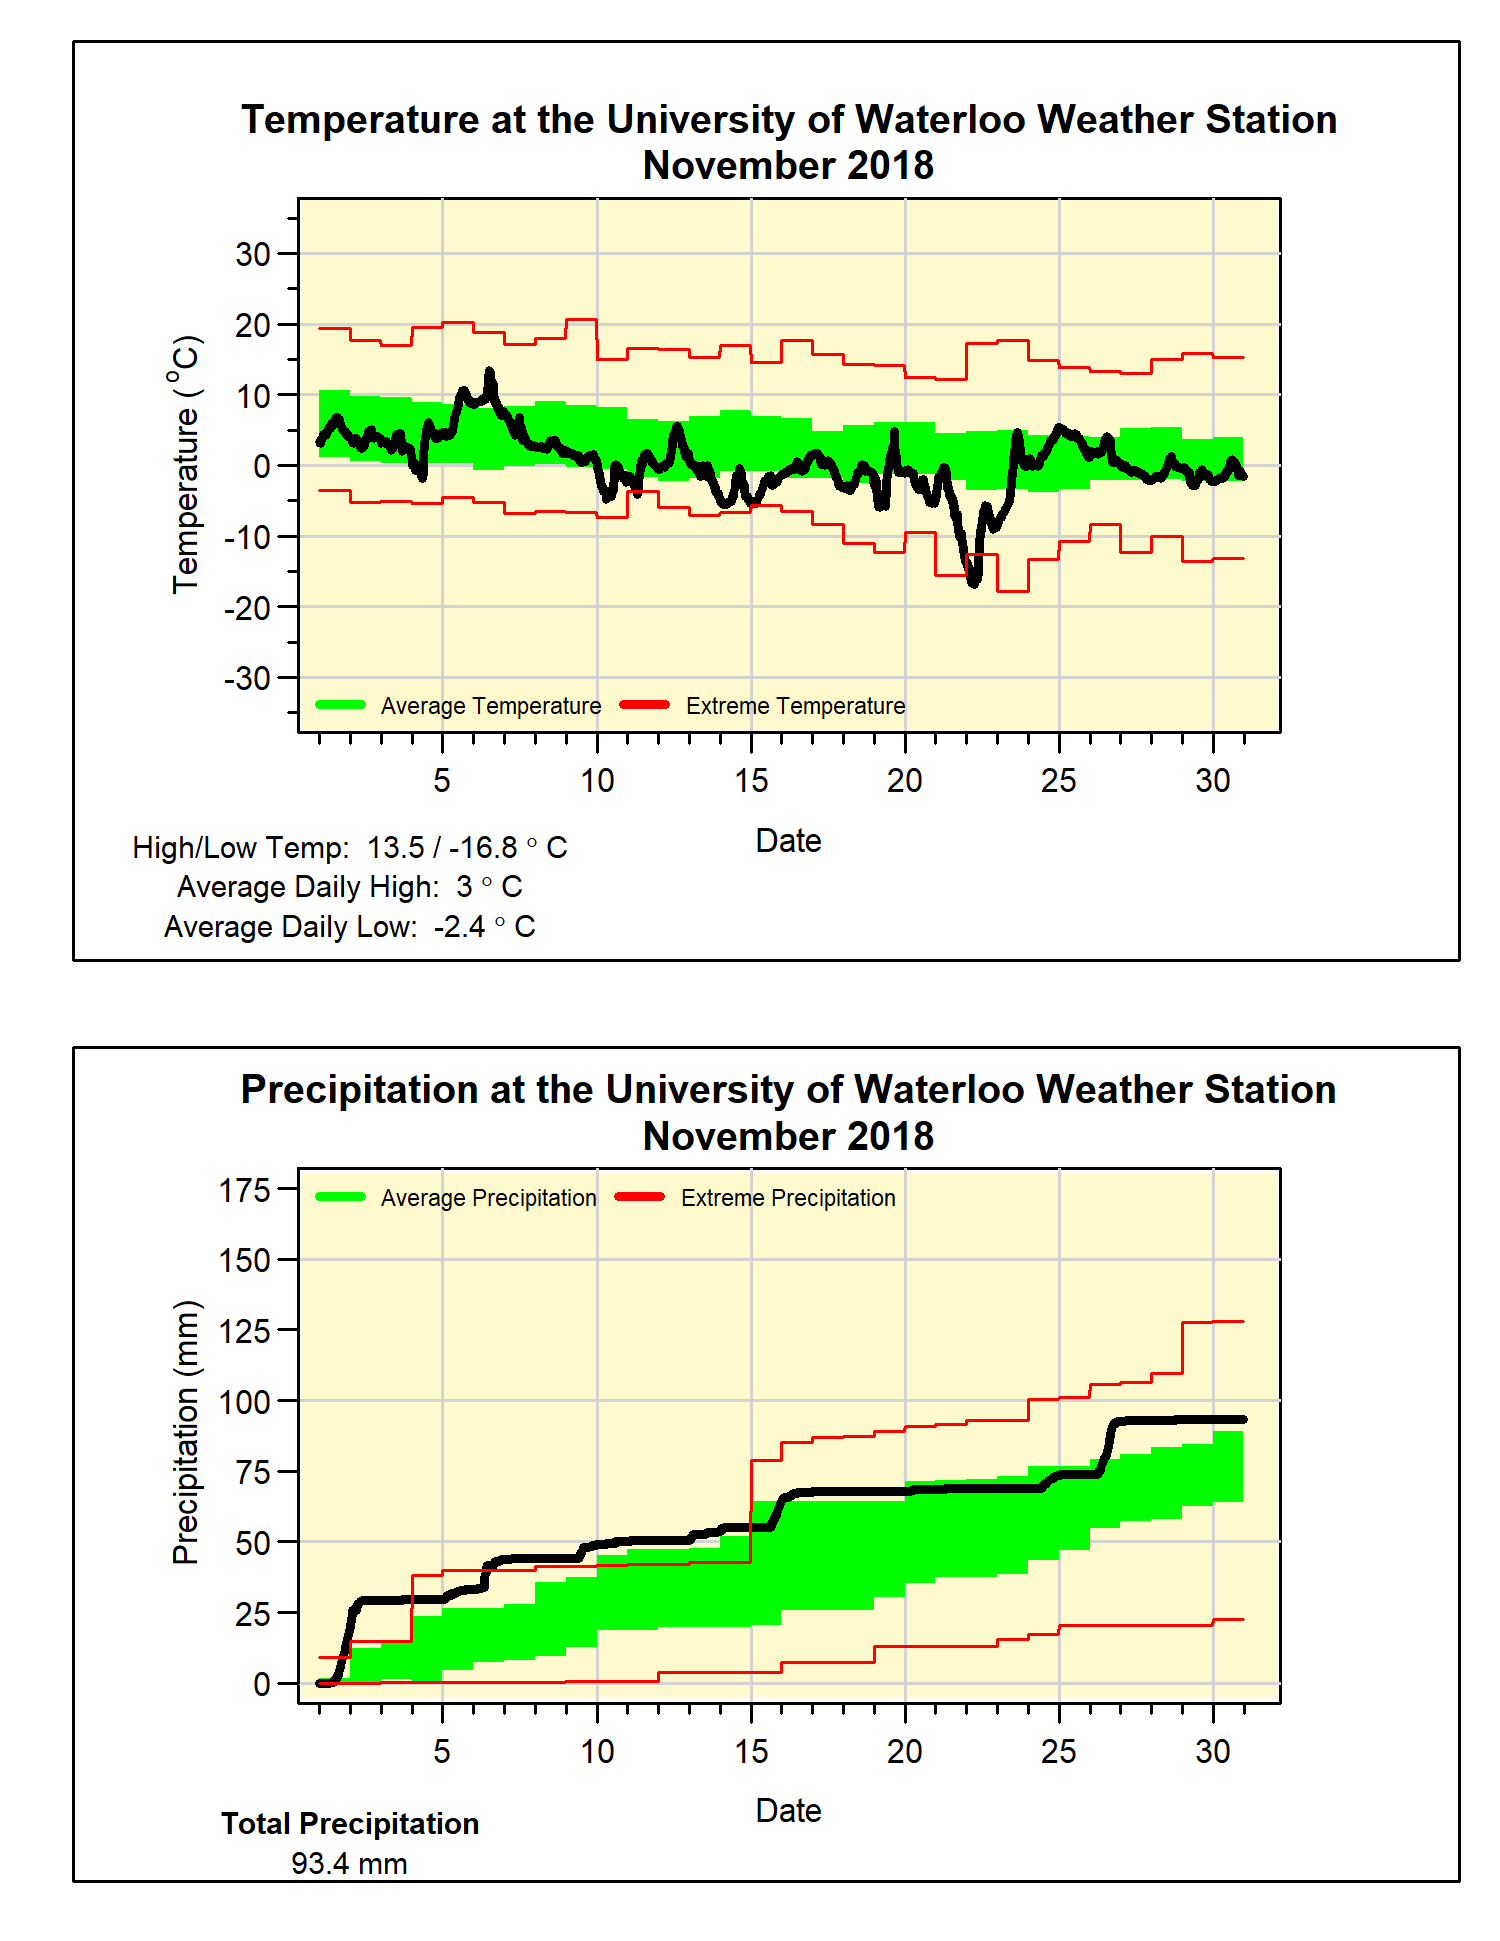
The colder temperatures that started in mid-October continued throughout November, with an overall temperature over 2 degrees below average it was the coldest November since 1996.  This put it at the 5th coldest in the over 100 year history of weather records in the region.  As well, the low temperature on the 22nd of -16.8°C was the coldest November temperature since November 23rd, 2000 when it was -17.9°C.

The total precipitation for the month of 93.4 mm was only a bit above the average of 87.1 mm, but enough to put into the above average range.  This puts the total for the year at 878.5 mm compared to the average of 832.9 mm.

The real story of the precipitation was the 21.5 cm of snow we received in the first half of the month, this is the most for the first half of the month since 1995 when we had 25 cm.  The rest of November only saw a little more resulting in a total of 23.5 cm, which is still a lot more than the average of 13 cm for the month.

Summary for November 2018:
Maximum Temperature 13.5°C
Minimum Temperature -16.8°C
Average Daily High Temperature 3.0°C (Long term average 6.3°C)
Average Daily Low Temperature -2.4°C (Long term average -1.4°C)

Total Precipitation 93.4 mm (Long term average 87.1 mm)

(Long term averages based on 1981-2010 data for the Waterloo-Wellington Airport)