This blog highlights observations about the current (and past) weather conditions at the E.D. Soulis Memorial weather station which is located at the University of Waterloo.
An average August for both temperature and precipitation
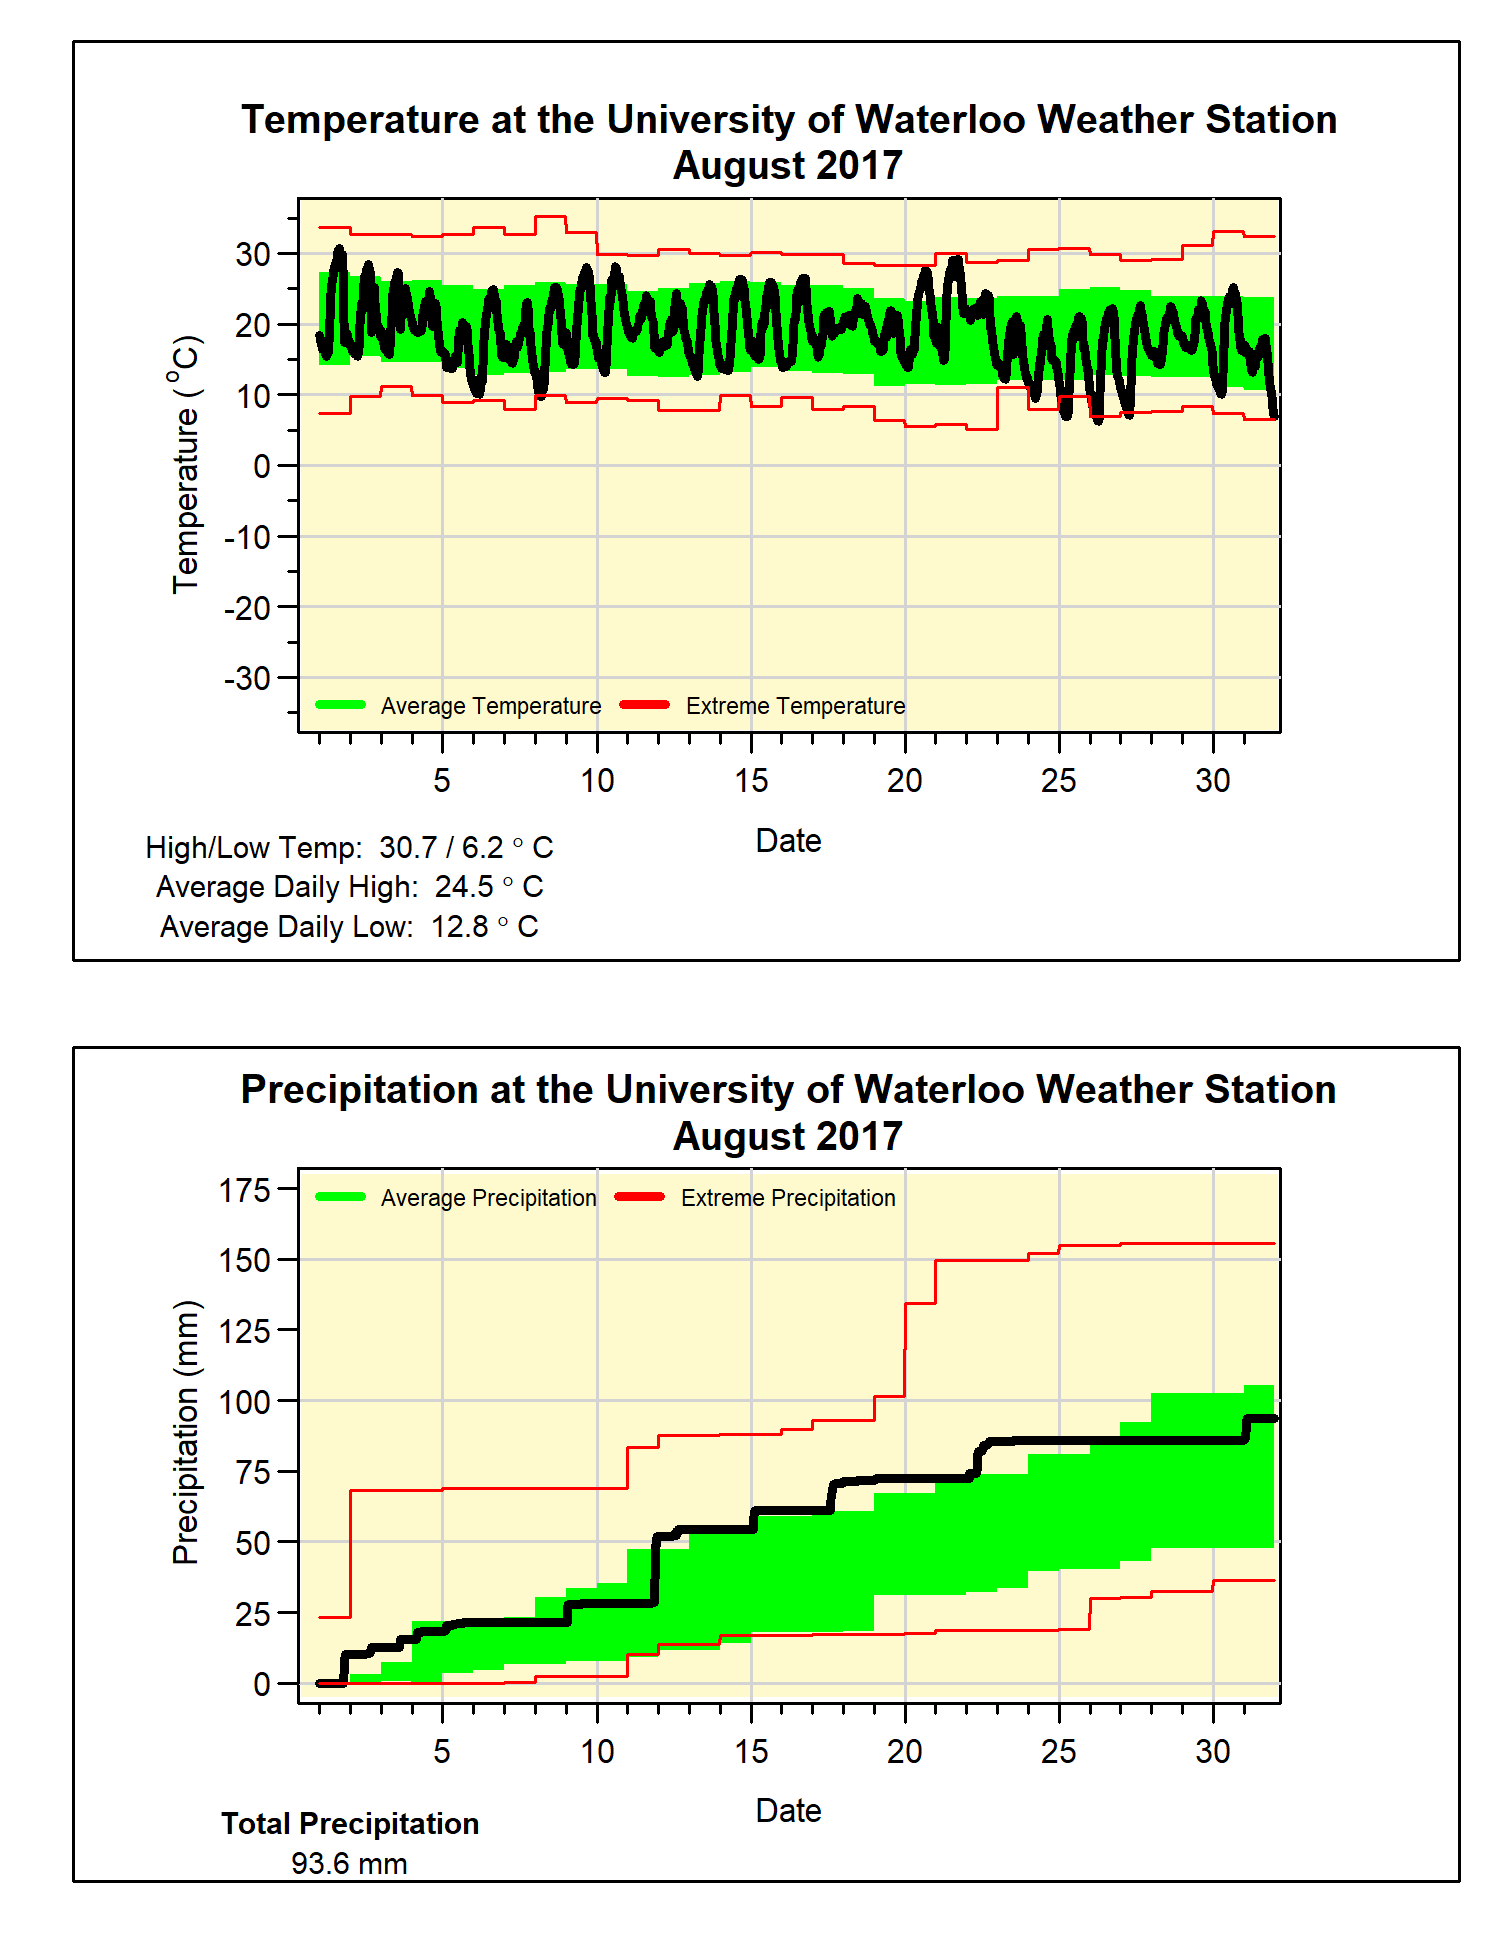
Although we didn’t see lots of really hot temperatures this month (only one day above 30°C), we also didn’t see lots of cold ones. This resulted in the overall temperature being just 0.2 degrees below average, but this is still within the average range.
This may be surprising to some, but the fact is we have seen a string of warm months of August in recent years with this year’s overall temperature being the coolest since 2008. In the 20 years of data at the UW Weather Station, only one August (2004) was cold enough to be in the below average range. It was also a lot cooler than last year when we had 8 days over 30°C in August.
The month started out very wet, but with drier conditions in the last week the total precipitation of 93.6 mm was within the average range coming in a bit higher than the average for August of 83.9 mm.
The total precipitation for the year of 775.4 mm is well above the average of 596.0 mm. For the last few months we have been in second in the “wettest year to date” category, however, there were lots of wet months of August in the past so we have dropped down to the sixth wettest year so far since records in the area began just over 100 years ago.
Summary for August 2017:
Maximum Temperature 30.7°C
Minimum Temperature 6.2°C
Average Daily High Temperature 24.5°C (Long term average 24.8°C)
Average Daily Low Temperature 12.9°C (Long term average 12.9°C)
Total Precipitation 93.6 mm (Long term average 83.9 mm)
(Long term averages based on 1981-2010 data for the Waterloo Wellington Airport)
These are my recollections of my trip down to the US to get on the line of totality during the solar eclipse on August 21, 2017. As well as just experiencing the eclipse I also took along a temperature sensor to record the effects of the sun being blocked.
Just a bit on the logistics, I stayed in a small town called Glasgow, Kentucky the night before the eclipse and woke up early to drive to Bledsoe Creek State Park in Tennessee which is east of Nashville. I was worried there might be some traffic, but it was open roads all the way. I got there about an hour and half before the park opened and was car number 120 in line. The park was mostly forested, but there was a hydro cut where most people set up their camps as there was a pretty good open view of the sky.
It was nice being somewhere that wasn't wall to wall people, but enough people to have a good group experience. There were also a few people with very large telescopes, including one guy who had his connected to a computer screen so everyone could see a close up of the sun.
The day was really hot and sunny, with high temperatures of around 35C. A few clouds appeared in the early afternoon, but just one covered the sun about an hour before totality, after that it was clear.
About 10 or 15 minutes before totality is when it started to get noticeably less bright, note I didn't say darker, but it started to feel not quite so hot and I could take off my sunglasses. I think this was made all the more noticeable because it was so hot that day.
Once the moon's shadow actually passed over it of course became dark almost instantly, it wasn't pitch black but maybe about as dark as it is 15 minutes after a regular sunset. Also interesting was the horizon which looked like sunset or sunrise, but instead of just in one part of the horizon it was all around. Then everything went in reverse once the sun came back out.
Here is a video that I made just by putting a phone on the ground, it starts about a minute before totality and goes till about a minute after. You can see how quickly it got dark and how the sky changed during the event (note the I'm standing out of the camera's view, I don't know the people who are actually seen in the video):
Something I didn't notice until I watched the videos was just how loud the cicadas got during the eclipse. If you watch this "time-lapse" I made you can see both the reduction in the light as well as the background noise. This one starts about 5 minutes before totality and each segment is about 1 minute apart:
Here is the graph of temperature during the eclipse in Tennessee, I kept one of the sensors in the sun (not the usual way to measure temperature I know) and one in the shade. You can see that the sensor in the sun went down about 7C and the one in the shade got down to about the same temperature but started about a degree lower (the variation in temperature before 14:00 is probably just me setting everything up getting the sensor out of my car, as well the temperature looks like it was still going up when I left the park so I didn't get the entire rising limb of the temperature graph):
And closer to home, at the UW weather station there was understandably a lessor effect on the air temperature:
With the eclipse being 75% or so in the region, there was a large effect on the incoming solar radiation and the wind speed, as shown in the graphs below:
Overall it was a great experience and I recommend trying to get into the path of totality if you can make it. The only downside was that after getting out of the park there was about 5 hours of bumper to bumper, stop and go traffic to get away from the totality line. So my biggest advice for the eclipse in 2024 is that wherever you are, stay somewhere close and spend the night so you don't have to deal with the traffic.
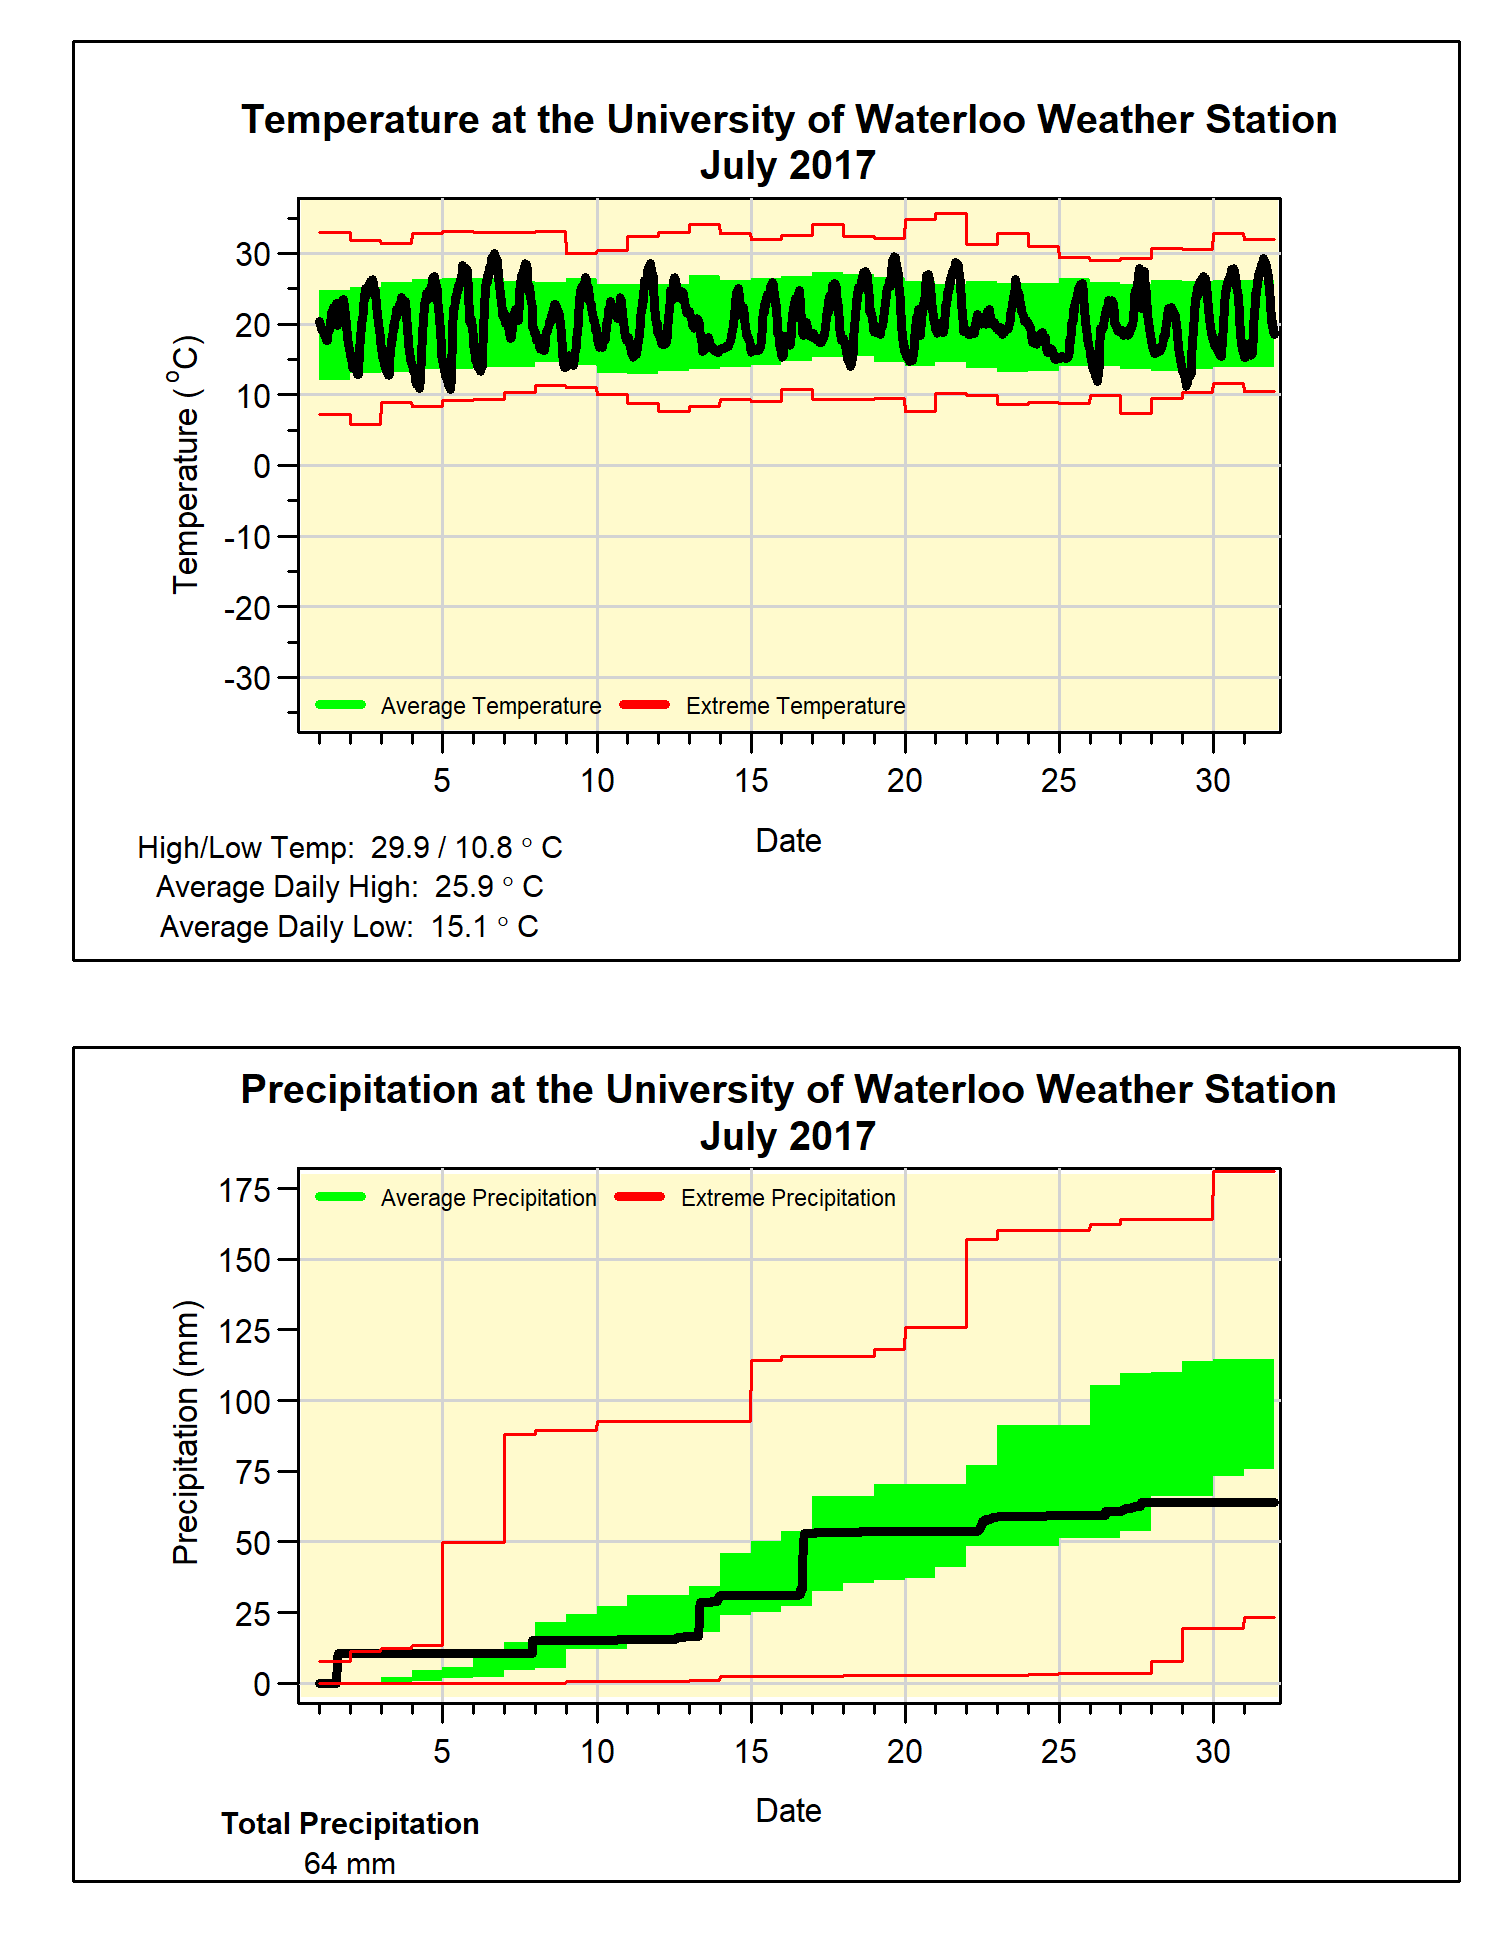
A pretty average month for temperature, although it was half a degree warmer than average overall, this is still within the average range. It was also very consistent as there were only 2 individual days that were more than 5 degrees from the average (you can see in the graph that the measured temperature was within the green band most of the time)
The wet first half of the month couldn’t make up for the very dry last half (only 11 mm after the 17th). The final total for July was 64.0 mm which is a lot lower than the average of 98.6 mm.
With this dry month, the total precipitation for the year of 681.1 mm is now a bit closer to the average of 509.0 mm. However, it is still the second wettest year so far (still behind 1947).
Summary for July 2017:
Maximum Temperature 29.9°C
Minimum Temperature 10.8°C
Average Daily High Temperature 25.9°C (Long term average 26.0°C)
Average Daily Low Temperature 15.1°C (Long term average 14.0°C)
Total Precipitation 64.0 mm (Long term average 98.6 mm)
(Long term averages based on 1981-2010 data for the Waterloo Wellington Airport)
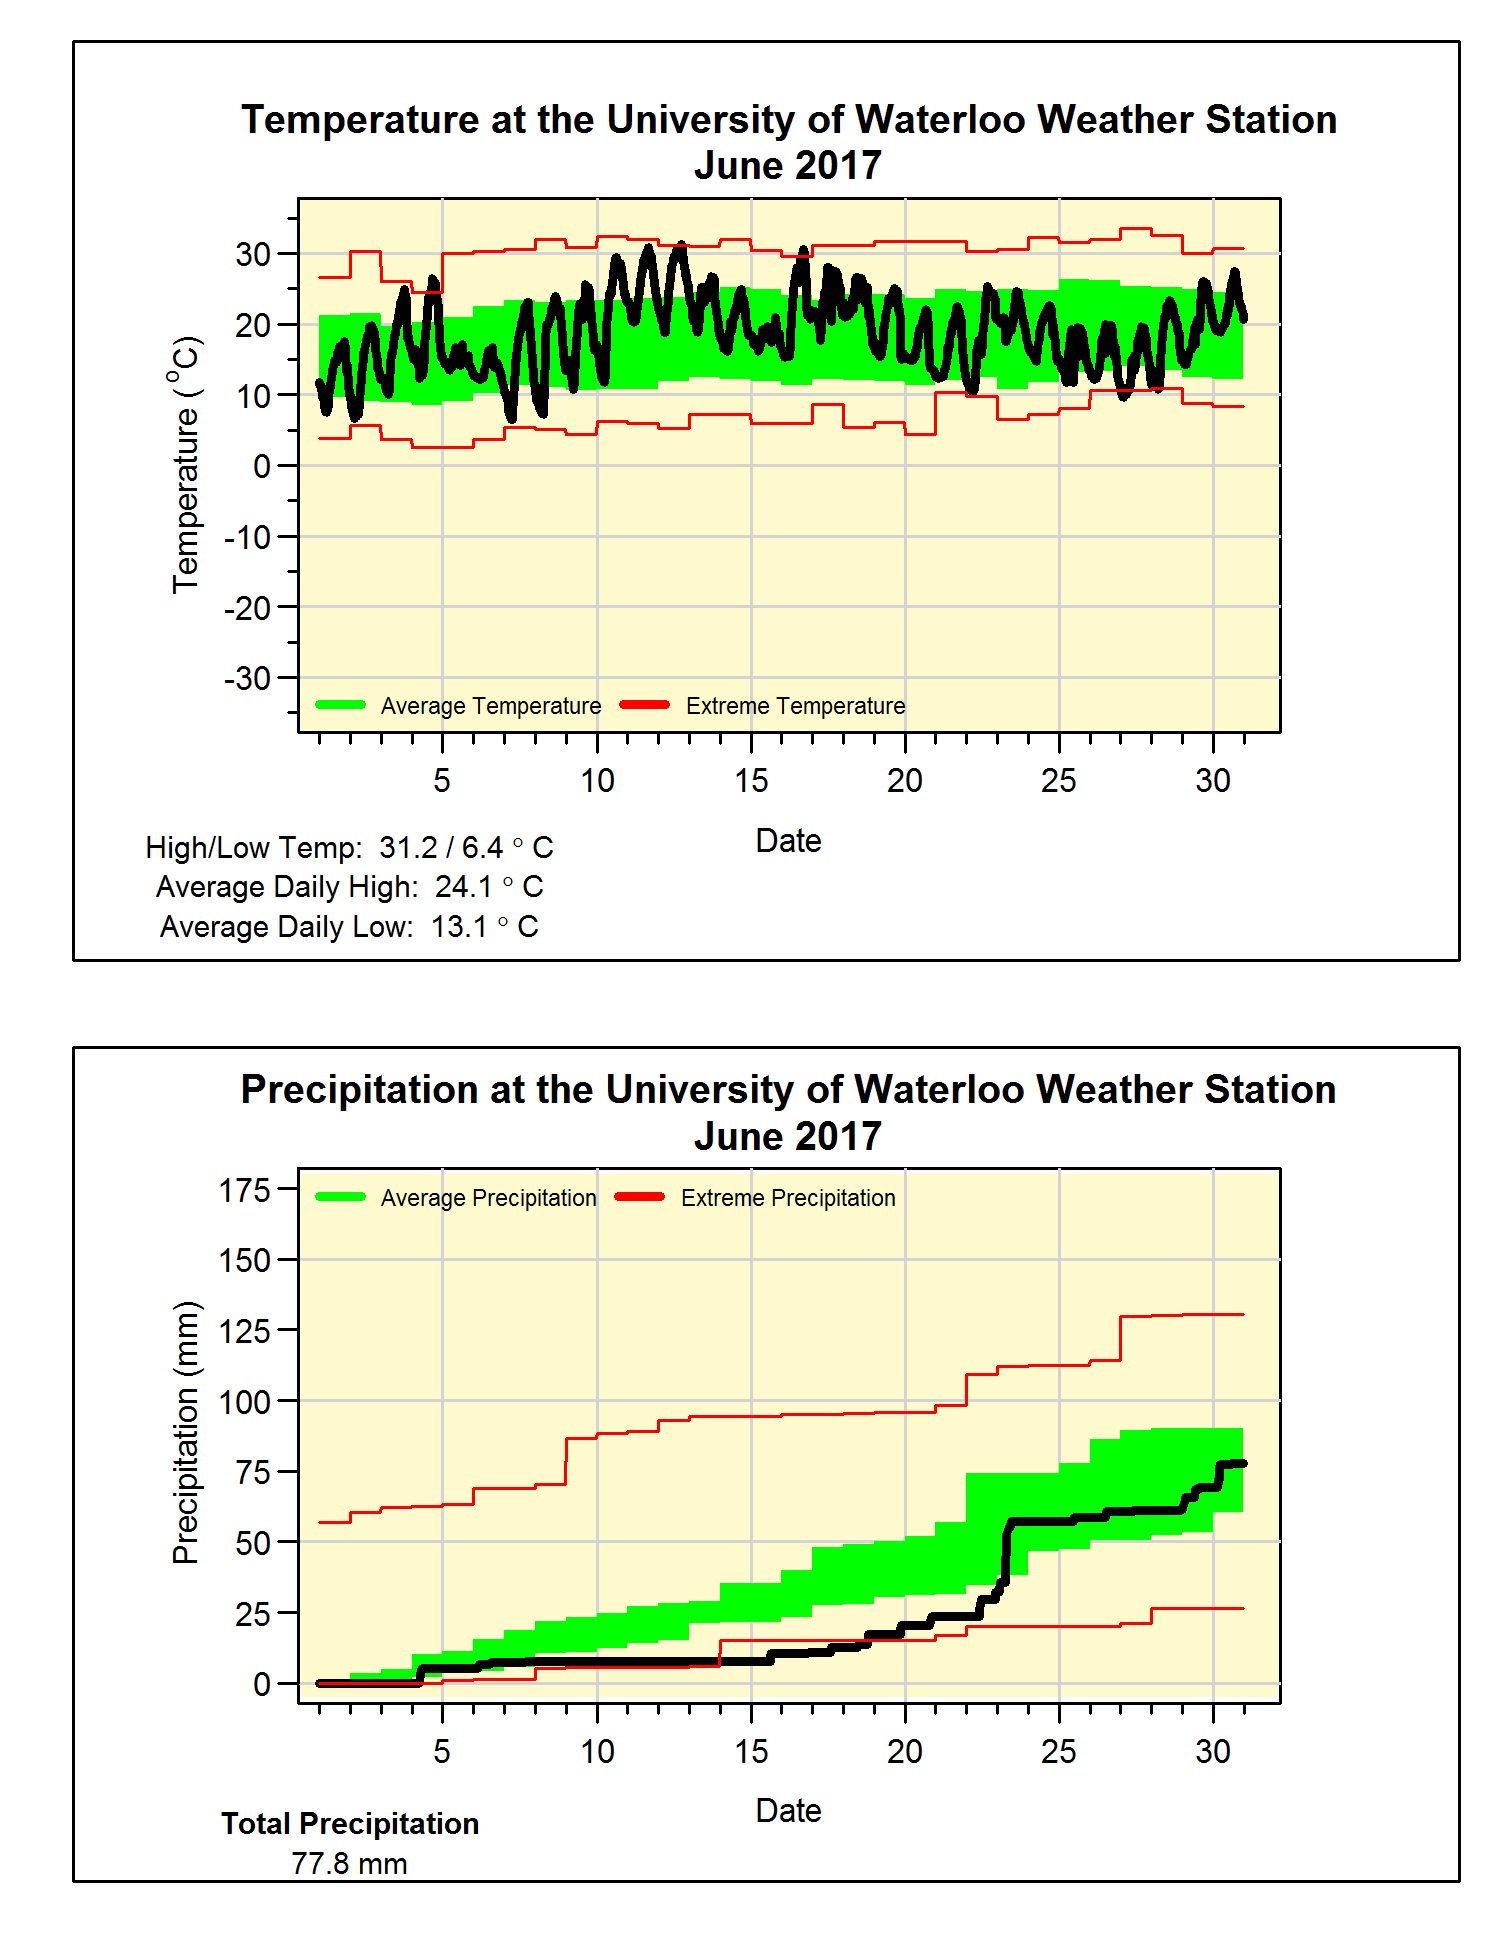
During June we saw a few hot days (3 over 30°C), some colder ones (3 less than 18°C) and a whole lot of average ones. However, continuing the trend for the last few years the nighttime lows were much warmer putting the overall temperature just over 1 degree above average.
Although the last week was really wet, it was actually quite dry to start off the month. So the rain at the end of the month only managed to get the total for the month of 77.8 mm close to but still a bit below the average of 82.4 mm.
Looking at the first half of the year, the total precipitation of 617.8 mm is the second wettest first 6 months of the year, only coming behind 1947 when there was 624.8 mm.
Summary for June 2017: Maximum Temperature 31.2°C Minimum Temperature 6.4°C Average Daily High Temperature 24.1°C (Long term average 23.6°C) Average Daily Low Temperature 13.1°C (Long term average 11.5°C) Total Precipitation 77.8 mm (Long term average 82.4 mm)
(Long term averages based on 1981-2010 data for the Waterloo Wellington Airport)
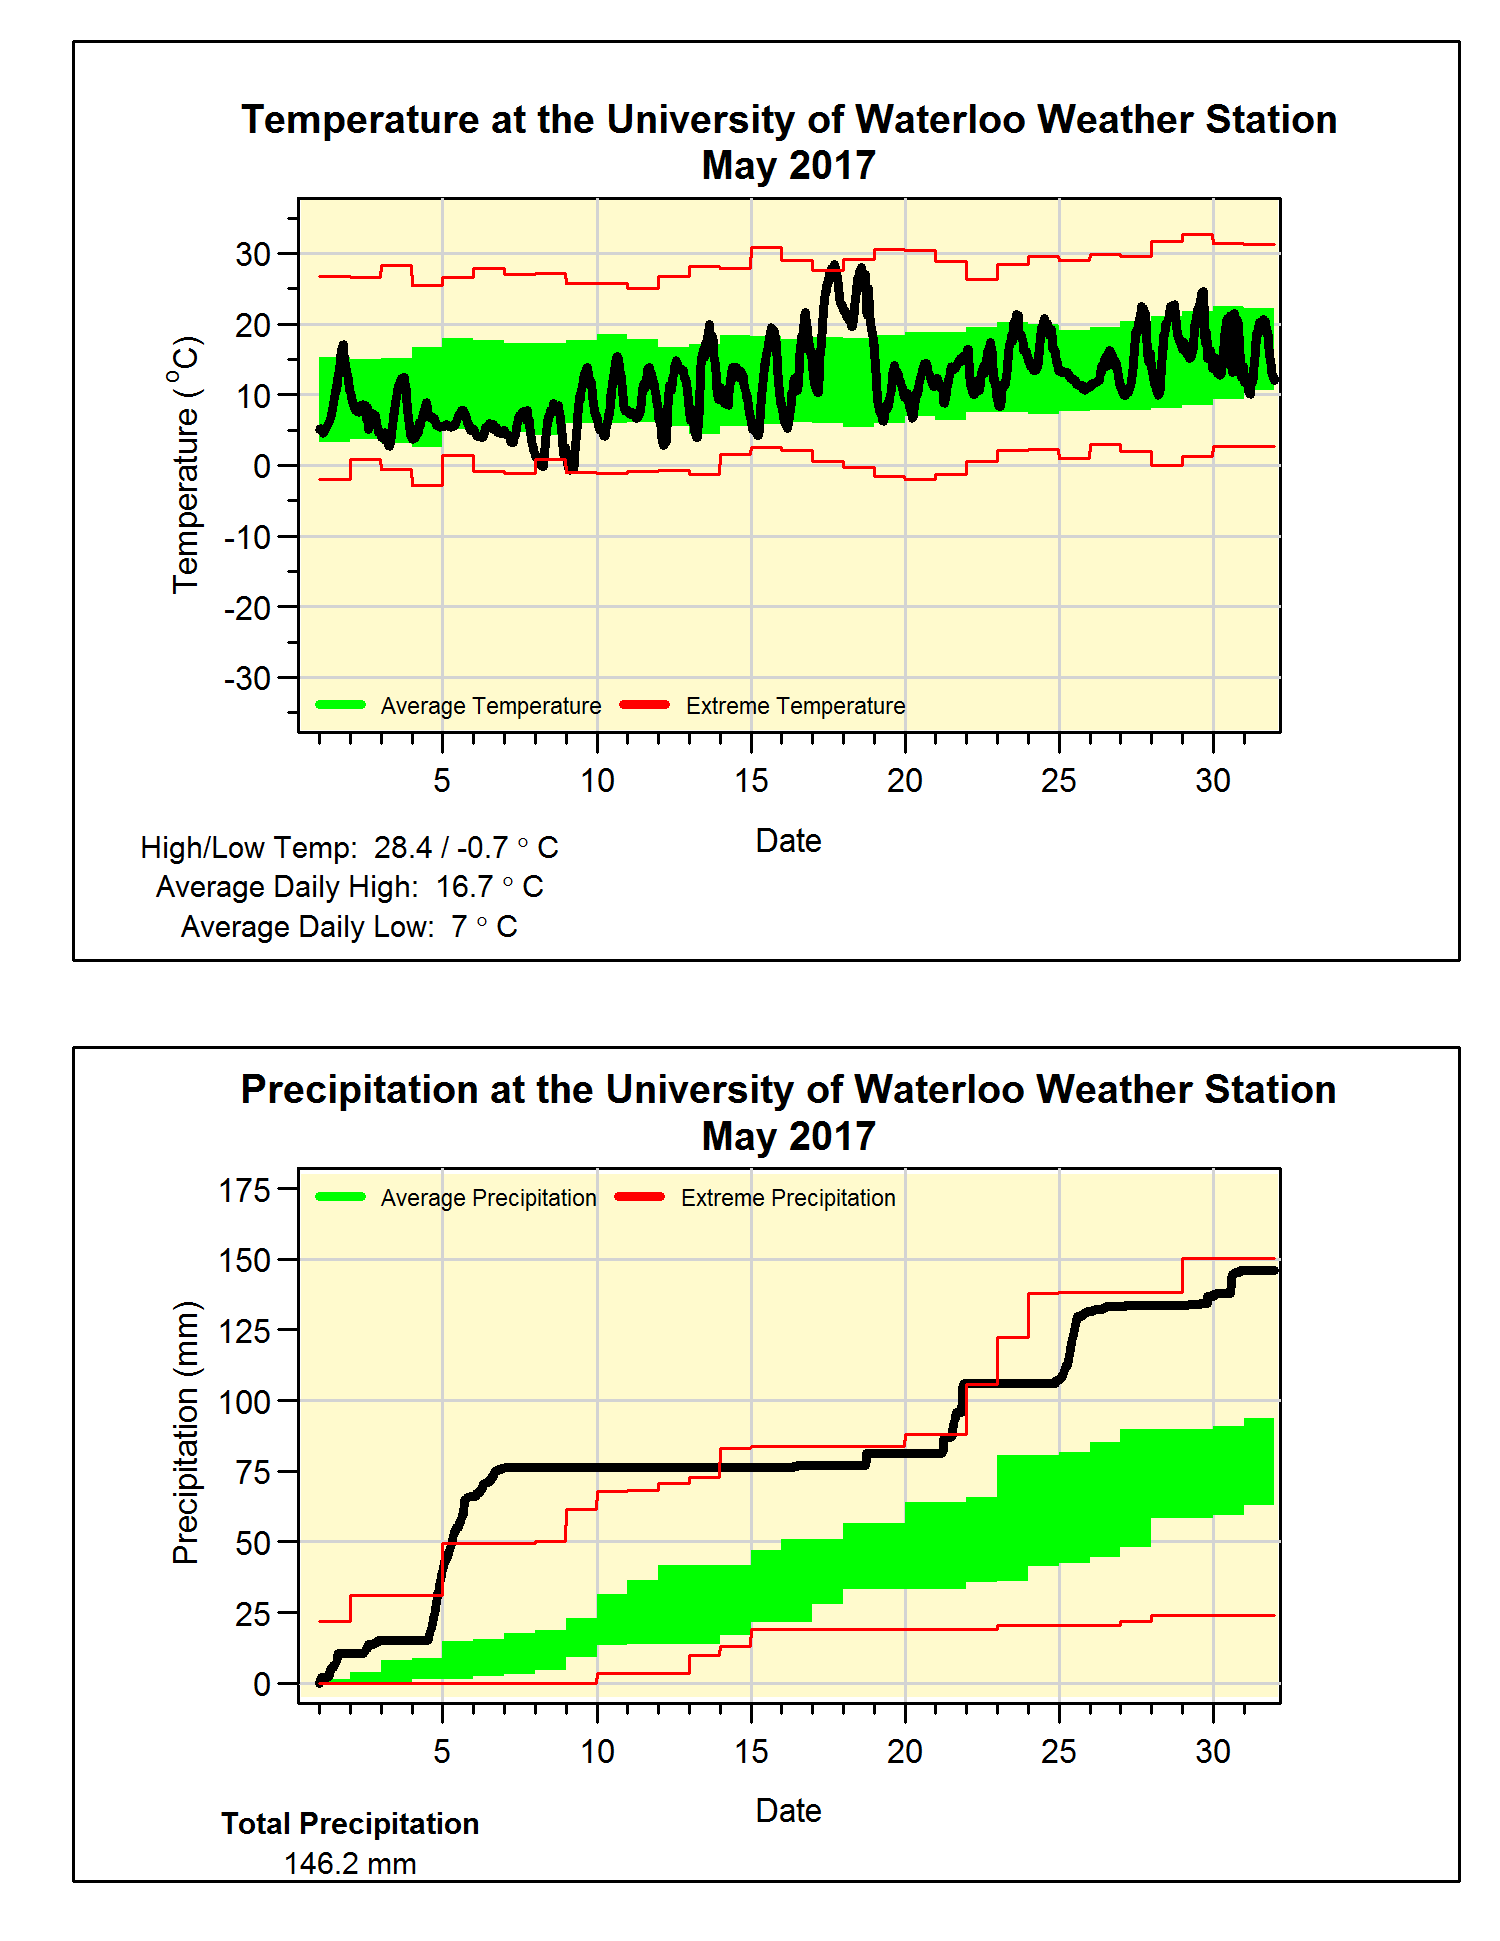
The see-saw monthly temperatures continued in May with much cooler temperatures than the warmth we saw in April. With a very cold start to the month and only a couple days above 25°C, the final overall temperature was 0.6 degrees below average making it the coldest May since 2009.
But the bigger story was that it just wouldn’t stop raining (well actually it did for a week but that didn’t seem to matter). The total of 146.2 mm was much more than the average of 82.3 m, this is a lot but not even in the top 5 for the history of measurements in the area.
However, the total for April and May of 270.6 mm was the third highest of all time and not that much behind the record of 286.0 mm back in 1916. While the total so far for the year of 540 mm is not only well above the average of 340 mm, but is also just below the record wettest first five months of the year (541.6 mm in 2011).
Summary for May 2017:
Maximum Temperature 28.4°C
Minimum Temperature -0.7°C
Average Daily High Temperature 16.7°C (Long term average 18.5°C)
Average Daily Low Temperature 7.0°C (Long term average 6.4°C)
Total Precipitation 146.2 mm (Long term average 82.3 mm)
(Long term averages based on 1981-2010 data for the Waterloo Wellington Airport)




 Posts
Posts

