Friday, June 3, 2016

May 2016 Summary


A dry and warm May 

Although it was just pretty much average for the first half of the month, it was hot enough in the second half to put the overall temperature for May at 1.2 degrees higher than average.  A neat thing you can see on the graph is the temperature starting at 24.7°C on the 12th and then going pretty much straight down to 0.9°C on the 15th.

As sometimes happens in the region, there were no below zero temperatures during the month of May.  So this makes the last frost day April 30, which is about 5 days earlier than the UW weather station average of May 6.  This is an instance where I don’t like using the Waterloo Wellington Airport data as a small difference in temperature can make the difference between a frost or non-frost day.  Indeed this May the airport did record a low of -1.0°C on the 9th, where we only got down to 0.6°C.

For the first time since September, it was a drier than average month.  With the 42.2 mm of precipitation in May only being a bit more than half of the average of 82.3 mm.  This has pretty much wiped out the surplus we have seen since the beginning of the year, so the total for the year of 359.8 mm is now just a little above the average of 342.4 mm.


Summary for May 2016:
Maximum Temperature 30.9°C
Minimum Temperature 0.6°C
Average Daily High Temperature 20.0°C (Long term average 18.7°C)
Average Daily Low Temperature 7.4°C (Long term average 6.4°C)
Total Precipitation 42.2 mm (Long term average 82.3 mm)

(Long term averages based on 1981-2010 data for the Waterloo Wellington Airport)

Thursday, May 5, 2016

April 2016 Summary


A cold April with average precipitation

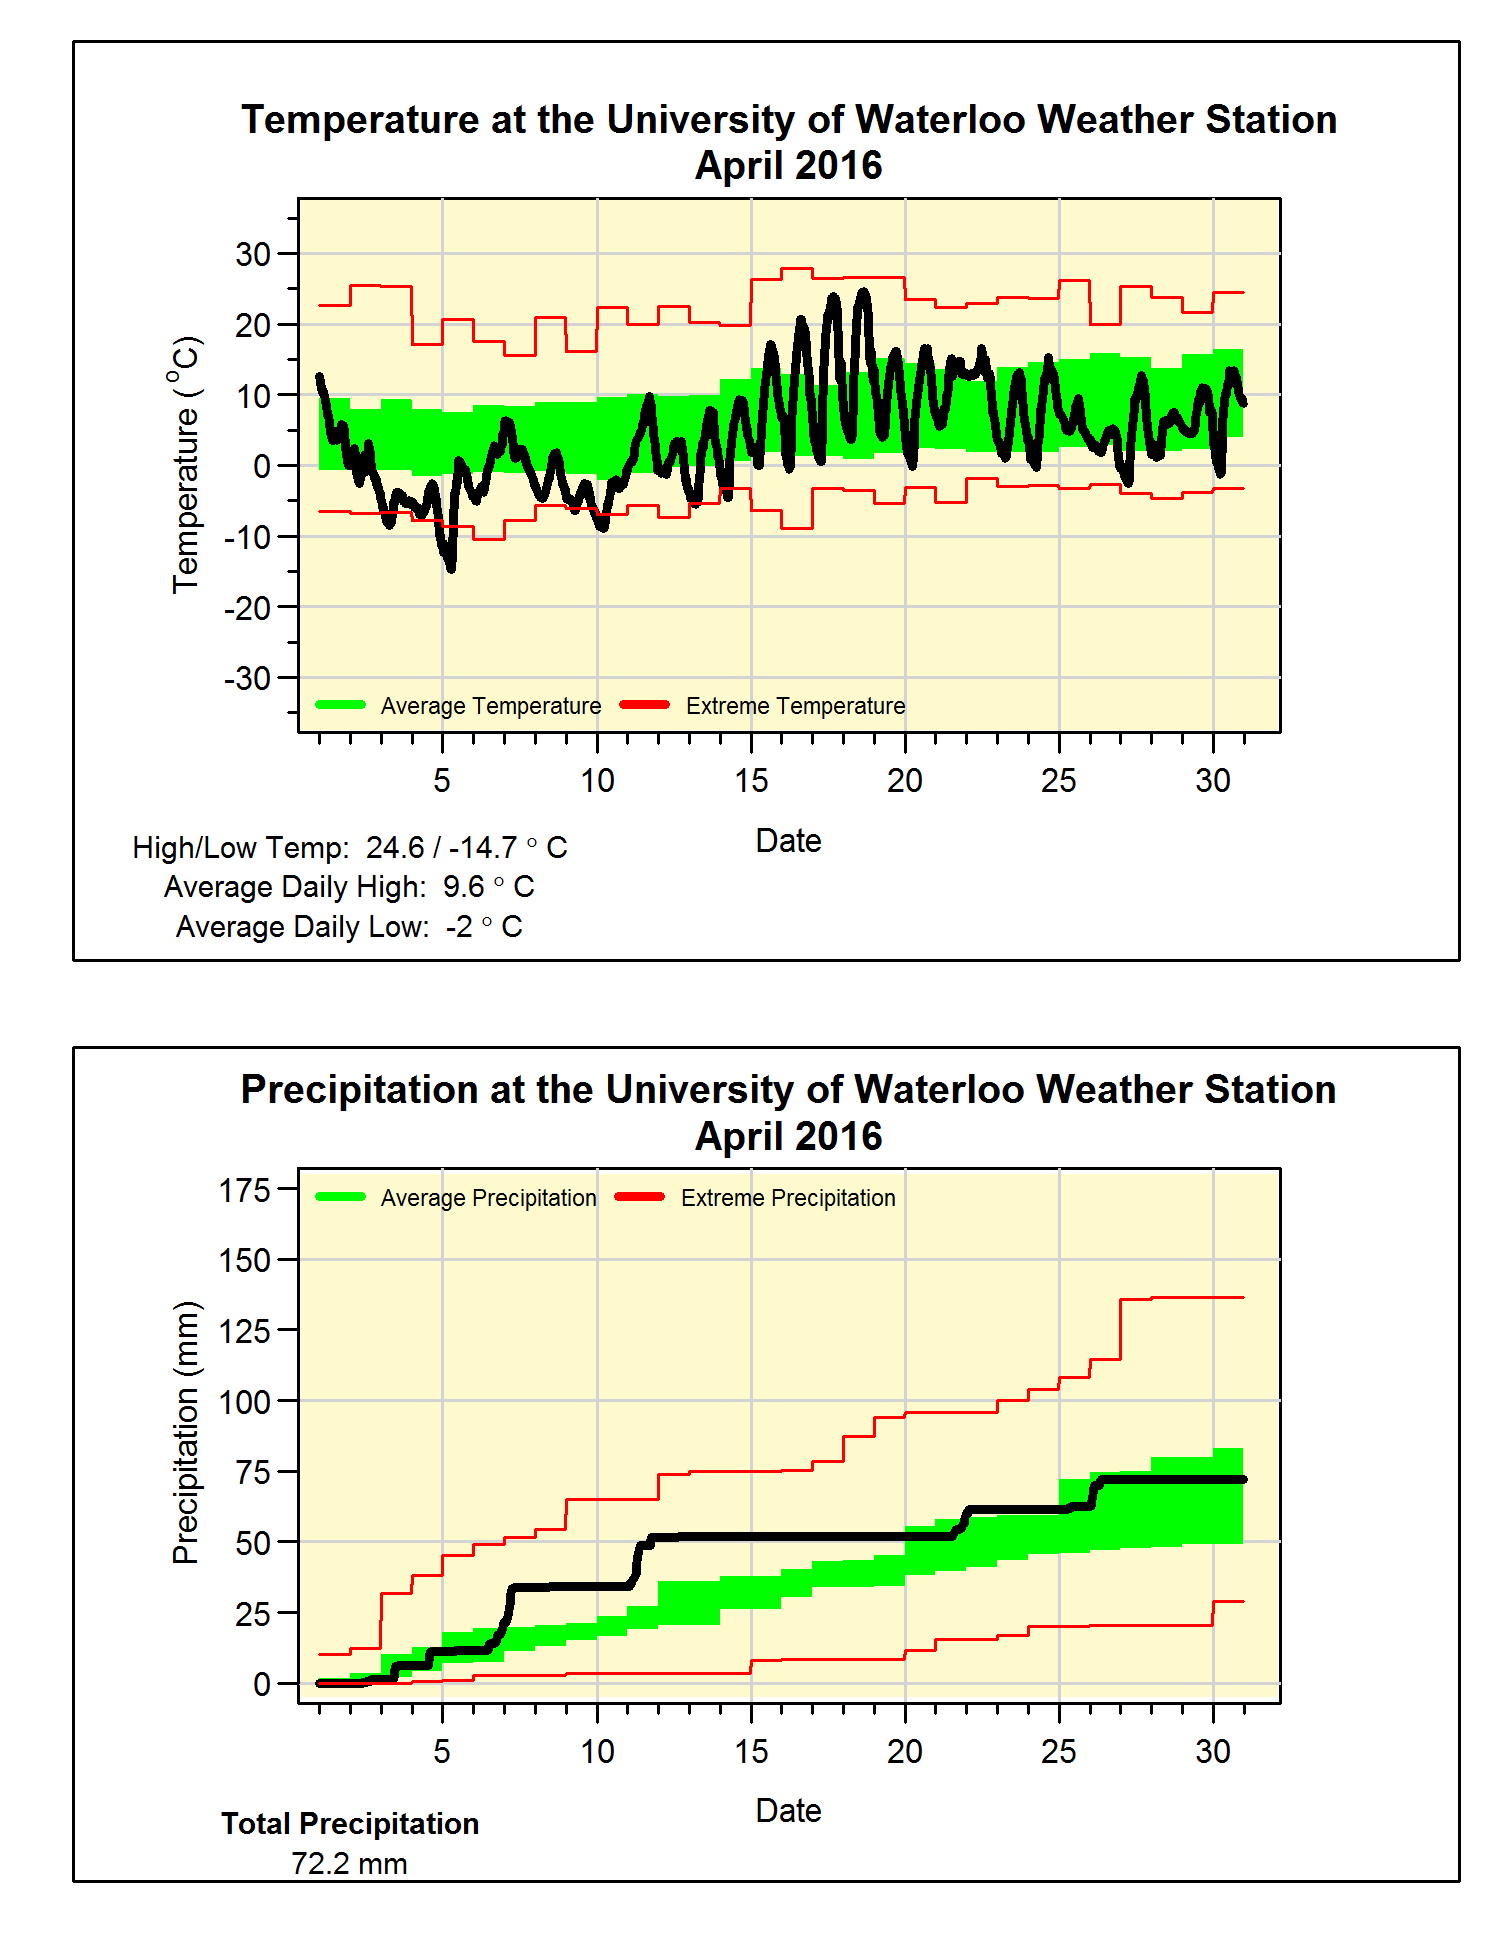
Apart from a week in April that taunted us with spring-like temperatures, the rest of the month was pretty cold.  This resulted in a colder than average month (2.3 degrees below) for the first time in over a year and the coldest April since 1995. 

Another interesting note is that the minimum temperature on the 5th of -14.7°C was the fourth coldest April temperature we have seen in the over 100 years of records in the region.

Not much of interest as far as precipitation, the total of 72.2 mm was just a bit below the average of 74.5 mm.  The total for the year of 317.6 mm is still above the average of 264.4 mm.

This year shows why you can’t call an end to the snowfall season at the end of March, as the 28.5 cm that fell in April ranked as the second highest month of the season (12.5 – Nov, 8.5 – Dec, 36.5 – Jan, 17.5 – Feb, and 18 – March).  This month kept the total (121.5 cm) below the average of 159.5 cm.

  
Summary for April 2016:
Maximum Temperature 24.6°C
Minimum Temperature -14.7°C
Average Daily High Temperature 9.6°C (Long term average 11.5°C)
Average Daily Low Temperature -2.0°C (Long term average 0.8°C)

Total Precipitation 72.2 mm (Long term average 74.5 mm)

(Long term averages based on 1981-2010 data for the Waterloo Wellington Airport)

Sunday, April 3, 2016

March 2016 Summary


A very wet and warm March

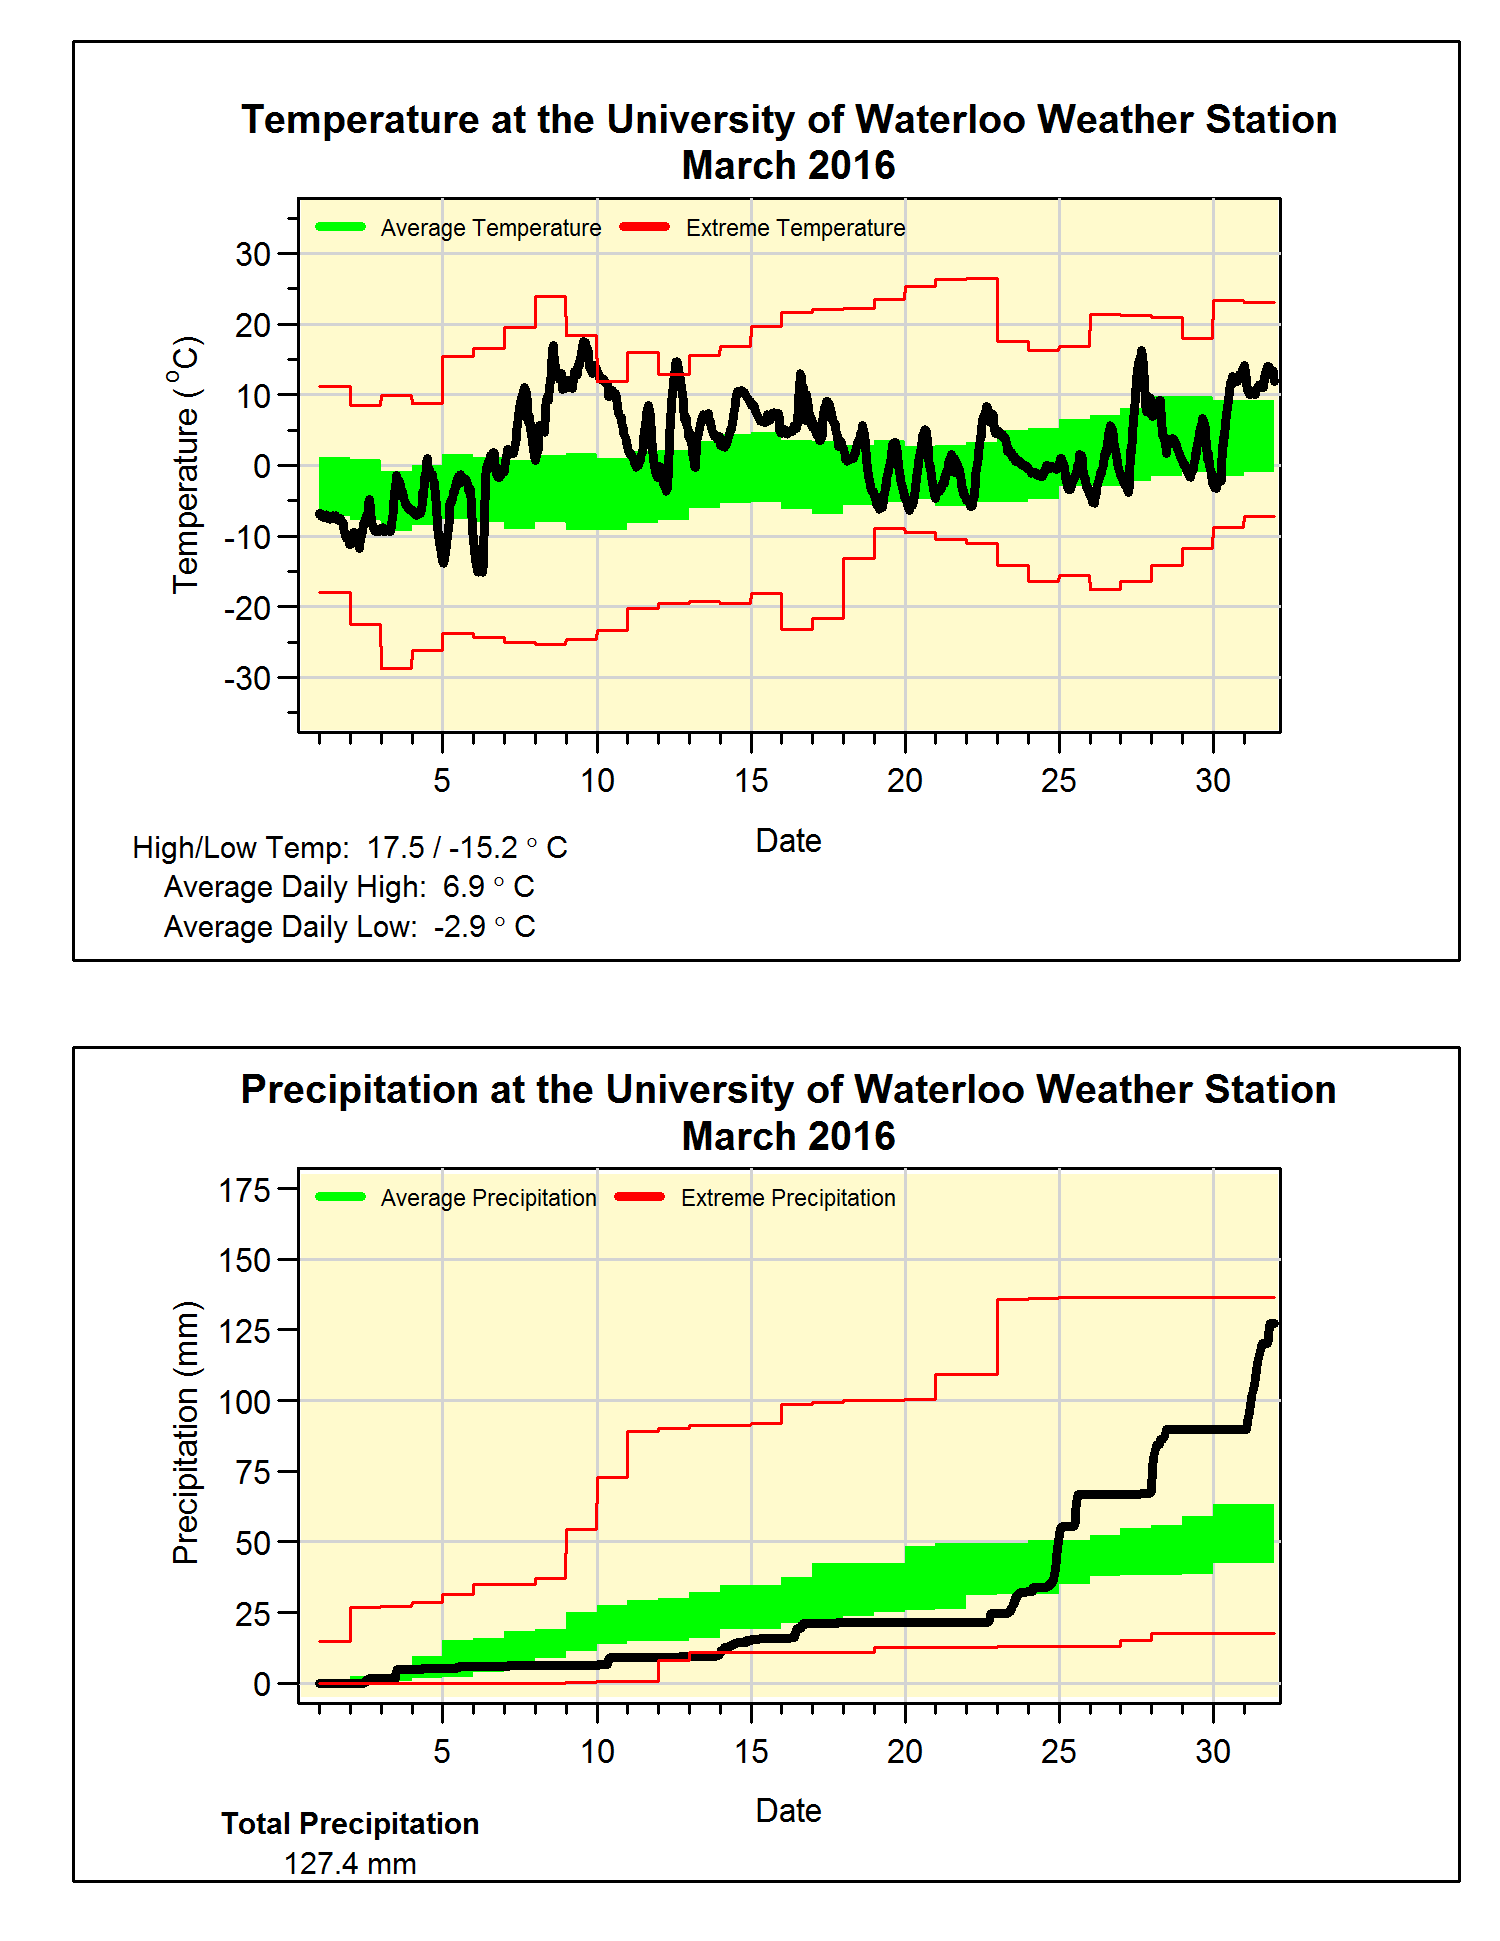
March started with an early taste of Spring, including a high of 17.5°C on the 9th, and as the rest of the month only saw a few colder than average days, it isn’t surprising that overall it was 3 degrees above average.  Although this seems impressive, it didn’t come close to March of 2012 when it was an incredible 7 degrees above average.

For a while it was looking like it might end up being a dry month, however from the 24th to the 31st we were deluged with 95 mm of precipitation.  This put the total for the month at 127.4 mm, which is more than double the average of 61.0 mm and the 5th wettest in the 100 years of weather data in the region.

Even with the spring-like weather for a lot of the month, there was a decent amount of snow (18 cm), although that is less than the average of 26.5 cm.  The total snowfall of 93 cm is still well below the average total of 152 cm for this time of year.


Summary for March 2016:
Maximum Temperature 17.5°C
Minimum Temperature -15.2°C
Average Daily High Temperature 6.9°C (Long term average 3.6°C)
Average Daily Low Temperature -2.9°C (Long term average -5.6°C)
Total Precipitation 127.4 mm (Long term average 61.0 mm)


(Long term averages based on 1981-2010 data for the Waterloo Wellington Airport)

Tuesday, March 22, 2016

Winter 2015/16 Summary


I did this one as a series of tweets:

Winter 15/16 Summary #1: The temperature was 3.3 degrees above average, second warmest in 100 year history of weather records in the region

Winter 15/16 Summary #2: The precipitation of 178.2 mm was just a little under the 1981-2010 average of 184.5 mm.

Winter 15/16 Summary #3: So far we have seen about half of the average amount of snowfall, however that could change this week.

Winter 15/16 Fun Fact 1: The warmest winter in the region was in 2011-12 which ended with that crazy March featuring temperatures in the mid-20s

Winter 15/16 Fun Fact 1: Longest streak of days without an above zero temperature: This winter 9 Days, last winter 41 Days.

FS

Tuesday, March 8, 2016

February 2016 Summary

Another warm month with average precipitation

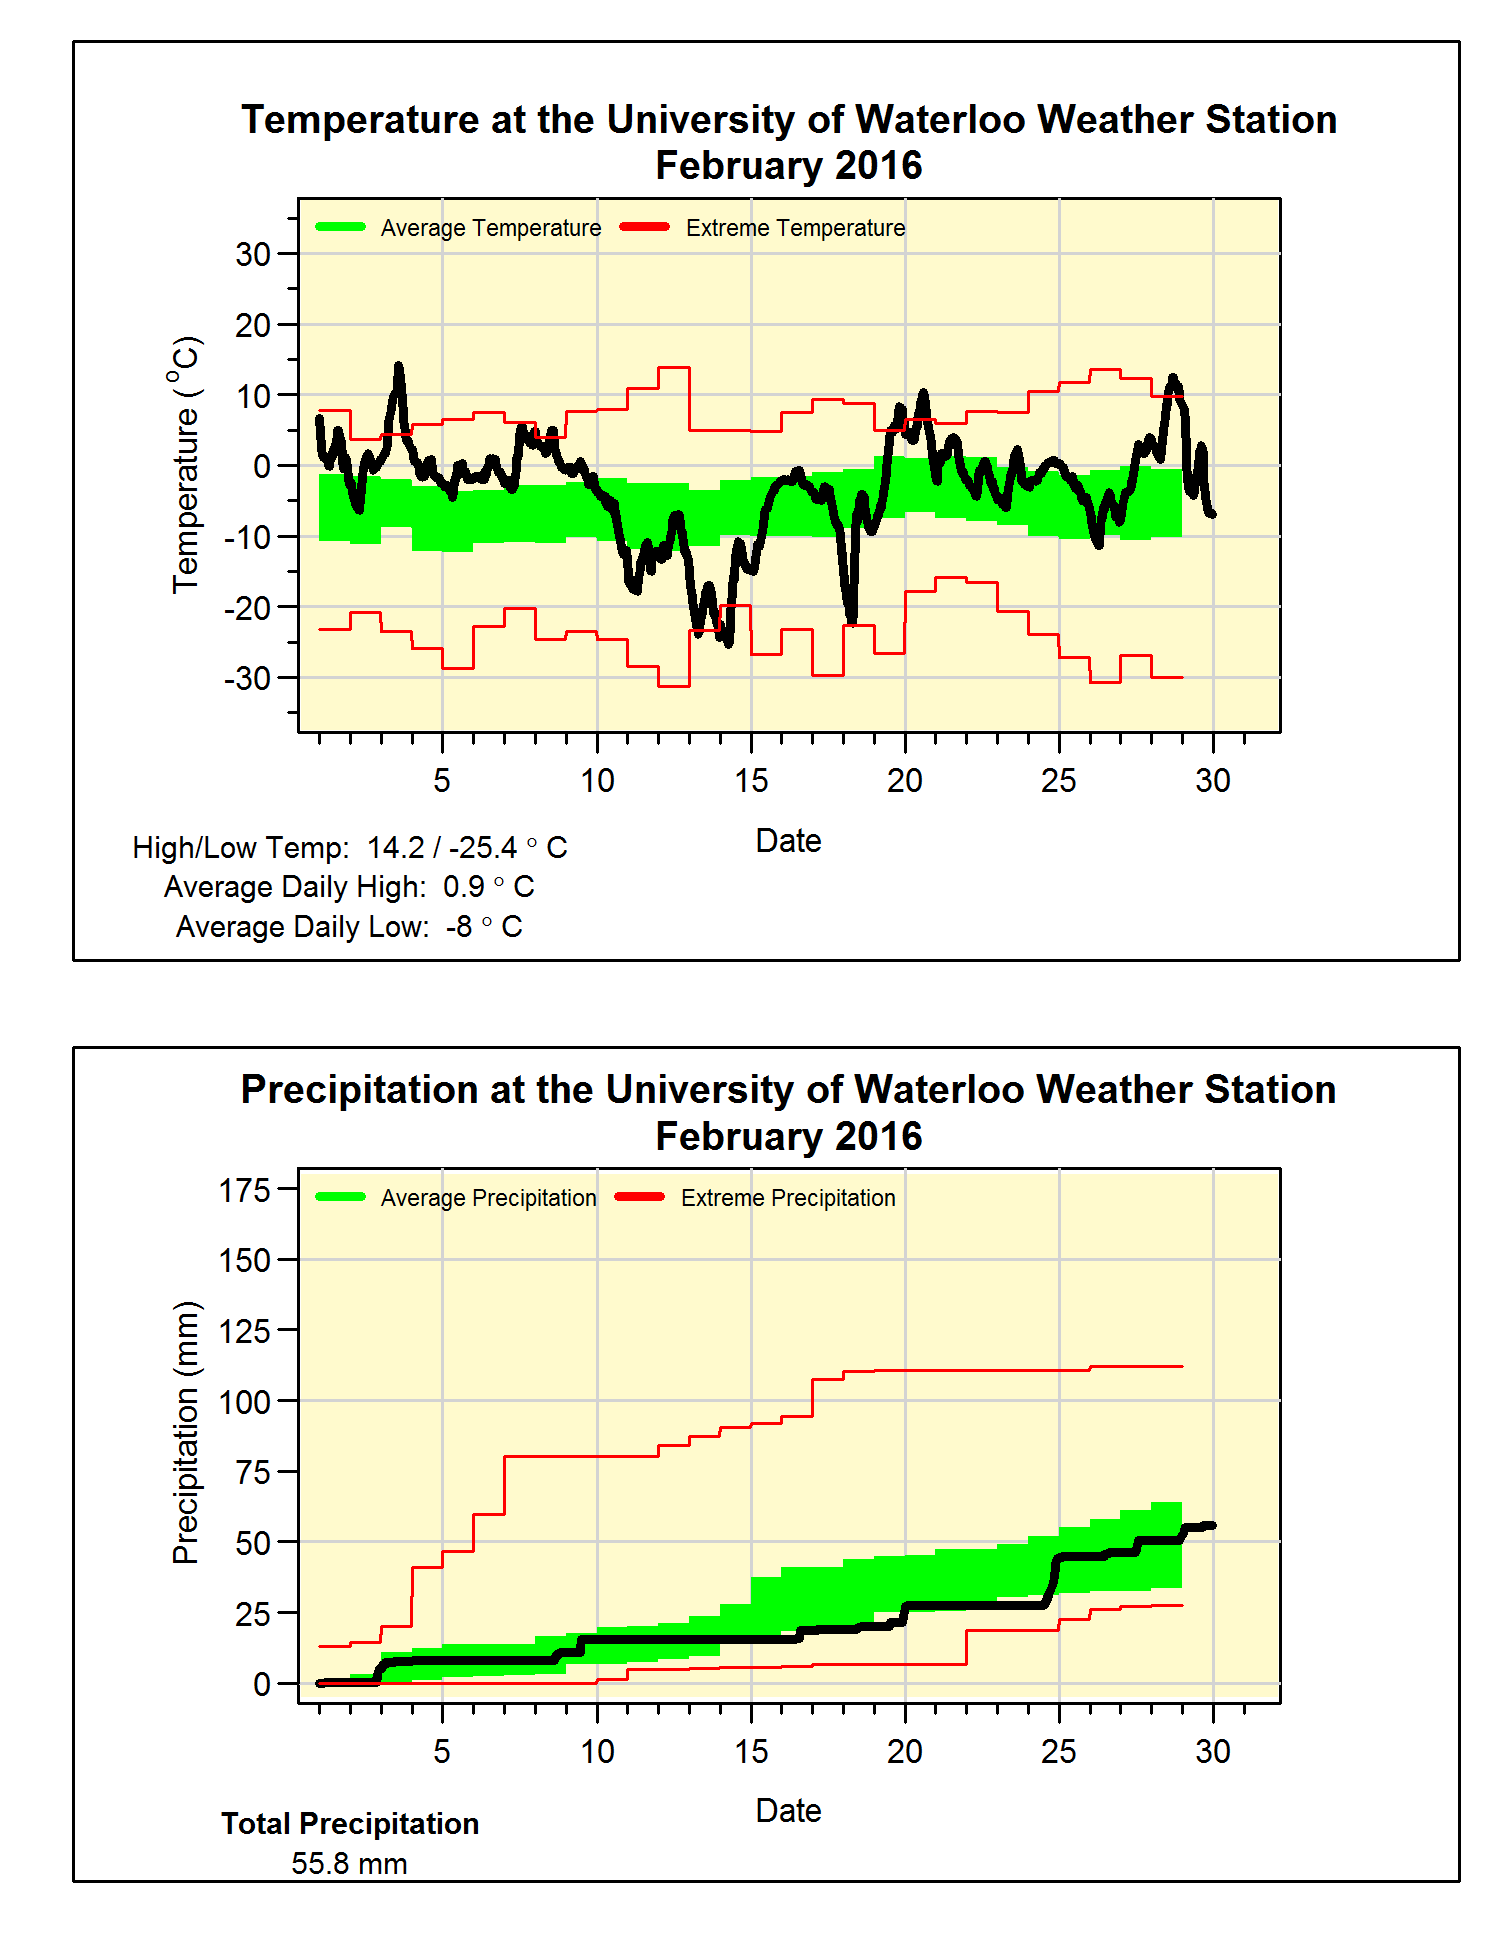
It was a month that saw some very warm and also some very cold temperatures.  However, the warms ones greatly outnumbered the cold ones resulting in a month that was almost 2 degrees above the long term average.  This is a lot, but we only have to go back to 2012 to find a warmer one.

Of note is that the high of 14.2°C on the 3rd was the highest February temperature we have ever seen in the over 100 years of records in the region.  This beat the 13.9°C on February 12th, 1999.

Not many large storms during the month, with the final total precipitation of 55.8 mm ending up pretty close to the average of 54.9 mm.  While the 17.5 cm of snow in February was just a little over half of the average of 30.3 cm.
                                                           
Summary for February 2016:
Maximum Temperature 14.2°C
Minimum Temperature -25.4°C
Average Daily High Temperature 0.9°C (Long term average -1.2°C)
Average Daily Low Temperature -8.1°C (Long term average -9.7°C)
Total Precipitation 55.8 mm (Long term average 54.9 mm)

(Long term averages based on 1981-2010 data for the Waterloo Wellington Airport)