Sunday, December 2, 2018

November 2018 Summary


A wet November that was the coldest in over 20 years

The colder temperatures that started in mid-October continued throughout November, with an overall temperature over 2 degrees below average it was the coldest November since 1996.  This put it at the 5th coldest in the over 100 year history of weather records in the region.  As well, the low temperature on the 22nd of -16.8°C was the coldest November temperature since November 23rd, 2000 when it was -17.9°C.

The total precipitation for the month of 93.4 mm was only a bit above the average of 87.1 mm, but enough to put into the above average range.  This puts the total for the year at 878.5 mm compared to the average of 832.9 mm.

The real story of the precipitation was the 21.5 cm of snow we received in the first half of the month, this is the most for the first half of the month since 1995 when we had 25 cm.  The rest of November only saw a little more resulting in a total of 23.5 cm, which is still a lot more than the average of 13 cm for the month.

Summary for November 2018:
Maximum Temperature 13.5°C
Minimum Temperature -16.8°C
Average Daily High Temperature 3.0°C (Long term average 6.3°C)
Average Daily Low Temperature -2.4°C (Long term average -1.4°C)

Total Precipitation 93.4 mm (Long term average 87.1 mm)
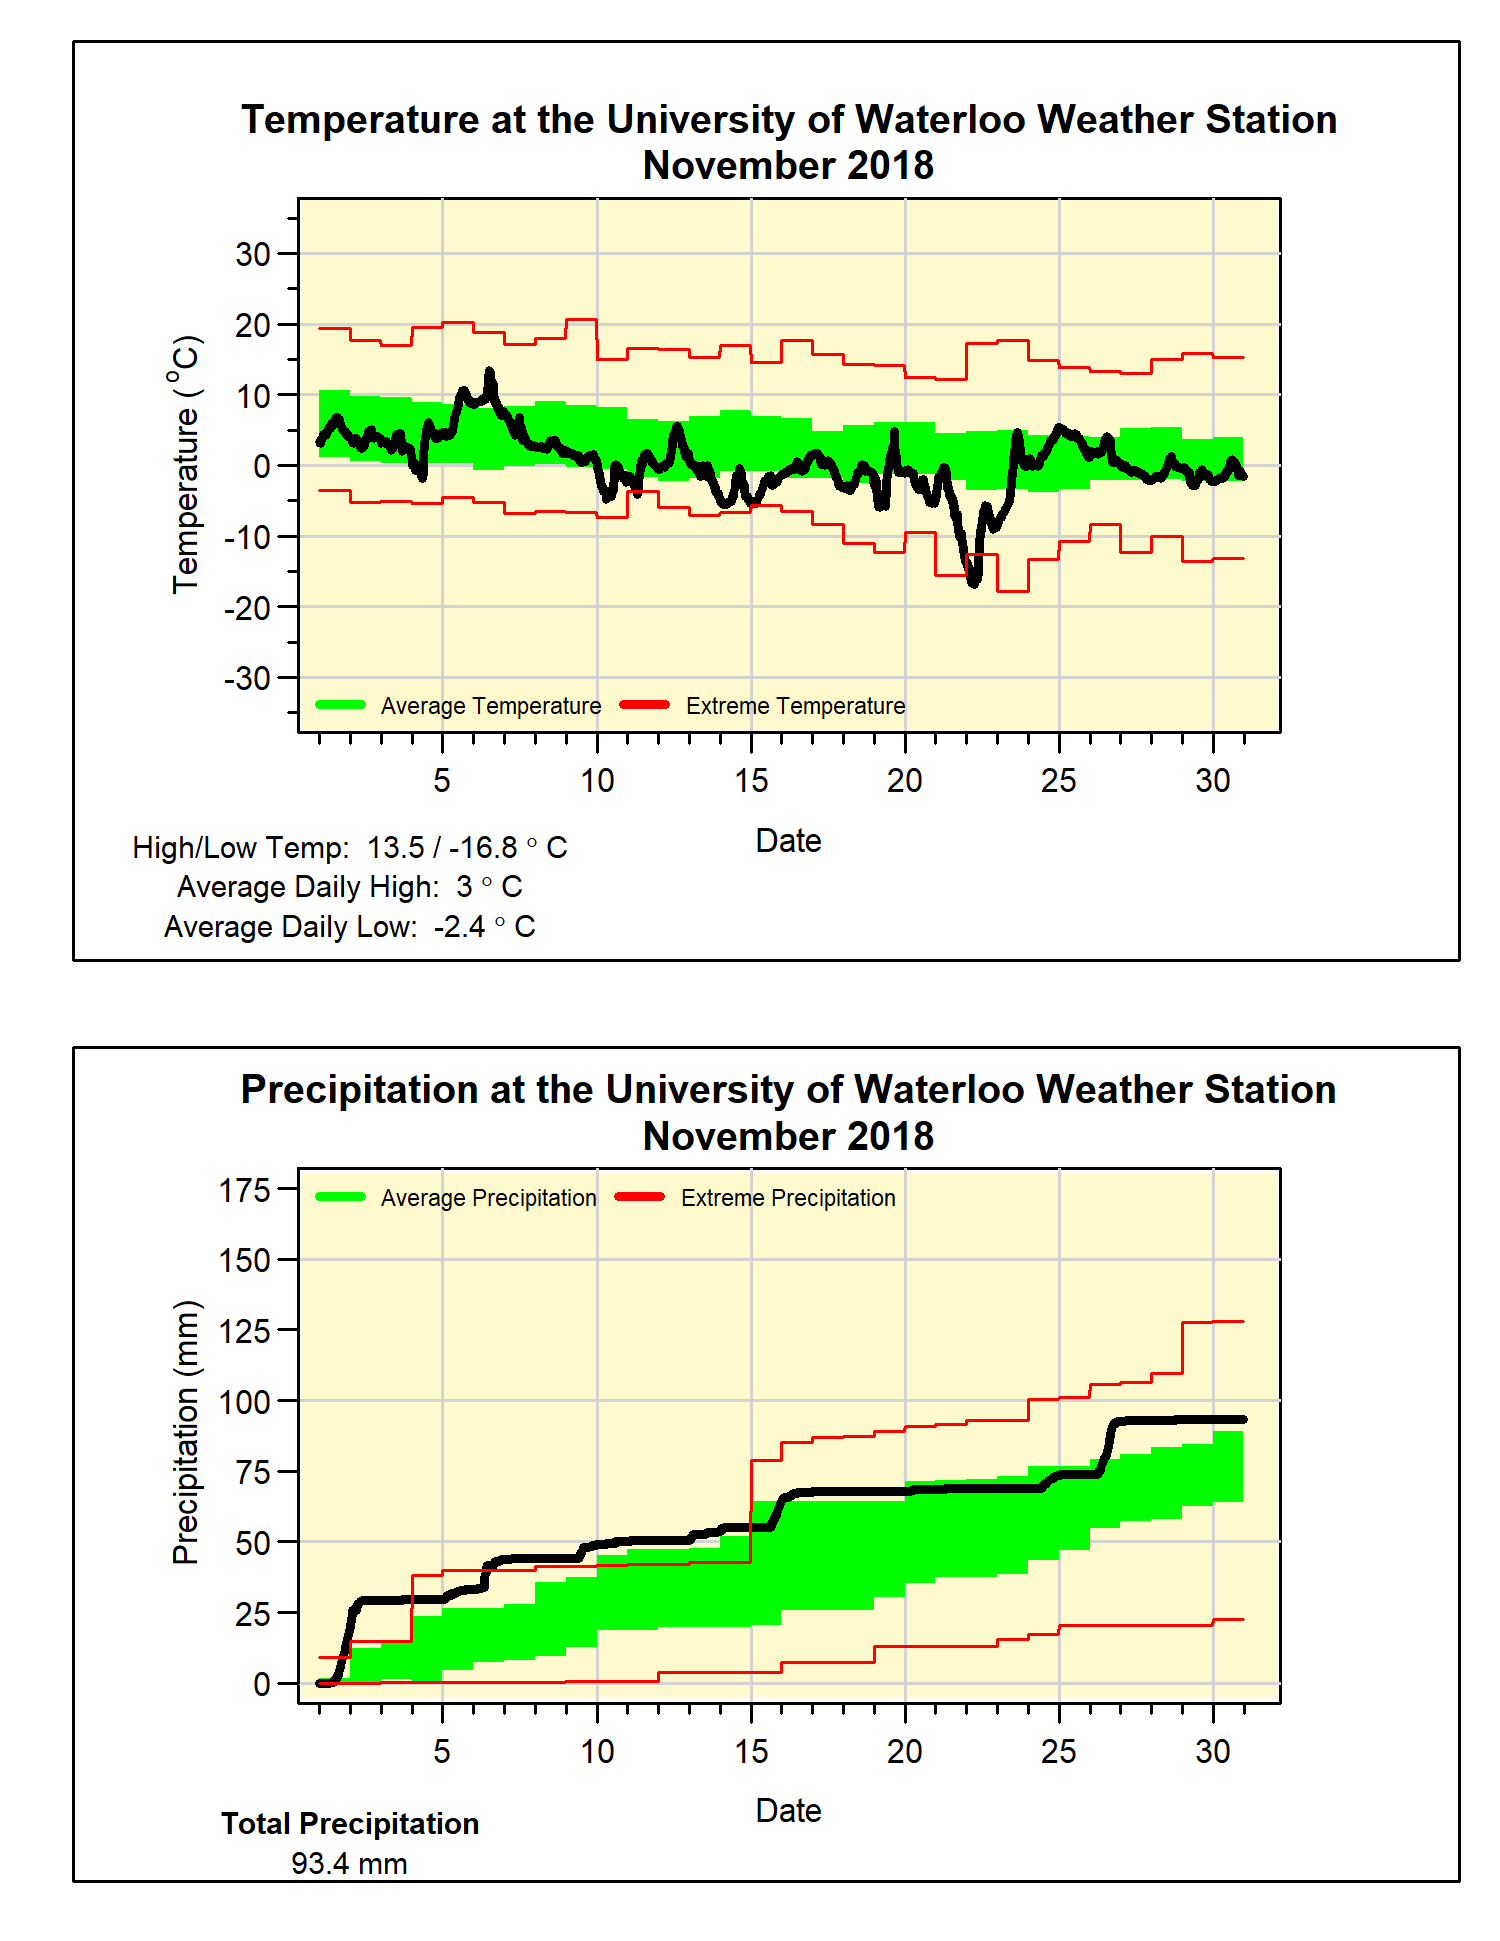
(Long term averages based on 1981-2010 data for the Waterloo-Wellington Airport)


Thursday, November 1, 2018

October 2018 Summary

A wet October with average temperatures

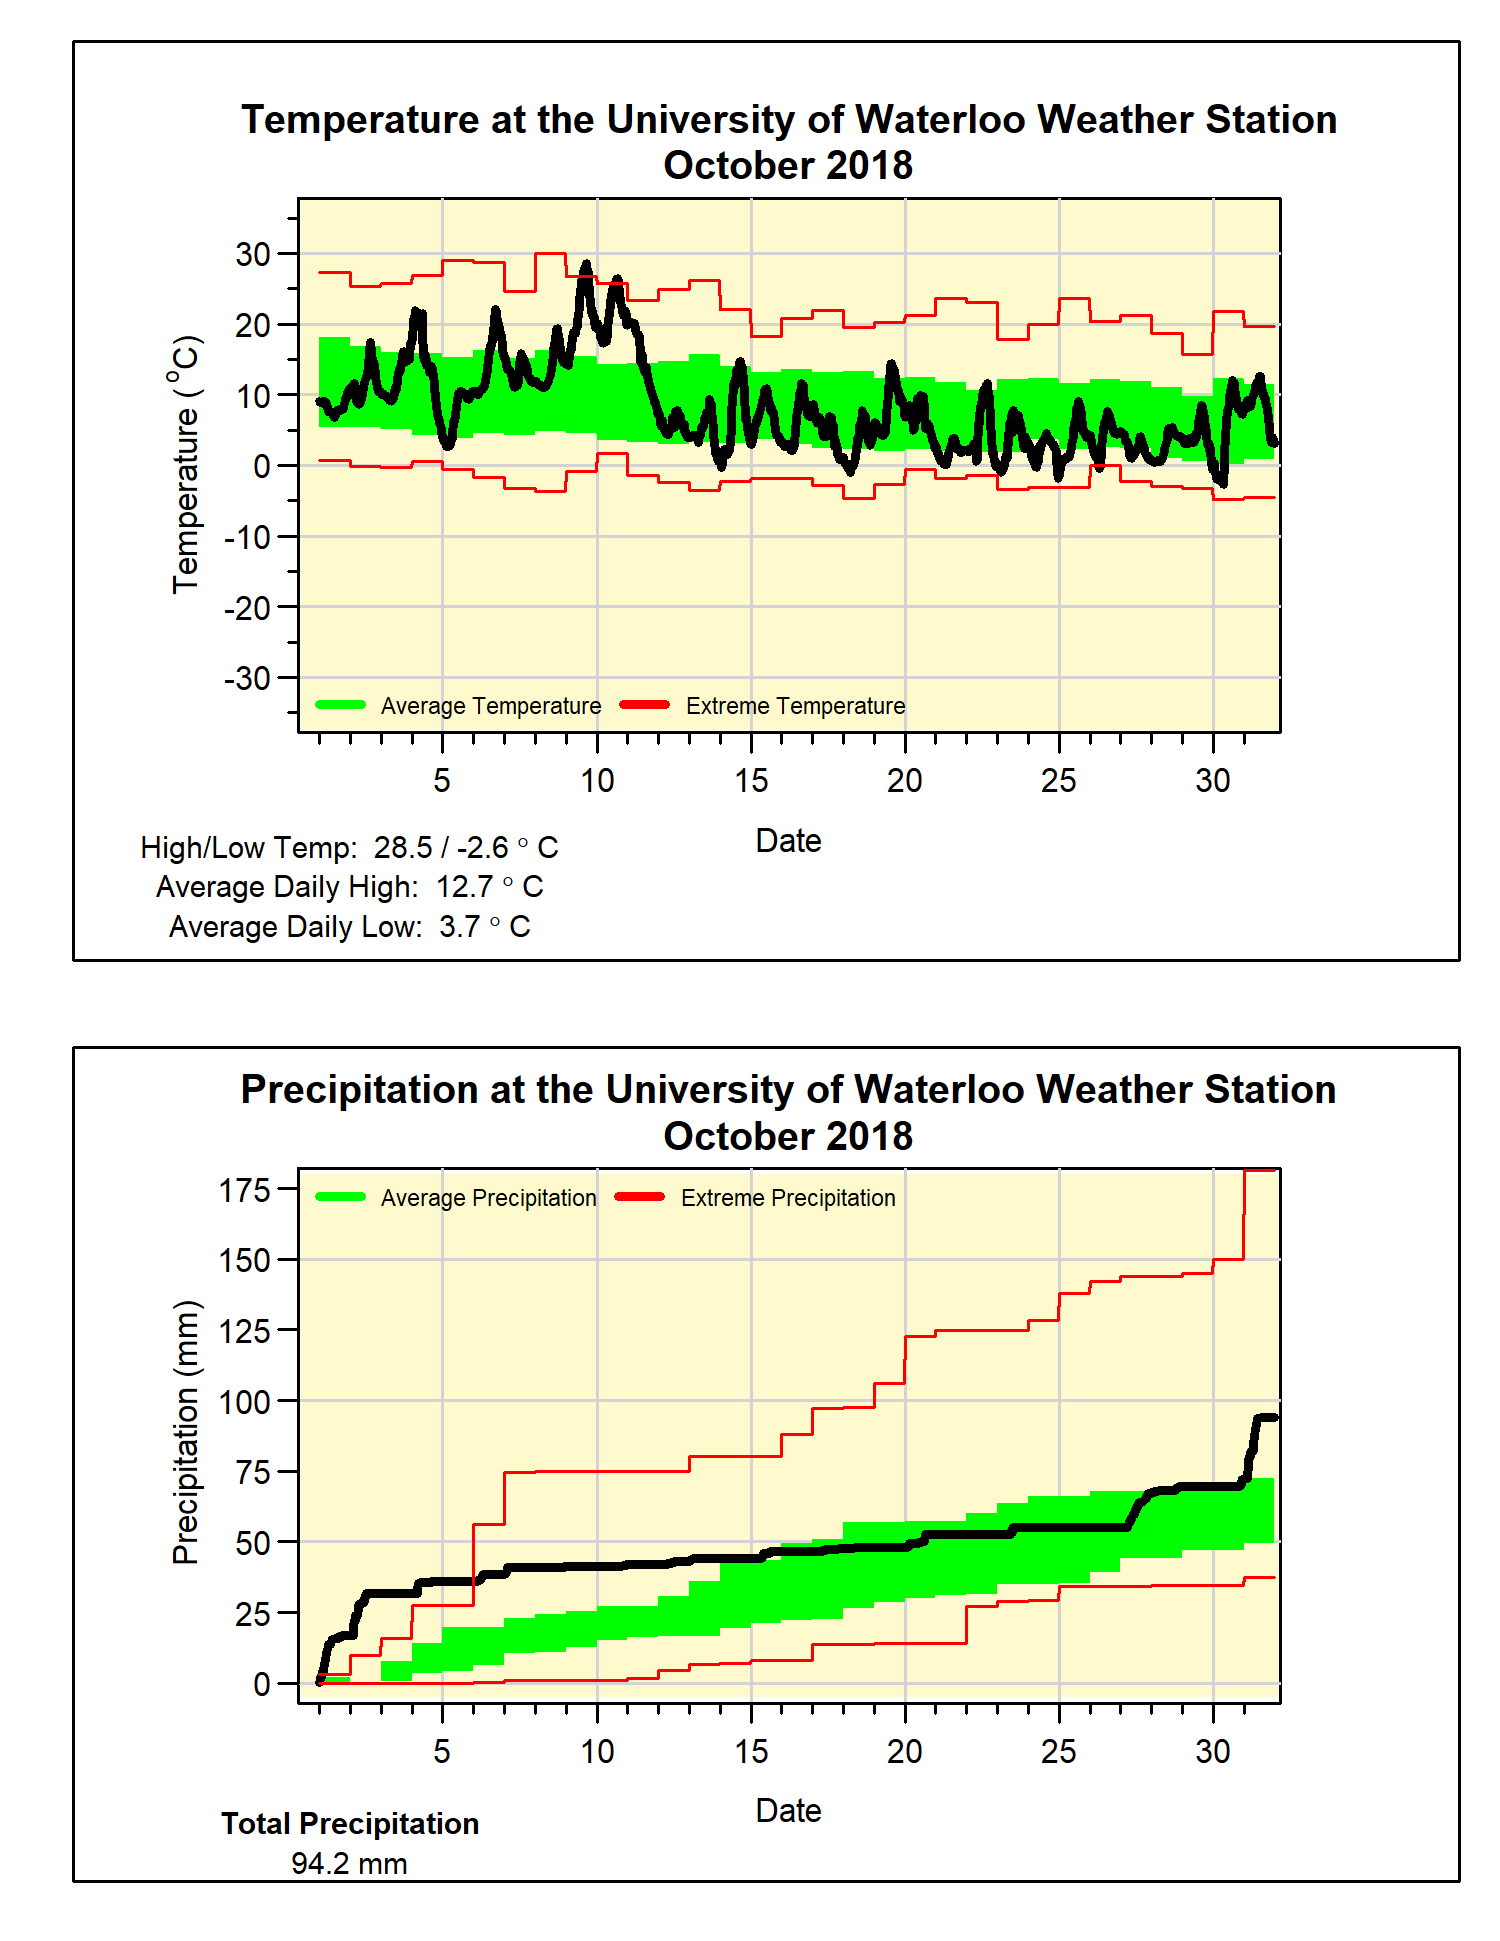
You can forget what the calendar said, fall really started this year on October 12th, you can see from the temperature graph just what a contrast there was between the first 11 days of the month and next 20.  In fact the average temperature during the first part of the month was 10 degrees higher than the second part.

Putting all those numbers together results in the overall temperature coming out exactly at the 1981-2010 average, although it may have seemed colder than that as it was the coldest October we have seen in the last 10 years.  The first time the temperature went below zero was on the 14th at 1:15 am (this is about the average for the last 20 years) resulting in a frost-free season of 167 days (which is just a bit longer than the average).

It was really wet at the start and end of the month, with over half of the month’s total of 94.2 mm coming during the first two days and the last day of the month.  As this month come in above average, it joins 9 of the last 10 years that were wetter than average.  This wet month also pushes the total precipitation in the first 10 months of 785.1 mm above the average of 750.6 mm.

Summary for October 2018:
Maximum Temperature 28.5°C
Minimum Temperature -2.6°C
Average Daily High Temperature 12.7°C (Long term average 13.5°C)
Average Daily Low Temperature 3.7°C (Long term average 2.9°C)
Total Precipitation 94.2 mm (Long term average 67.4 mm)

(Long term averages based on 1981-2010 data for the Waterloo-Wellington Airport)


Tuesday, October 2, 2018

September 2018 Summary


A very hot and somewhat dry September

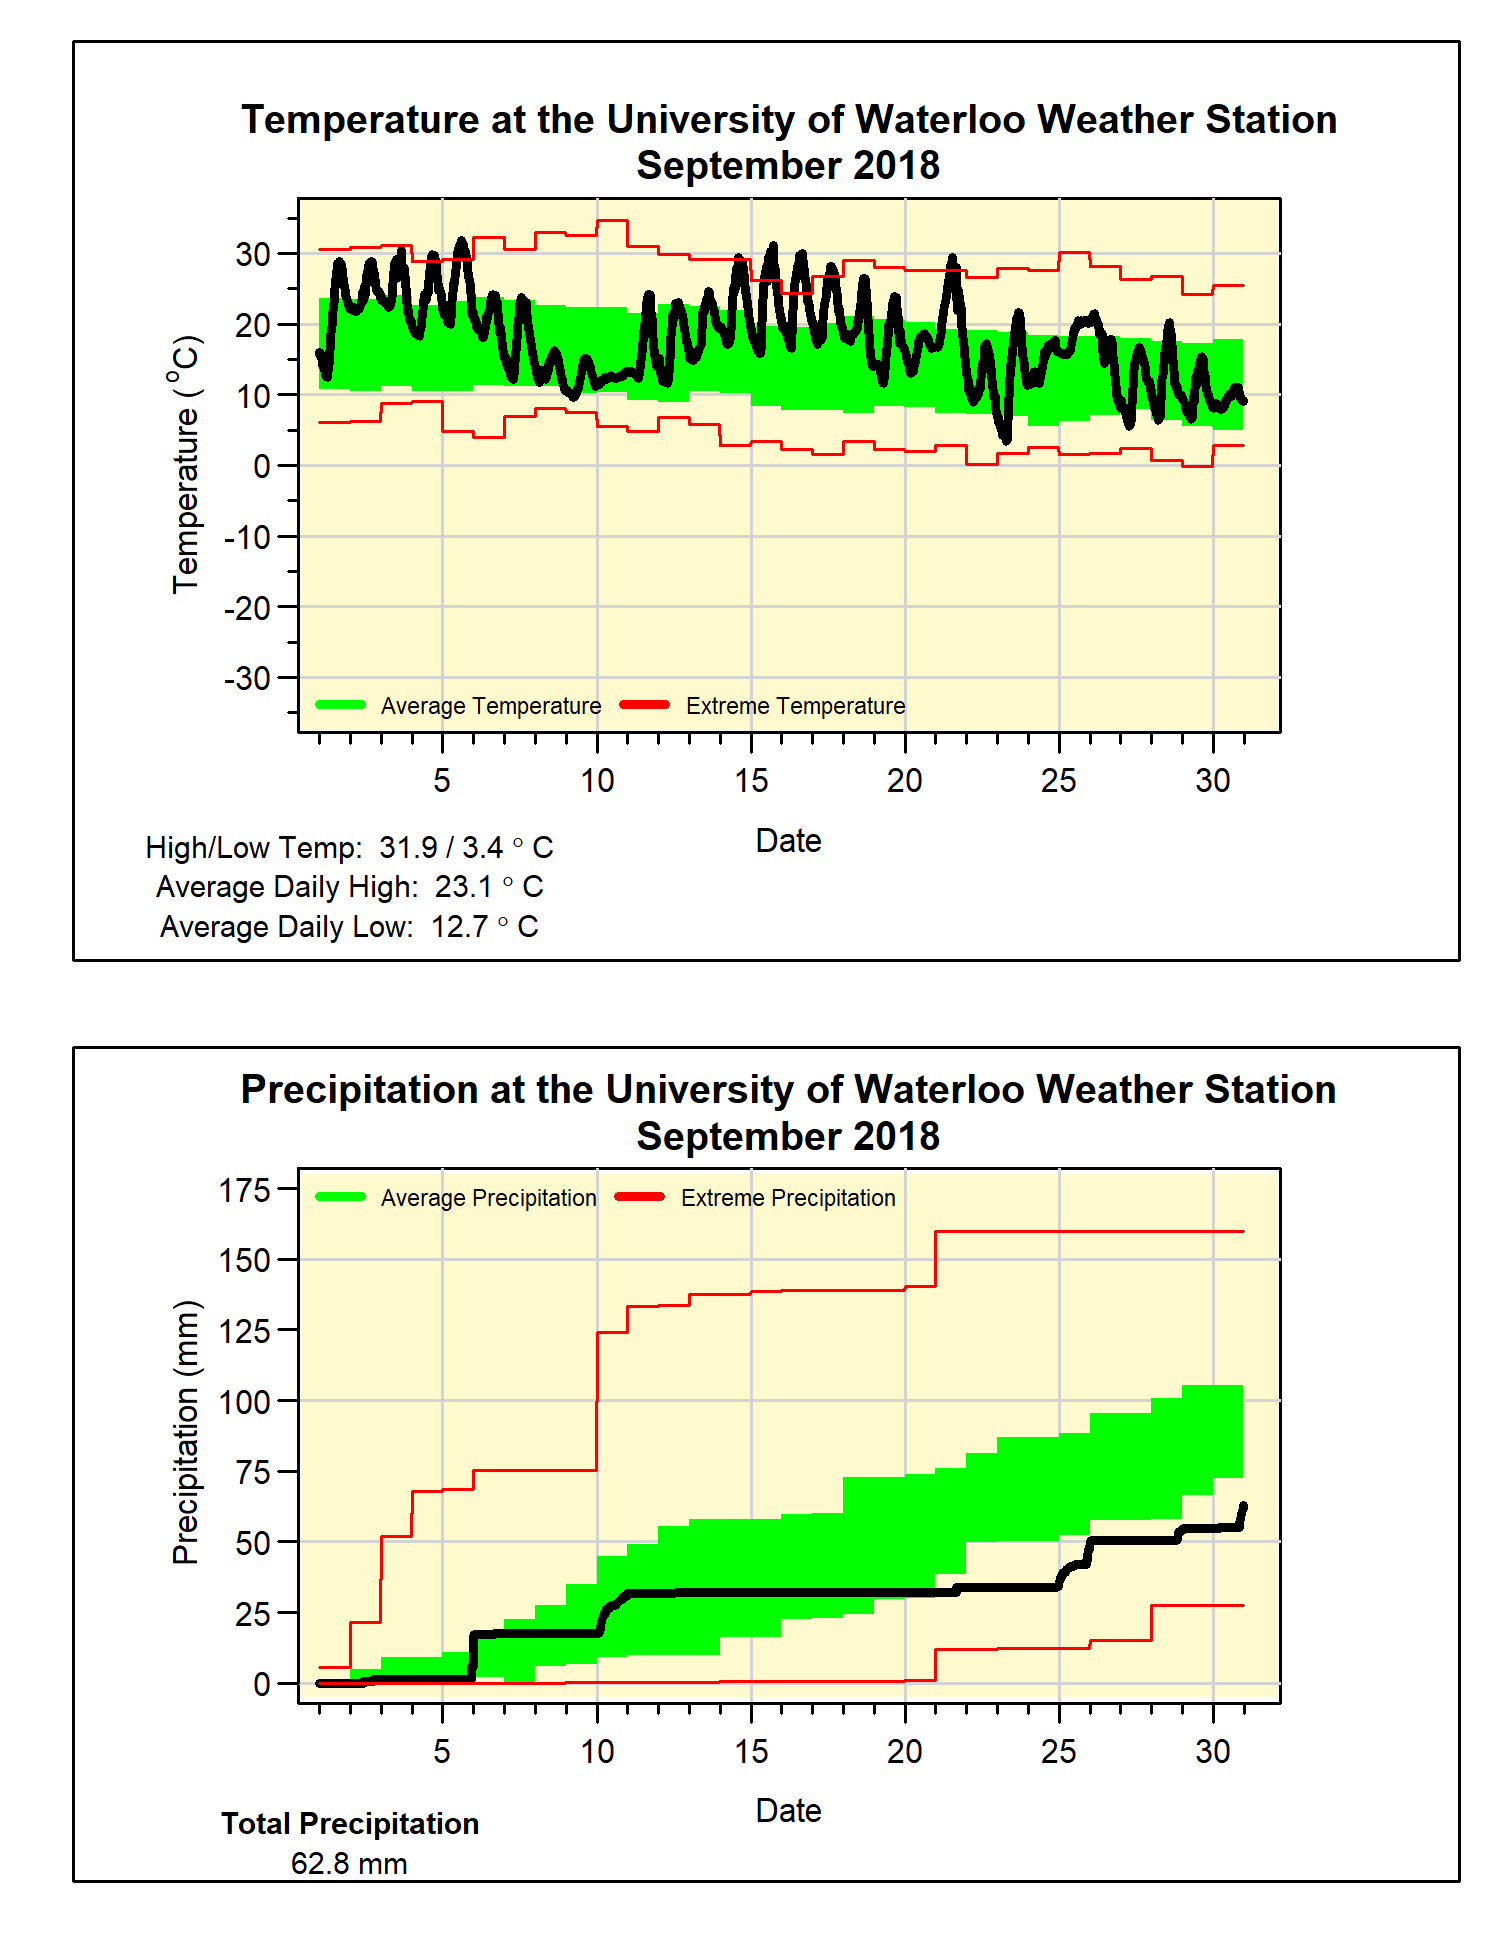
The month of September saw 2 different heat waves, it started with 5 days of temperatures close to 30°C and then another 5 that were above 25°C around the middle of the month.  Although there were a few cooler days in between, the average temperature was almost 3.5 degrees above average.  This resulted in it being the 5th warmest September in the 100+ years of records in the region.

A couple of other random facts about this past September: The 5 days 30°C or over were the most since 1952.  The average low temperature was 4 degrees above average, this is the third highest in the historical record.  This month continues the pattern of warm Septembers we have seen recently, with only 1 in the past 20 years slightly below the 1981-2010 average and the rest above.

A dry 10 day period in the middle of the month resulted in the total precipitation (62.8 mm) coming in well below the average (87.8 mm).  The amount of precipitation we have seen so far this year of 690.9 mm is just slightly above the average of 683.5 mm.

Summary for September 2018:
Maximum Temperature 31.9°C
Minimum Temperature 3.4°C
Average Daily High Temperature 23.1°C (Long term average 20.4°C)
Average Daily Low Temperature 12.7°C (Long term average 8.6°C)
Total Precipitation 62.8 mm (Long term average 87.8 mm)

(Long term averages based on 1981-2010 data for the Waterloo-Wellington Airport)


Sunday, September 2, 2018

August 2018 Summary


A hot August that was also wet

Well that was a very hot August, coming in at 2.8 degrees above the 1981-2010 average making it the second warmest in the past 20 years and in the top 10 in the 100 years of data in the region.  It was a consistent warmth with the average temperature of only one day (the 22nd) being below average.

Although the days were warm, the heat didn’t go away overnight as the daily low temperatures were the warmest in 20 years.  Which means that if you didn’t have air conditioning it may have been difficult to sleep.

Despite a dry period of about a week, there were also 3 days above 20 mm of precipitation resulting in a total for August of 110.7 mm compared to the average of 83.9 mm.  This wet month brought the total precipitation for the year of 628.1 mm back above the average of 596.0 mm for this time of year.


Summary for August 2018:
Maximum Temperature 31.9°C
Minimum Temperature 10.5°C
Average Daily High Temperature 27.1°C (Long term average 24.8°C)
Average Daily Low Temperature 16.3°C (Long term average 12.9°C)
Total Precipitation 110.7 mm (Long term average 83.9 mm)

(Long term averages based on 1981-2010 data for the Waterloo-Wellington Airport)


Wednesday, August 1, 2018

July 2018 Summary


A hot and very dry July

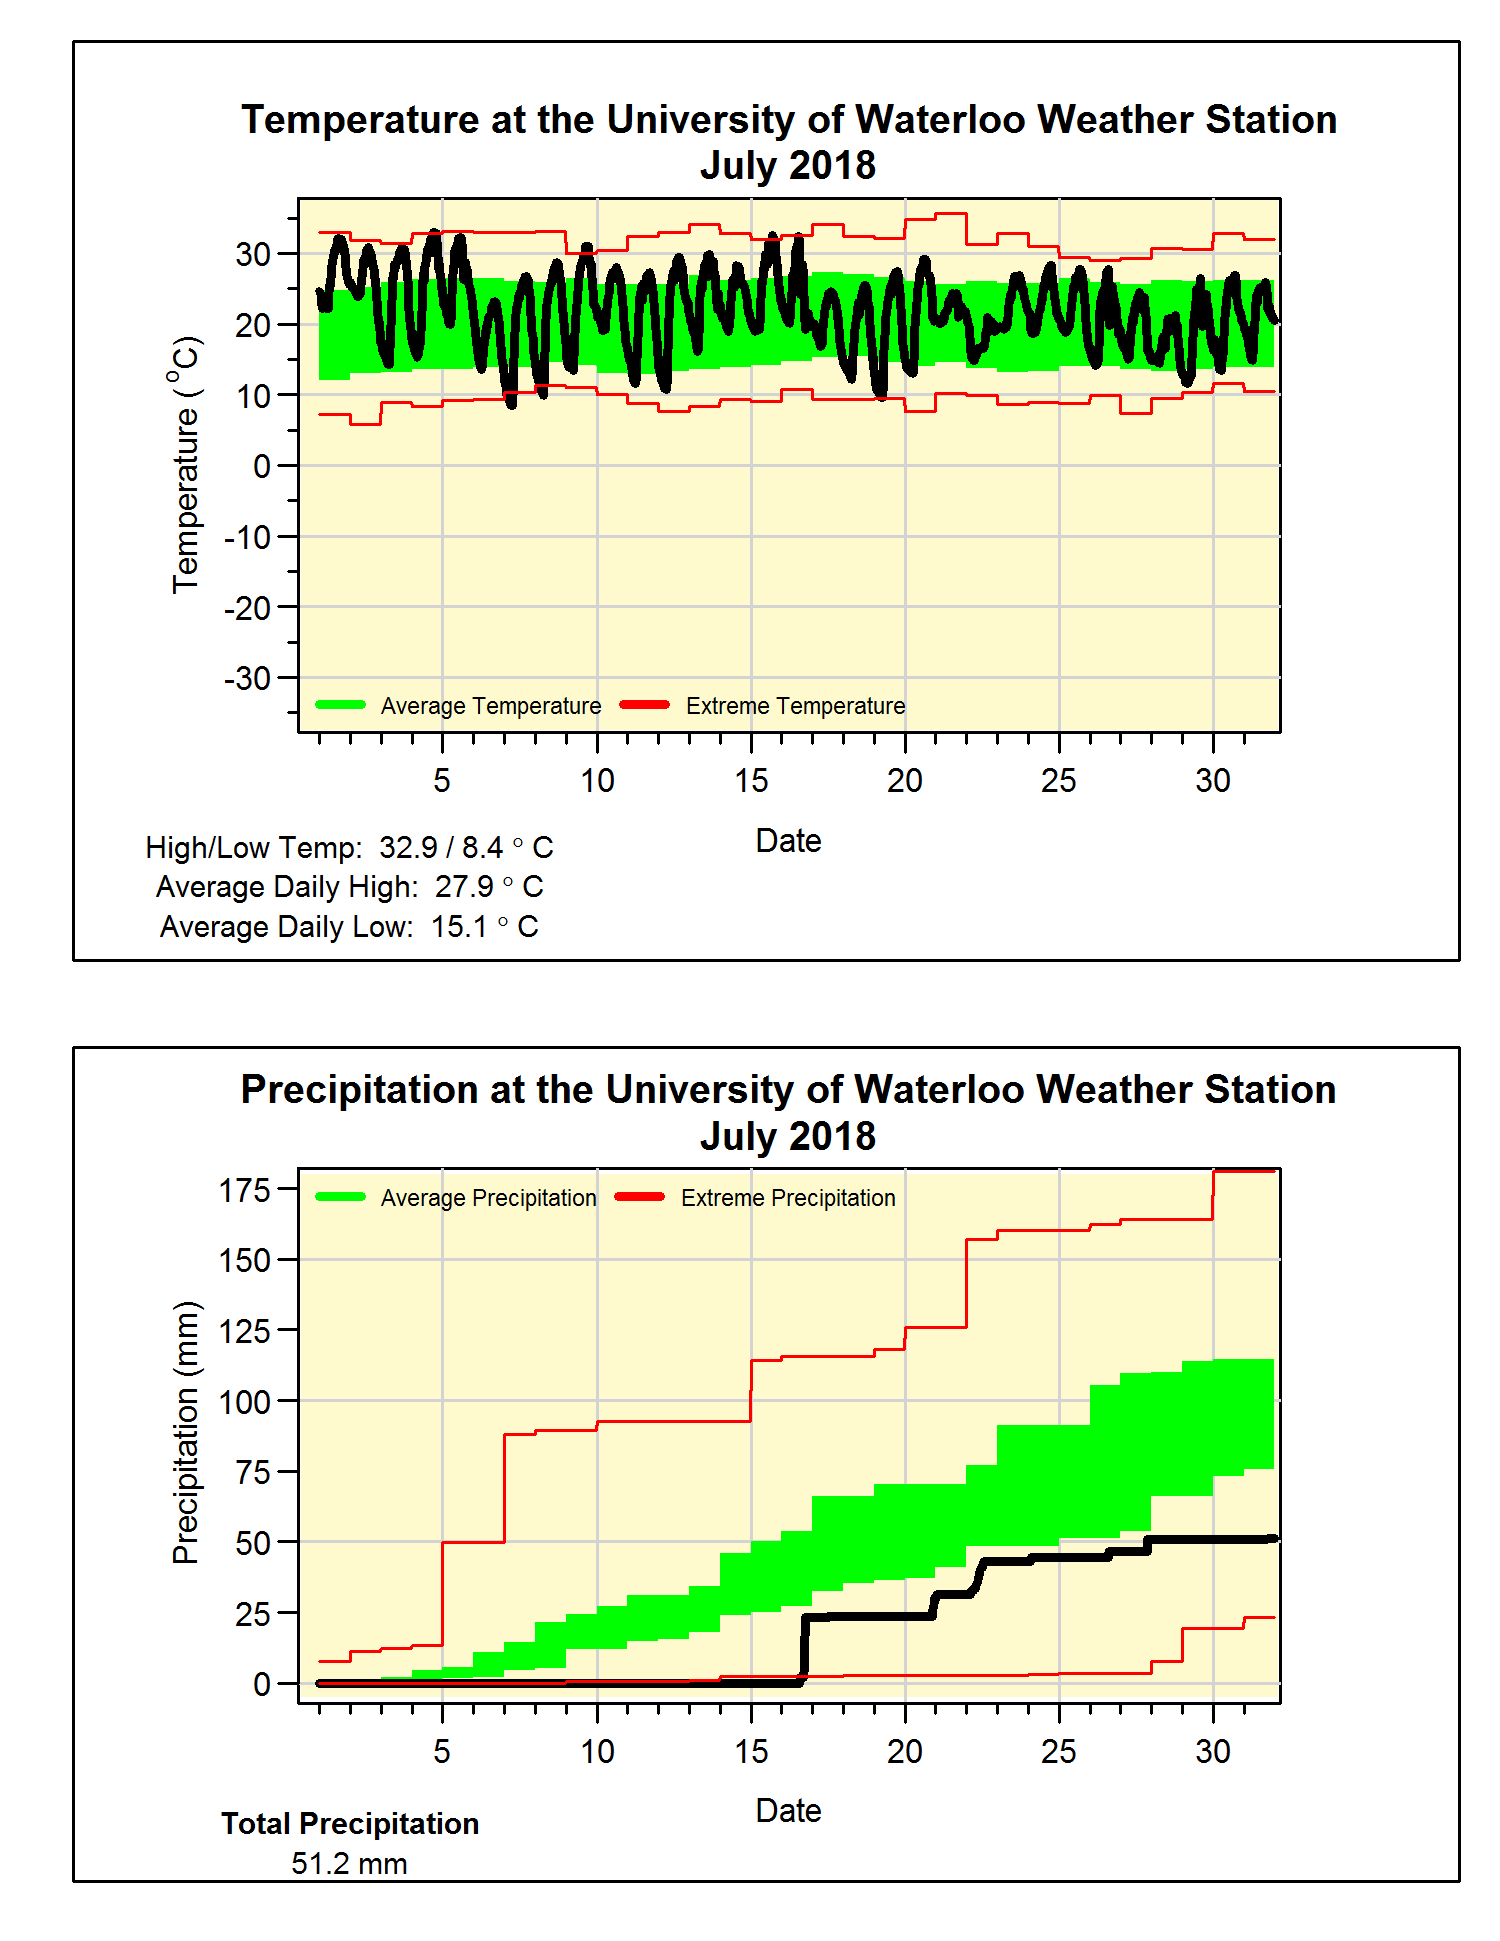
We have now had our third month in a row of above average temperatures with July coming in at 1.5 degrees warmer than average.  However, it was the tale of the two halves of the month with the first half being 2 degrees warmer than the second half.  That first half of the month also saw all of the 10 days that were above 30°C, something we only see 3.5 times on average in July.

The bigger story was the lack of rain during the first 15 days of the month, which combined with the high temperatures, made it hard for non-irrigated vegetation.  We broke that drought with 23.4 mm on the 16th followed by what was a pretty average rest of July.  However, this could not fill the deficit and the final total of 51.2 mm was only a little more than half the average total of 98.6 mm.

But even as hot and dry as that seems, note that we only have to go back to 2012 to find a July that was both hotter and drier.

This dry month brought the total precipitation for the year of 517.2 mm back down closer the average of 509.0 mm.


Summary for July 2018:
Maximum Temperature 32.9°C
Minimum Temperature 8.4°C
Average Daily High Temperature 27.9°C (Long term average 26.0°C)
Average Daily Low Temperature 15.1°C (Long term average 14.0°C)
Total Precipitation 51.2 mm (Long term average 98.6 mm)

(Long term averages based on 1981-2010 data for the Waterloo-Wellington Airport)


Monday, July 2, 2018

June 2018 Summary


A hot and dry June

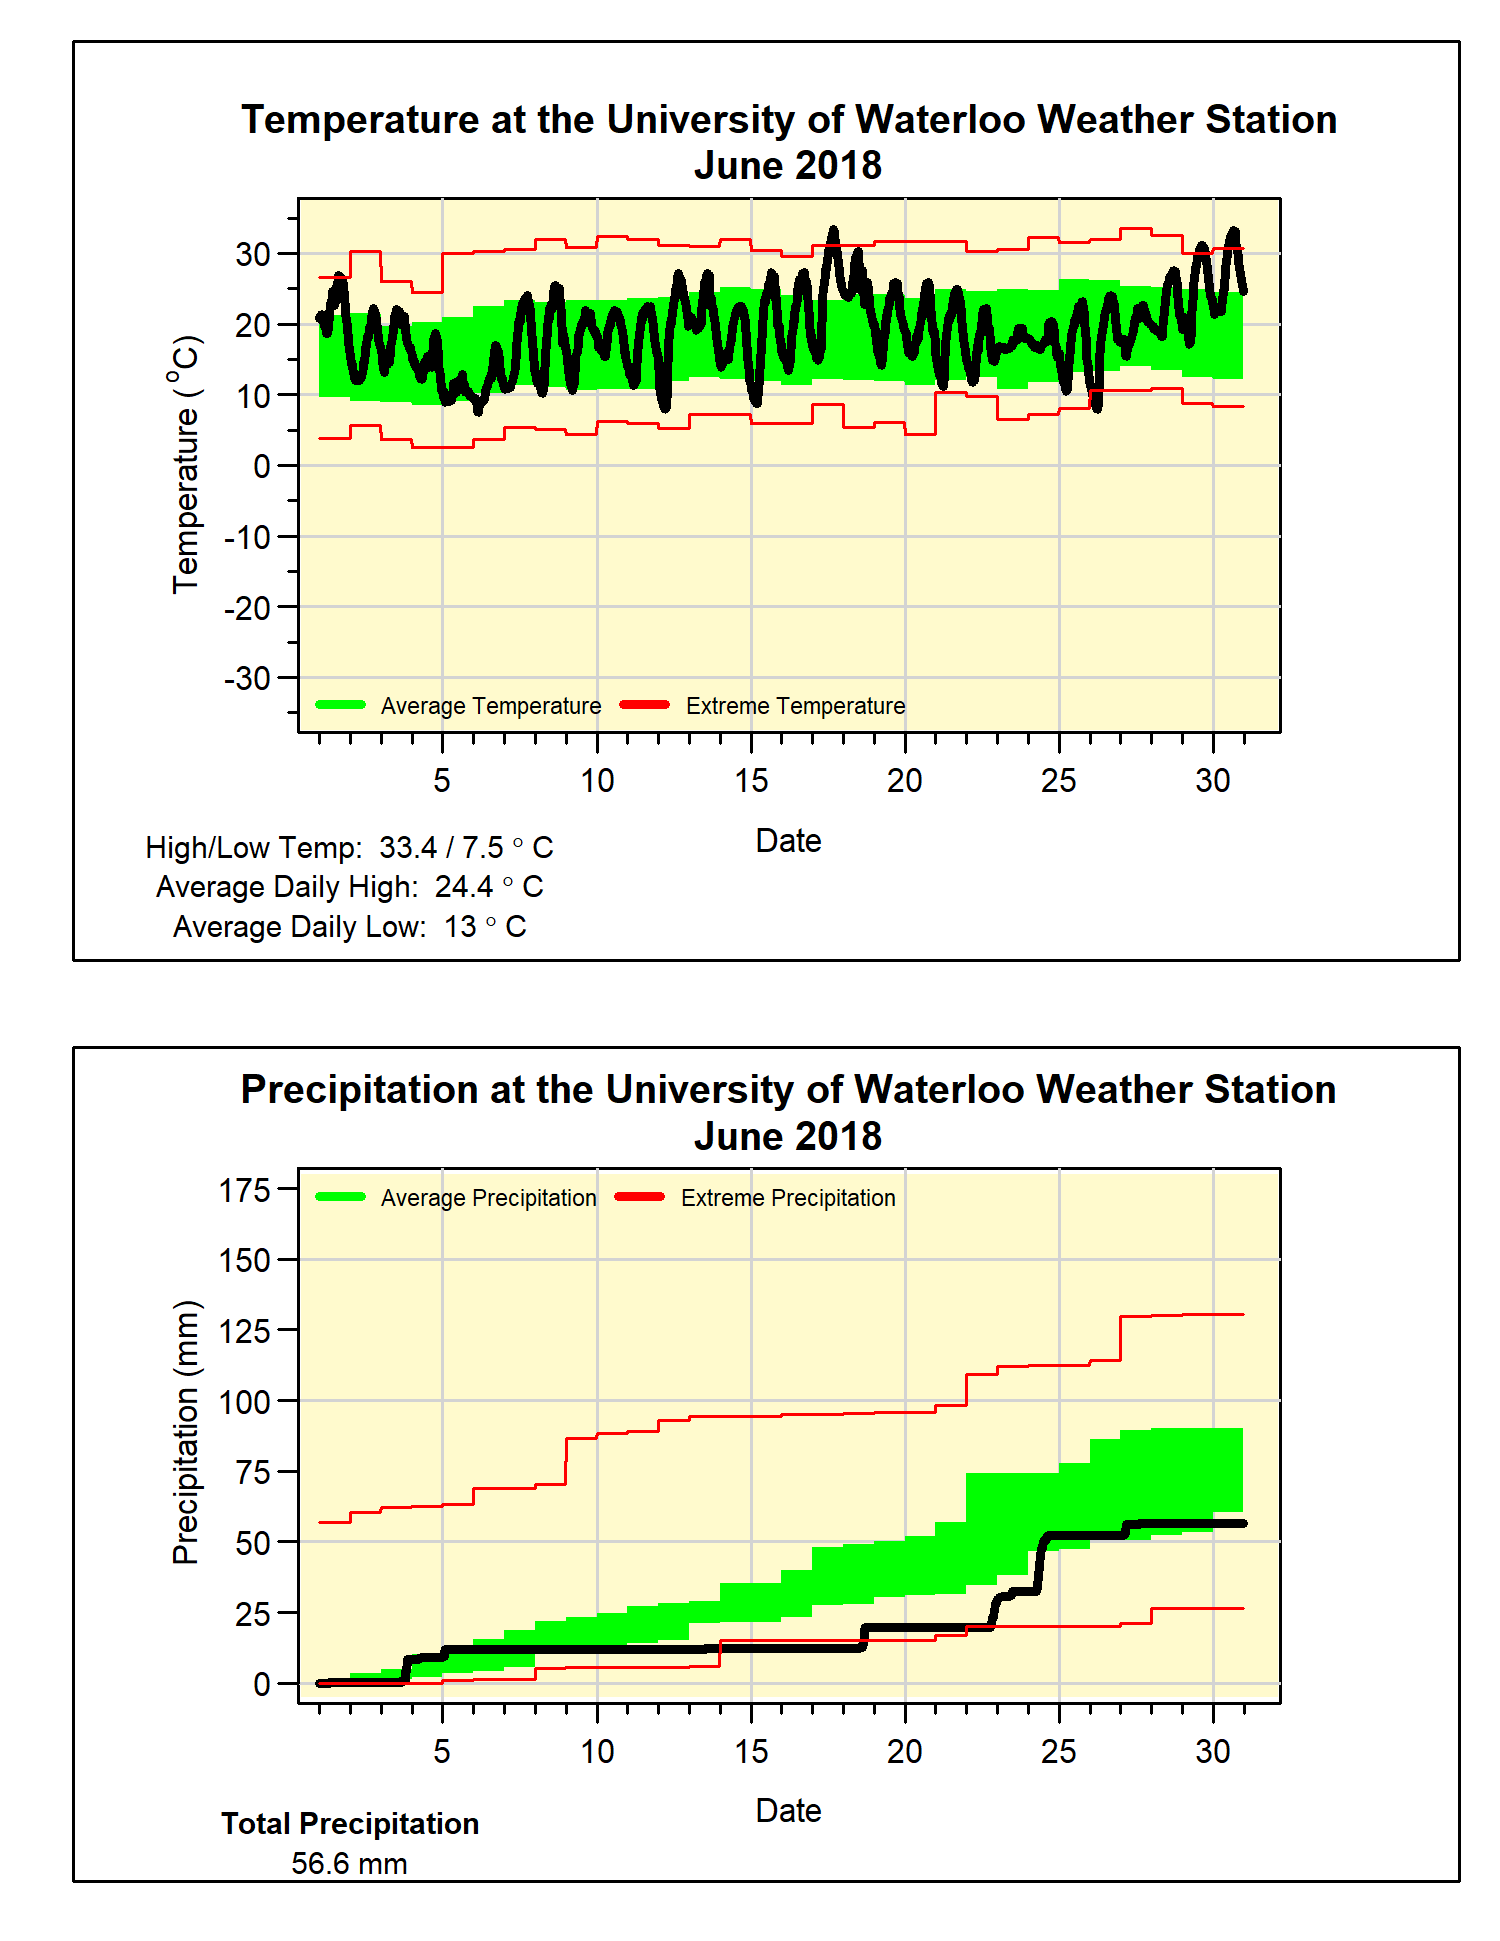
While coming down from May, which was 4.5 degrees above average, June was still more than 1 degree above average.  We have to go back to 2009 for the last time there was a June with below average overall temperature.

This year there were 4 days above 30°C, while the high temperature of 33.4°C on the 17th was the warmest June day since 2005 (when it was 33.5°C on the 27th).  That was almost topped on the last day of the month when it got up to 33.2°C.

It was a dry month that included a streak of 12 days when we received less than half of a millimetre of rain.  Even the 20 mm of rain that came down on the 24th only managed to put the total precipitation for the month (56.6 mm) just below the bottom of the average range (60.5 mm).

For the first half of the year, the total precipitation we have seen of 466.2 mm is not that far above what we would expect for the halfway mark of 416.1 mm.

Also a note about the sad news that professor Ric Soulis of the University of Waterloo Civil Engineering department passed away during June.  It is no exaggeration to say that without Ric there would be no UW Weather Station.  It was through his vision and guidance that the idea for the weather station was born and implemented.  He will be greatly missed by the many who got to know him throughout the years.

Summary for June 2018:
Maximum Temperature 33.4°C
Minimum Temperature 7.5°C
Average Daily High Temperature 24.4°C (Long term average 23.6°C)
Average Daily Low Temperature 13.0°C (Long term average 11.5°C)
Total Precipitation 56.6 mm (Long term average 82.4 mm)

(Long term averages based on 1981-2010 data for the Waterloo-Wellington Airport)


Monday, June 25, 2018

Ric Soulis (1949-2018)


I am saddened to share the news that Professor Ric Soulis passed away on June 21.  It is no exaggeration to say that without Ric there would be no UW Weather Station.  It was through his vision and guidance that the idea for the weather station was born and implemented.

My personal relationship with Ric started when he gave a 4th year Geological Engineering student an opportunity to complete an undergraduate thesis under his supervision back in 1990.  This then led to a Masters under his co-supervision with Dr. Nick Kouwen and afterward employment for over 10 years principally on the Mackenzie Basin GEWEX project (for which we co-authoured the chapter on Hydrologic modelling in the final report).  During this employment I also completed a part-time PhD under his supervision.  He always had a positive attitude towards life even given his struggles with post-polio syndrome that limited his physical activities.  He always made the time for any student to give them answers to a question or just share his views on science.

 I will forever be grateful for all the opportunities, mentorship, and friendship he provided me over these many years.

Frank Seglenieks
UW Weather Station Coordinator

Details of the arrangements can be found here:
https://erbgood.com/tribute/details/14063/Dr-Eric-Ric-Soulis-P-Eng/obituary.html#tribute-start


Sunday, June 3, 2018

May 2018 Summary


The hottest May on record with average precipitation 

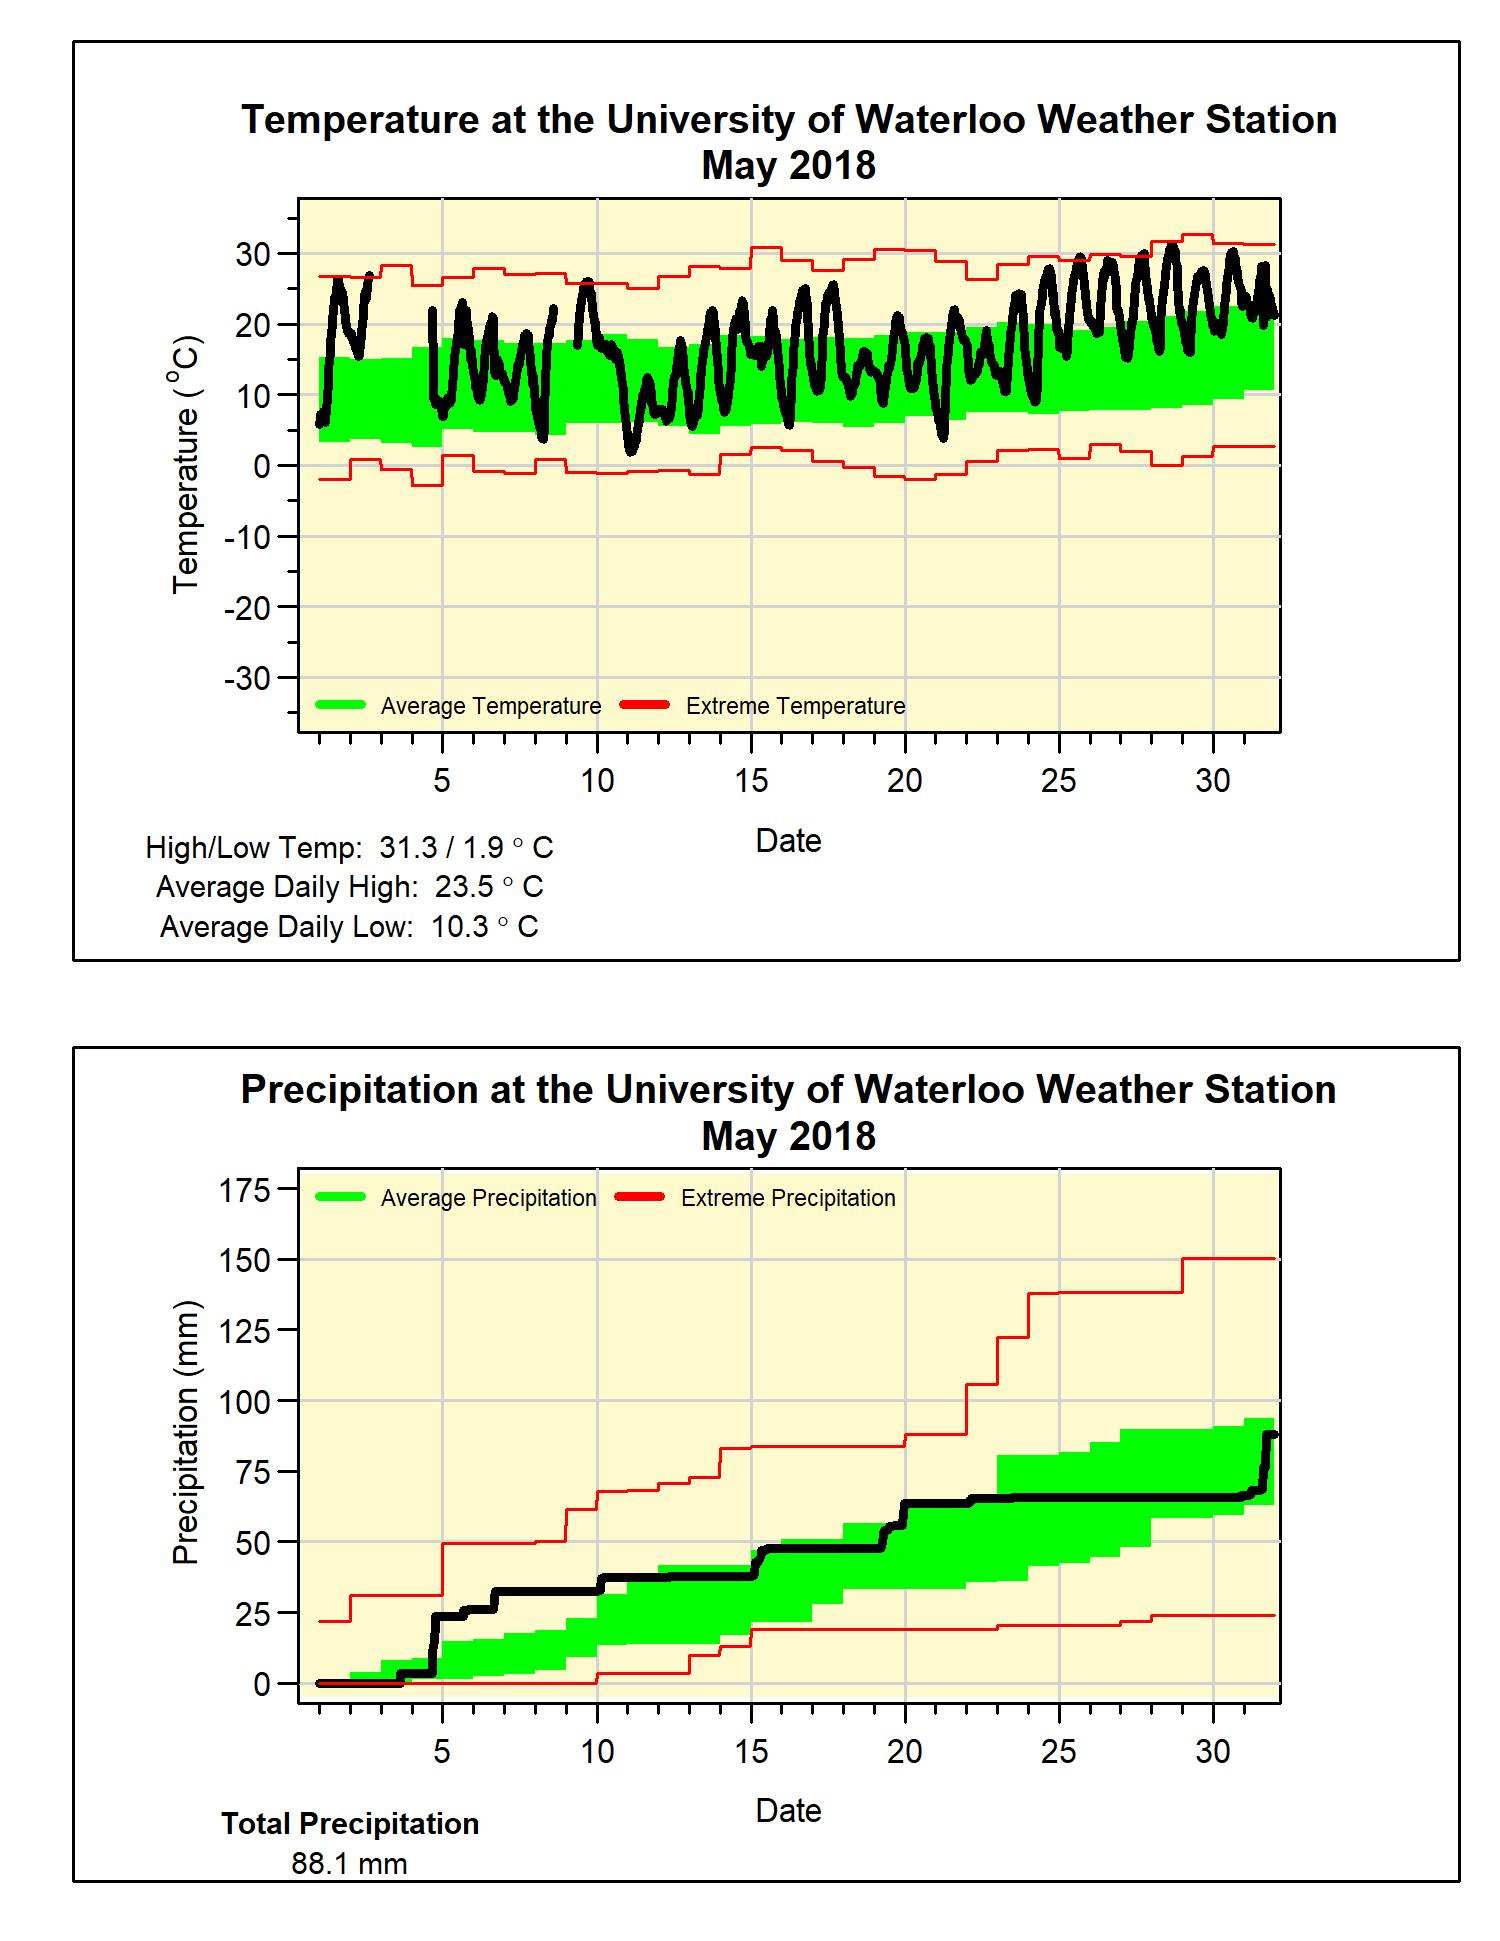
Well that was some weather whiplash!  After April which was 4 degrees below average (the coldest in the history of the region) we just experienced a May that was almost 4.5 degrees above average.  This was now the hottest May that we have seen in the local records which go back to 1915, beating 1991 by almost a full degree.

There were only 4 colder than average days during the month and it ended with a streak of 8 days above 25°C, something that has only happened one other time during May back in 1975.  There were also 3 of those days above 30°C which has only happened about 5 times in our region (but how about 1962 when there were 5 days above 30°C in a row).

There were 2 really wet days with precipitation over 20 mm (the 4th and 31st) leading to a total for the month of 88.1 mm, a little over the average of 82.3 mm, but still within the average range.  We have now had 409.6 mm of precipitation this year, a pretty good bit above the average of 340.2 mm for this time of the year.

Also, we didn’t have a temperature below zero during May, so that means the last one occurred on April 30.  This is on the early end of the range of Apr 26 to May 23 we have seen in 20+ years of data at the UW Weather Station.

Summary for May 2018:
Maximum Temperature 31.3°C
Minimum Temperature 1.9°C
Average Daily High Temperature 23.5°C (Long term average 18.5°C)
Average Daily Low Temperature 10.3°C (Long term average 6.4°C)
Total Precipitation 88.1 mm (Long term average 82.3 mm)

(Long term averages based on 1981-2010 data for the Waterloo-Wellington Airport)


Sunday, May 6, 2018

Winner for 2018 UW Weather Station Contest


It took a while, but finally on May 1st at 10:00 am the temperature went over 20°C for the first time this year when we saw a reading of 20.1°C.  This was much later than the previous latest date for the 20 years we have been running the contest, which was April 19th (in 2006).  Of course if we look back in the history of records in the region if there had been a weather station contest in 1919 the winner would only have been crowned on May 13th.

So congratulations to Will Gilbert who guessed a date that was almost 2 weeks later than the previous latest date in the contest, I highly respect that he was not afraid to choose a date outside of the recent historical pattern.

Here is his explanation of why he chose that date:

I figured that this year the weather was different from the past.
December was very cold, but the second half of February was very warm;
in fact, it was 16°C a few days before I voted. However that was about 6°C higher that it had ever been previously on that date, and it did not look as if that warm trend would go into March.

In second place was Greg Friday who also chose May 1st, but just a later time.

Both the winners will be receiving prizes graciously supplied by the UW Shop.

Thanks to everyone who entered and as always enjoy the weather.

Tuesday, May 1, 2018

April 2018 Summary


A wet April that was the coldest on record

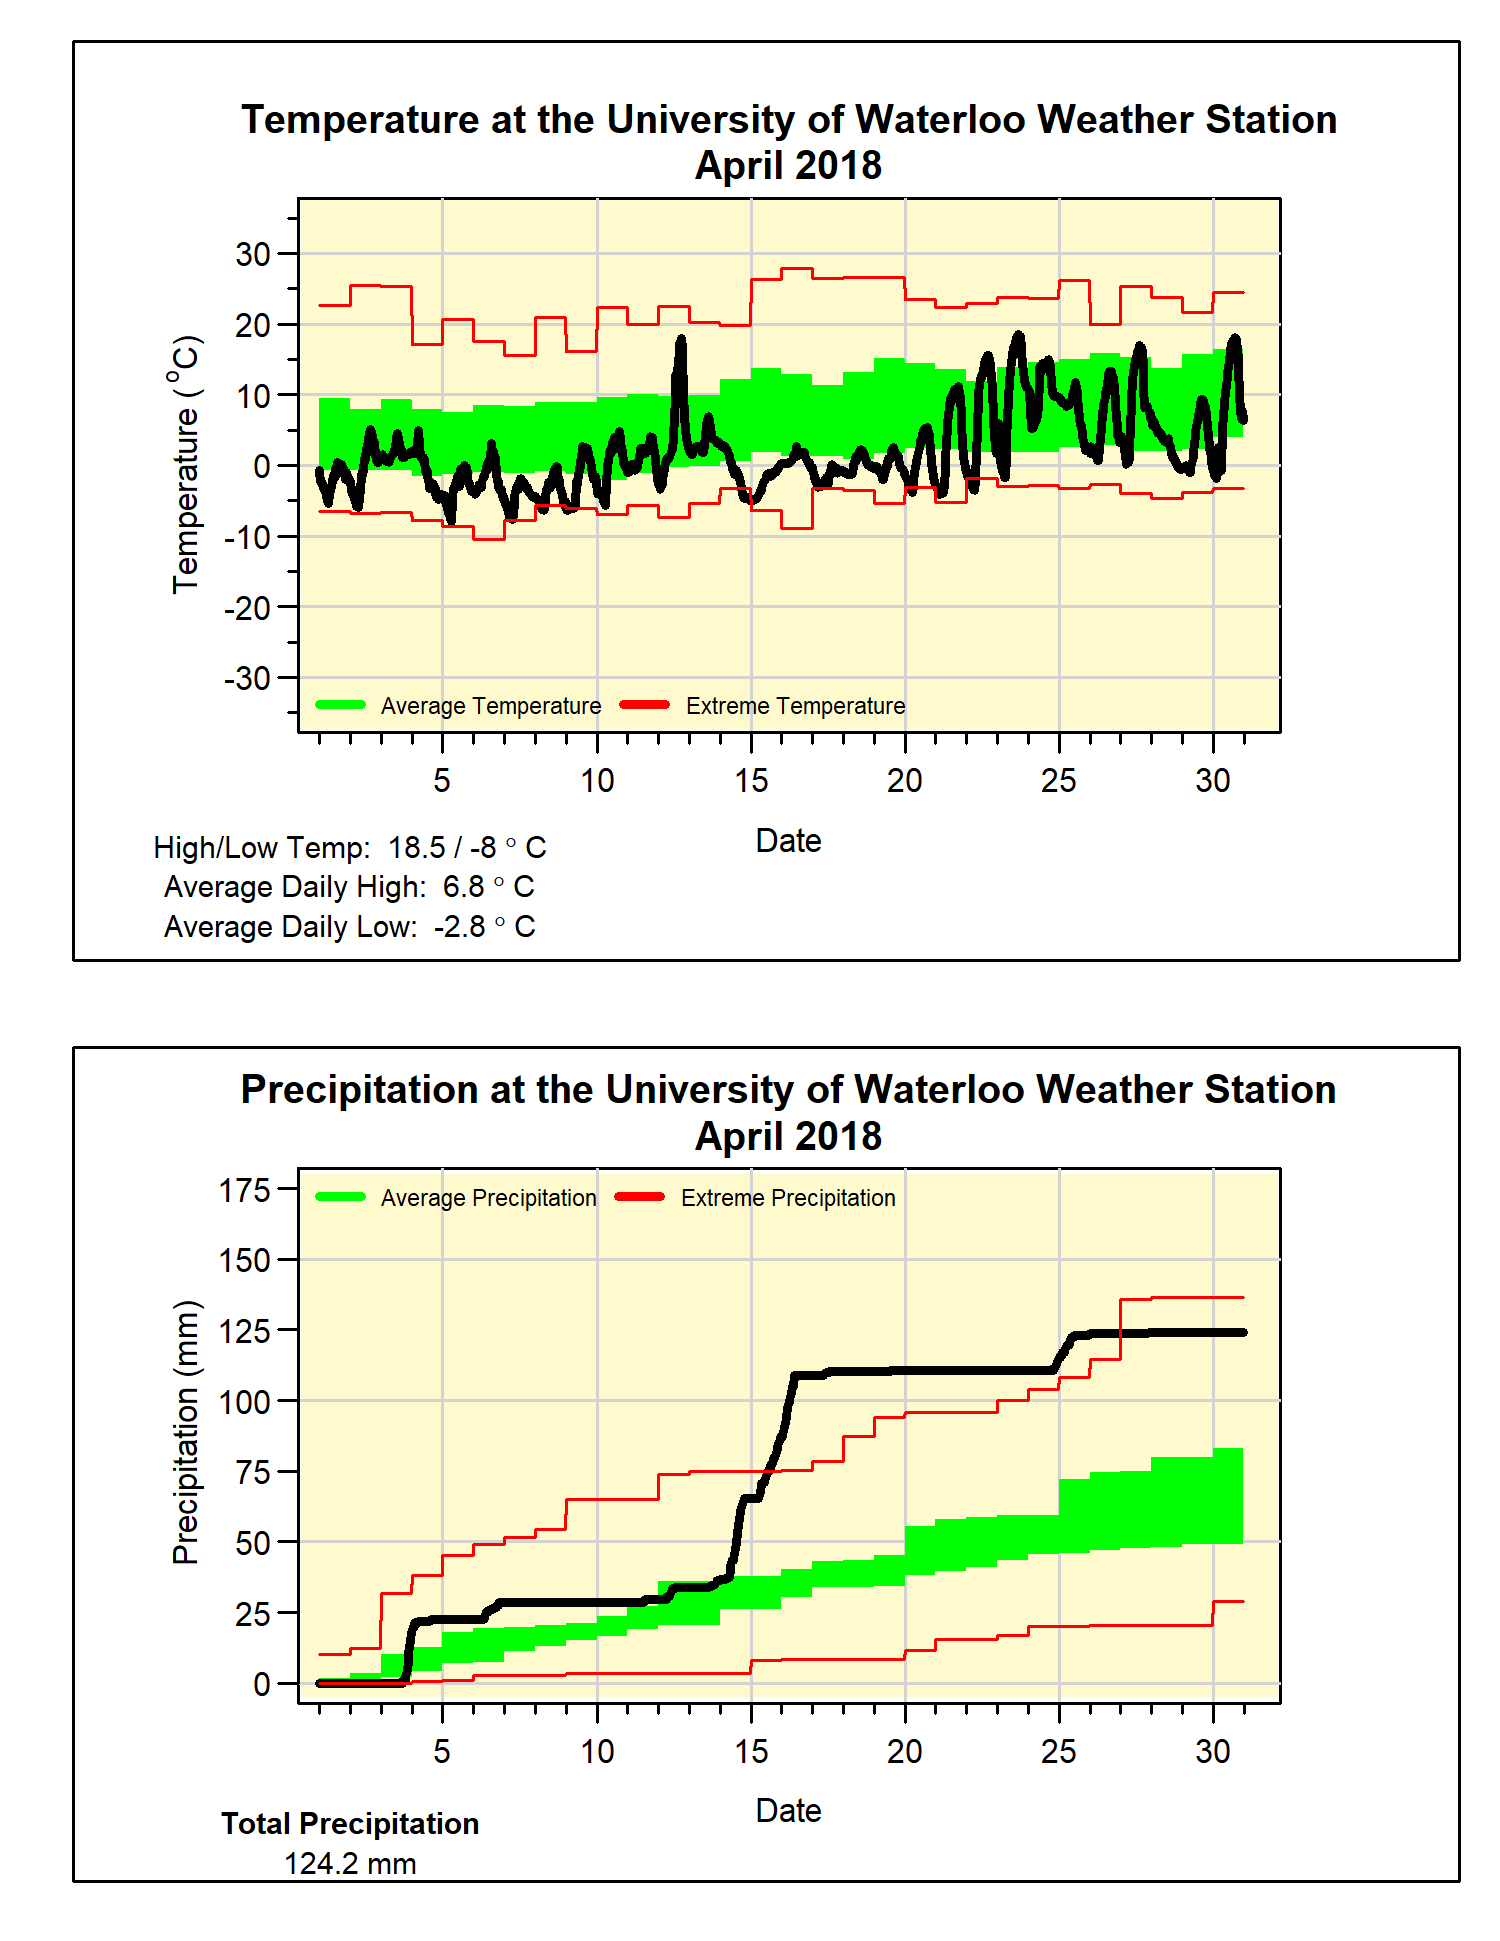
Yes it was cold in April, but not just kind of cold, record breaking cold!  At 4 degrees below average, it was the coldest April we have seen in the region since records began back in 1915 beating the previous record set back in 1975.  It was also the most below average month since February of 2015.

It was cold right out of the gate as 20 of the first 21 days of the month were less than average and there were only a total of 6 days overall that were warmer than average.

During 3 really wet days between the 14th and the 16th there was a total of 72.6 mm of precipitation, this was almost more than monthly average total of 74.5 mm.  Not surprising the final total of 124.2 mm was well above average.

Let’s call an end to the snow season (I know famous last words), so the 10 cm we had in April puts the total for the snowfall season of 110.5 cm which is only about two thirds of the average of 159.7 cm.


Summary for April 2018:
Maximum Temperature 18.5°C
Minimum Temperature -8.0°C
Average Daily High Temperature 6.8°C (Long term average 11.5°C)
Average Daily Low Temperature -2.8°C (Long term average 0.8°C)
Total Precipitation 124.2 mm (Long term average 74.5 mm)


(Long term averages based on 1981-2010 data for the Waterloo-Wellington Airport)


Saturday, April 7, 2018

March 2018 Summary


A cool and dry March

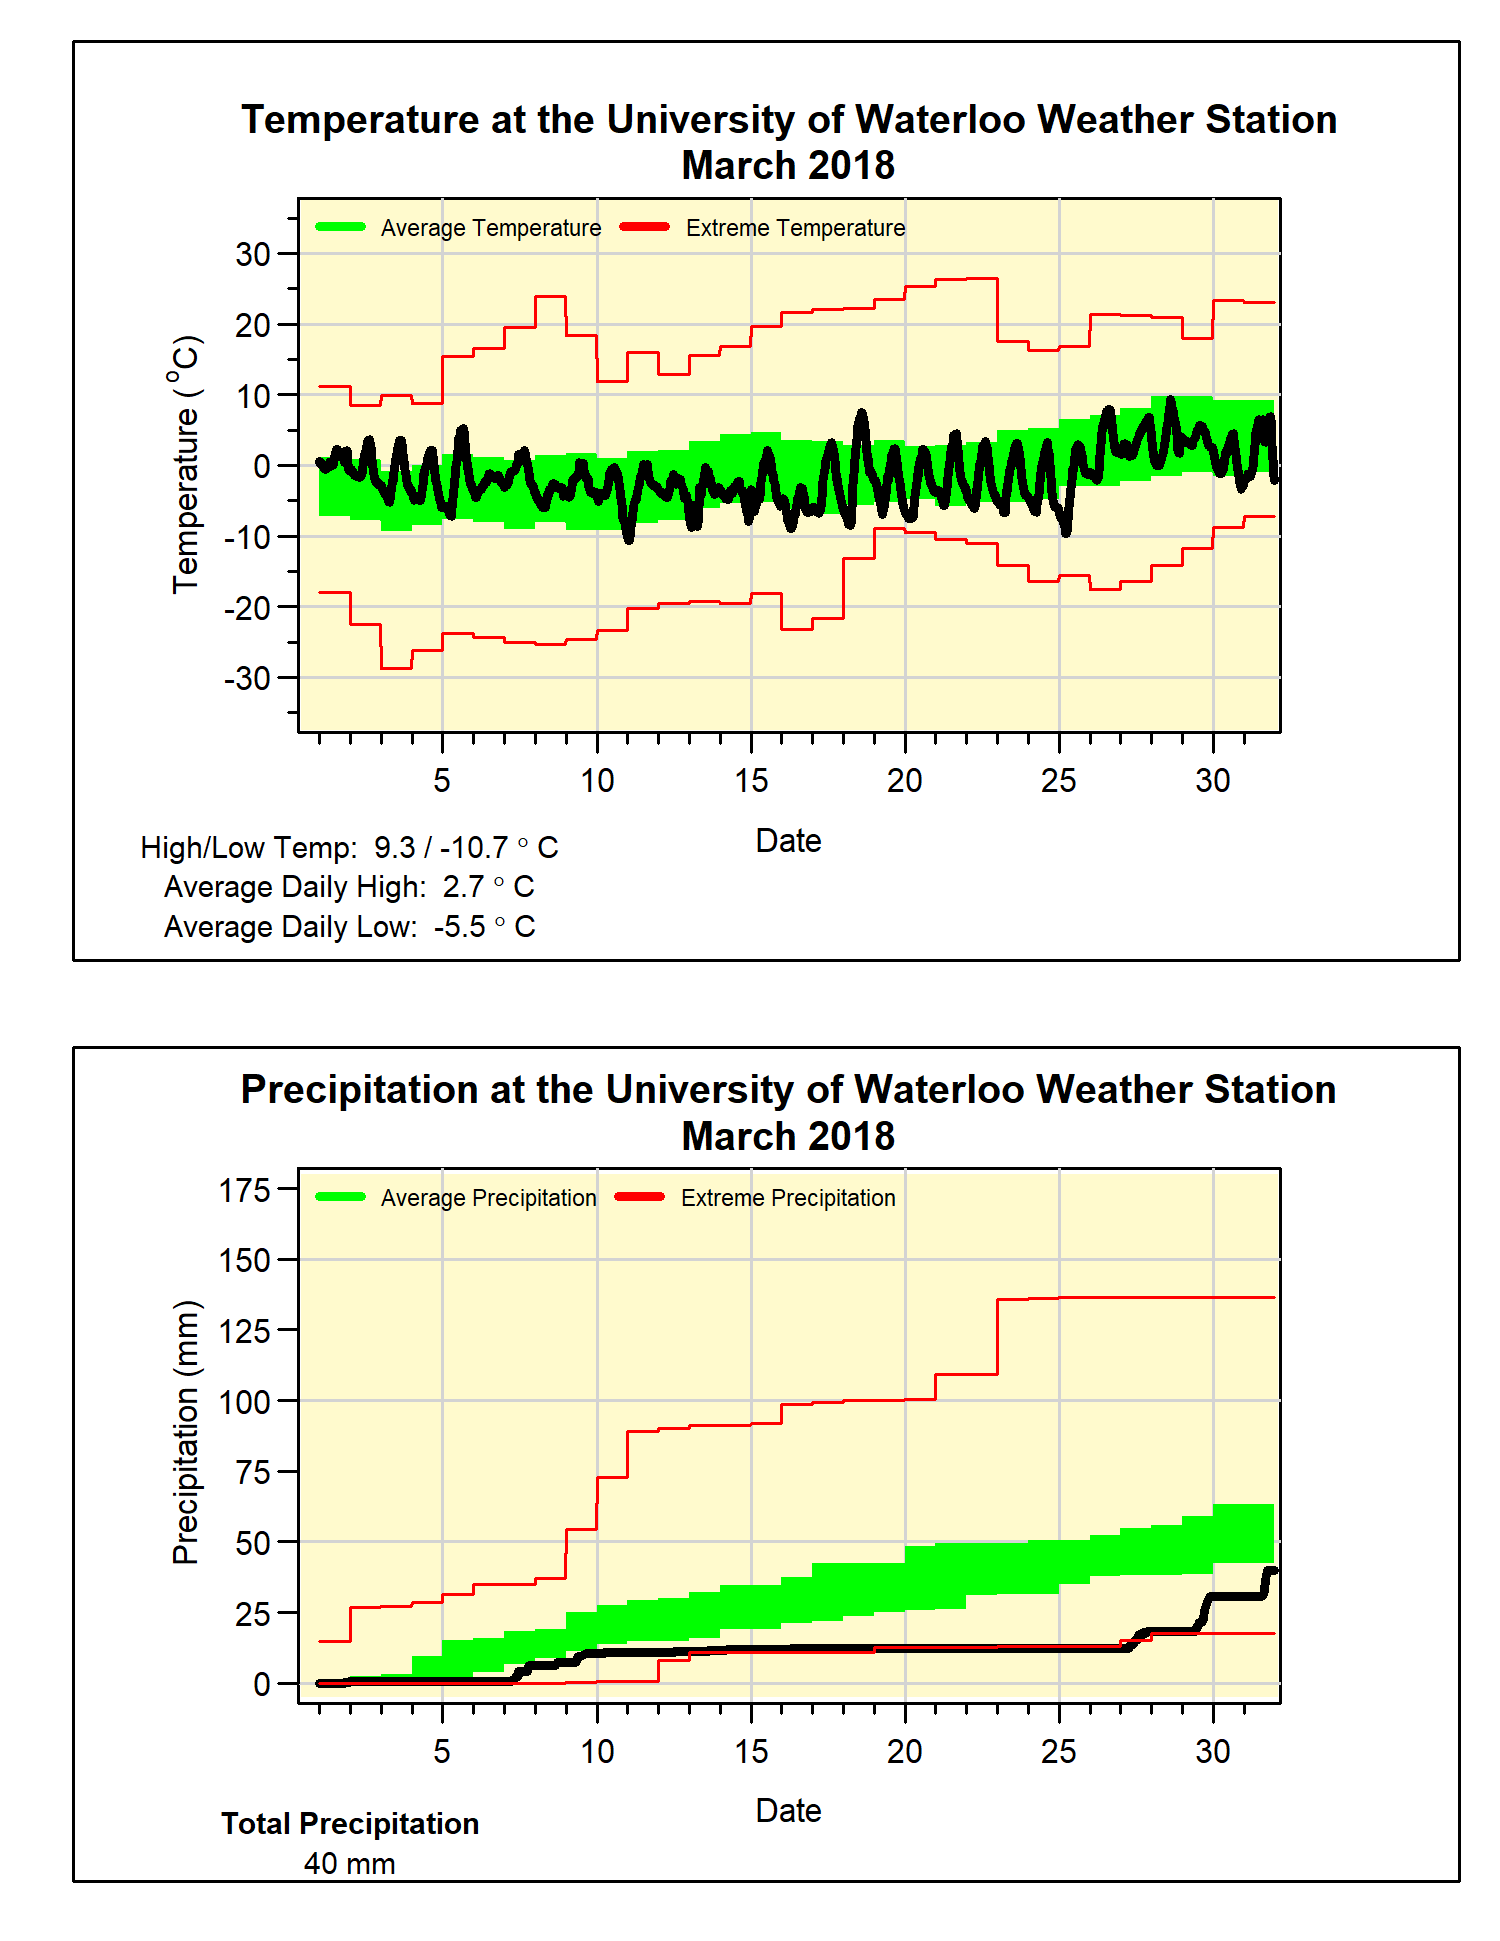
The temperature during March was pretty steady throughout the month, however as the temperature typically goes up by about 6 degrees from the beginning to the end, that means the overall temperature ended up about 0.4 degrees below average.  Although it is less than average it is still within the average range.

One interesting thing was we didn’t see any extreme temperatures, the highest temperature of 9.3°C was the lowest since 2001 and the lowest temperature of -10.7°C was the highest since 2000.  This 20 degree range compares to an average range of 35.8 degrees and is the 4th lowest range in the 100+ years of weather data in the region.

With a streak of 10 days with no precipitation (and a week before that with very little) it isn’t surprising that it was a below average month for precipitation with only 40.0 mm compared to the average of 61.0 mm.

There was only 9.5 cm of snow which is only about a third of the average for March of 26.5 cm.  That brings the total snowfall to 100.5 cm, much less than the average of around 150 cm for the end of this month.


Summary for March 2018:
Maximum Temperature 9.3°C
Minimum Temperature -10.7°C
Average Daily High Temperature 2.7°C (Long term average 3.6°C)
Average Daily Low Temperature -5.5°C (Long term average -5.6°C)
Total Precipitation 40.0 mm (Long term average 61.0 mm)

(Long term averages based on 1981-2010 data for the Waterloo-Wellington Airport)


Thursday, March 1, 2018

February 2018 Summary


A warm and wet February

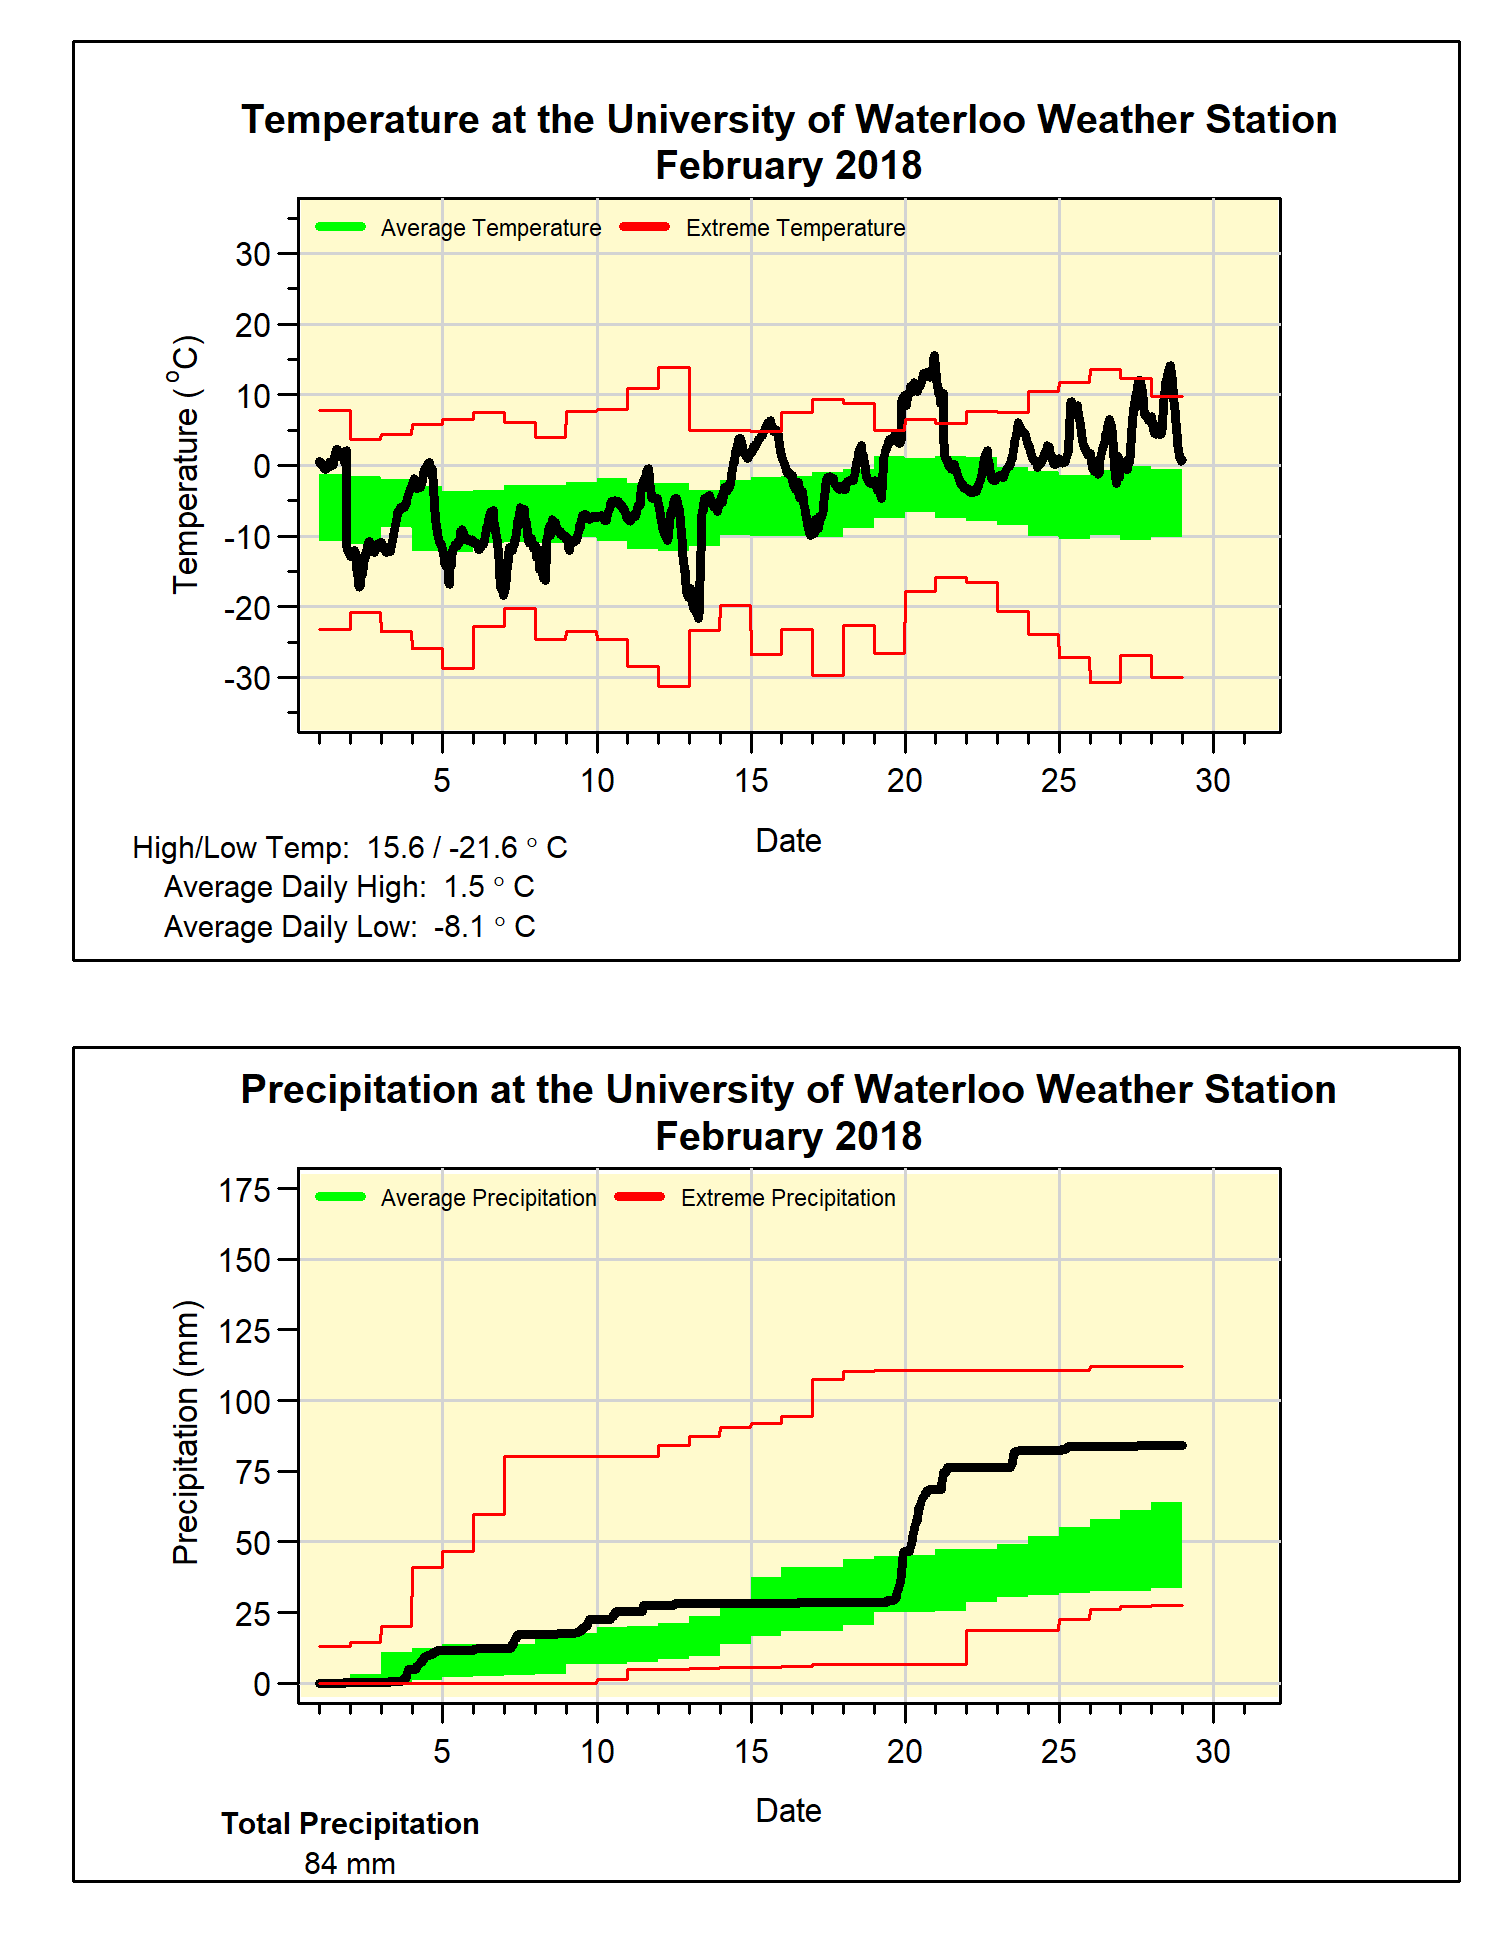
The first half of the month was a bit colder than average, however the heat really kicked into gear in the second half resulting in an overall temperature that was a little over 2 degrees higher than average.

Within that second half was the high of 15.6°C on the 20th that was the highest February temperature we have seen in the over 100 years of weather data in the region.  Of course that might sound familiar as the previous highest February temperature was just last year when it got up to 15.1°C.

It was the wettest February in the last 5 years with 84.0 mm compared to the average of 54.9 mm.  About half of the monthly total came during 2 really wet days (19th and 20th) when a total of 38.8 mm of rain combined with warm temperatures to melt almost all of the snow that was on the ground.

Before that rain, we saw 25 cm of snow during the first half of the month which is close the average for February of 30.3 cm.  That brings the total snowfall to 91 cm, which is now getting farther behind the average of 125.6 cm for this time of year.


Summary for February 2018:
Maximum Temperature 15.6°C
Minimum Temperature -21.6°C
Average Daily High Temperature 1.5°C (Long term average -1.2°C)
Average Daily Low Temperature -8.1°C (Long term average -9.7°C)
Total Precipitation 84.0 mm (Long term average 54.9 mm)

(Long term averages based on 1981-2010 data for the Waterloo-Wellington Airport)


Monday, February 26, 2018

Happy 20th Birthday to us!

Happy 20th Birthday to us!

We officially launched the University of Waterloo weather station on Feb 27, 1998. If you want to see what the webpage looked like in the early years you can see it here.

Thanks to everyone who has helped make the station possible for all these years and of course thanks to everyone who uses and enjoys the station.

Be sure to join us for the 20th anniversary talk on Monday (see the details here).

Thursday, February 22, 2018

20th Anniversary of the UW Weather Station Lecture


It is hard to believe, but the University of Waterloo Weather Station has been giving the public up to date weather conditions for 20 years! (Not to mention an archive of every reading ever taken as well as the popular contest to guess when the temperature first goes over 20 C). 

To mark this milestone, join UW Weather Station Coordinator Frank Seglenieks as he gives a presentation recalling how it all got started, the hurdles we have had to overcome, what trends we have seen in the data, and what we have learned along the way. There will also be a chance to ask questions about everything you have ever wanted to know about the station.

Tickets are free, but please register here so we can get an idea of how many people we can expect.  


2018 UW Weather Station contest has started


The entry period for the 2018 UW Weather Station contest has started, you can put in your guess for the first day the temperature will go over 20C here:

http://weather.uwaterloo.ca/20th_contest/contest.html

You have to get your guess in by Wednesday, February 28th at 2 pm.

Sunday, February 4, 2018

January 2017 Summary


A cold and wet January

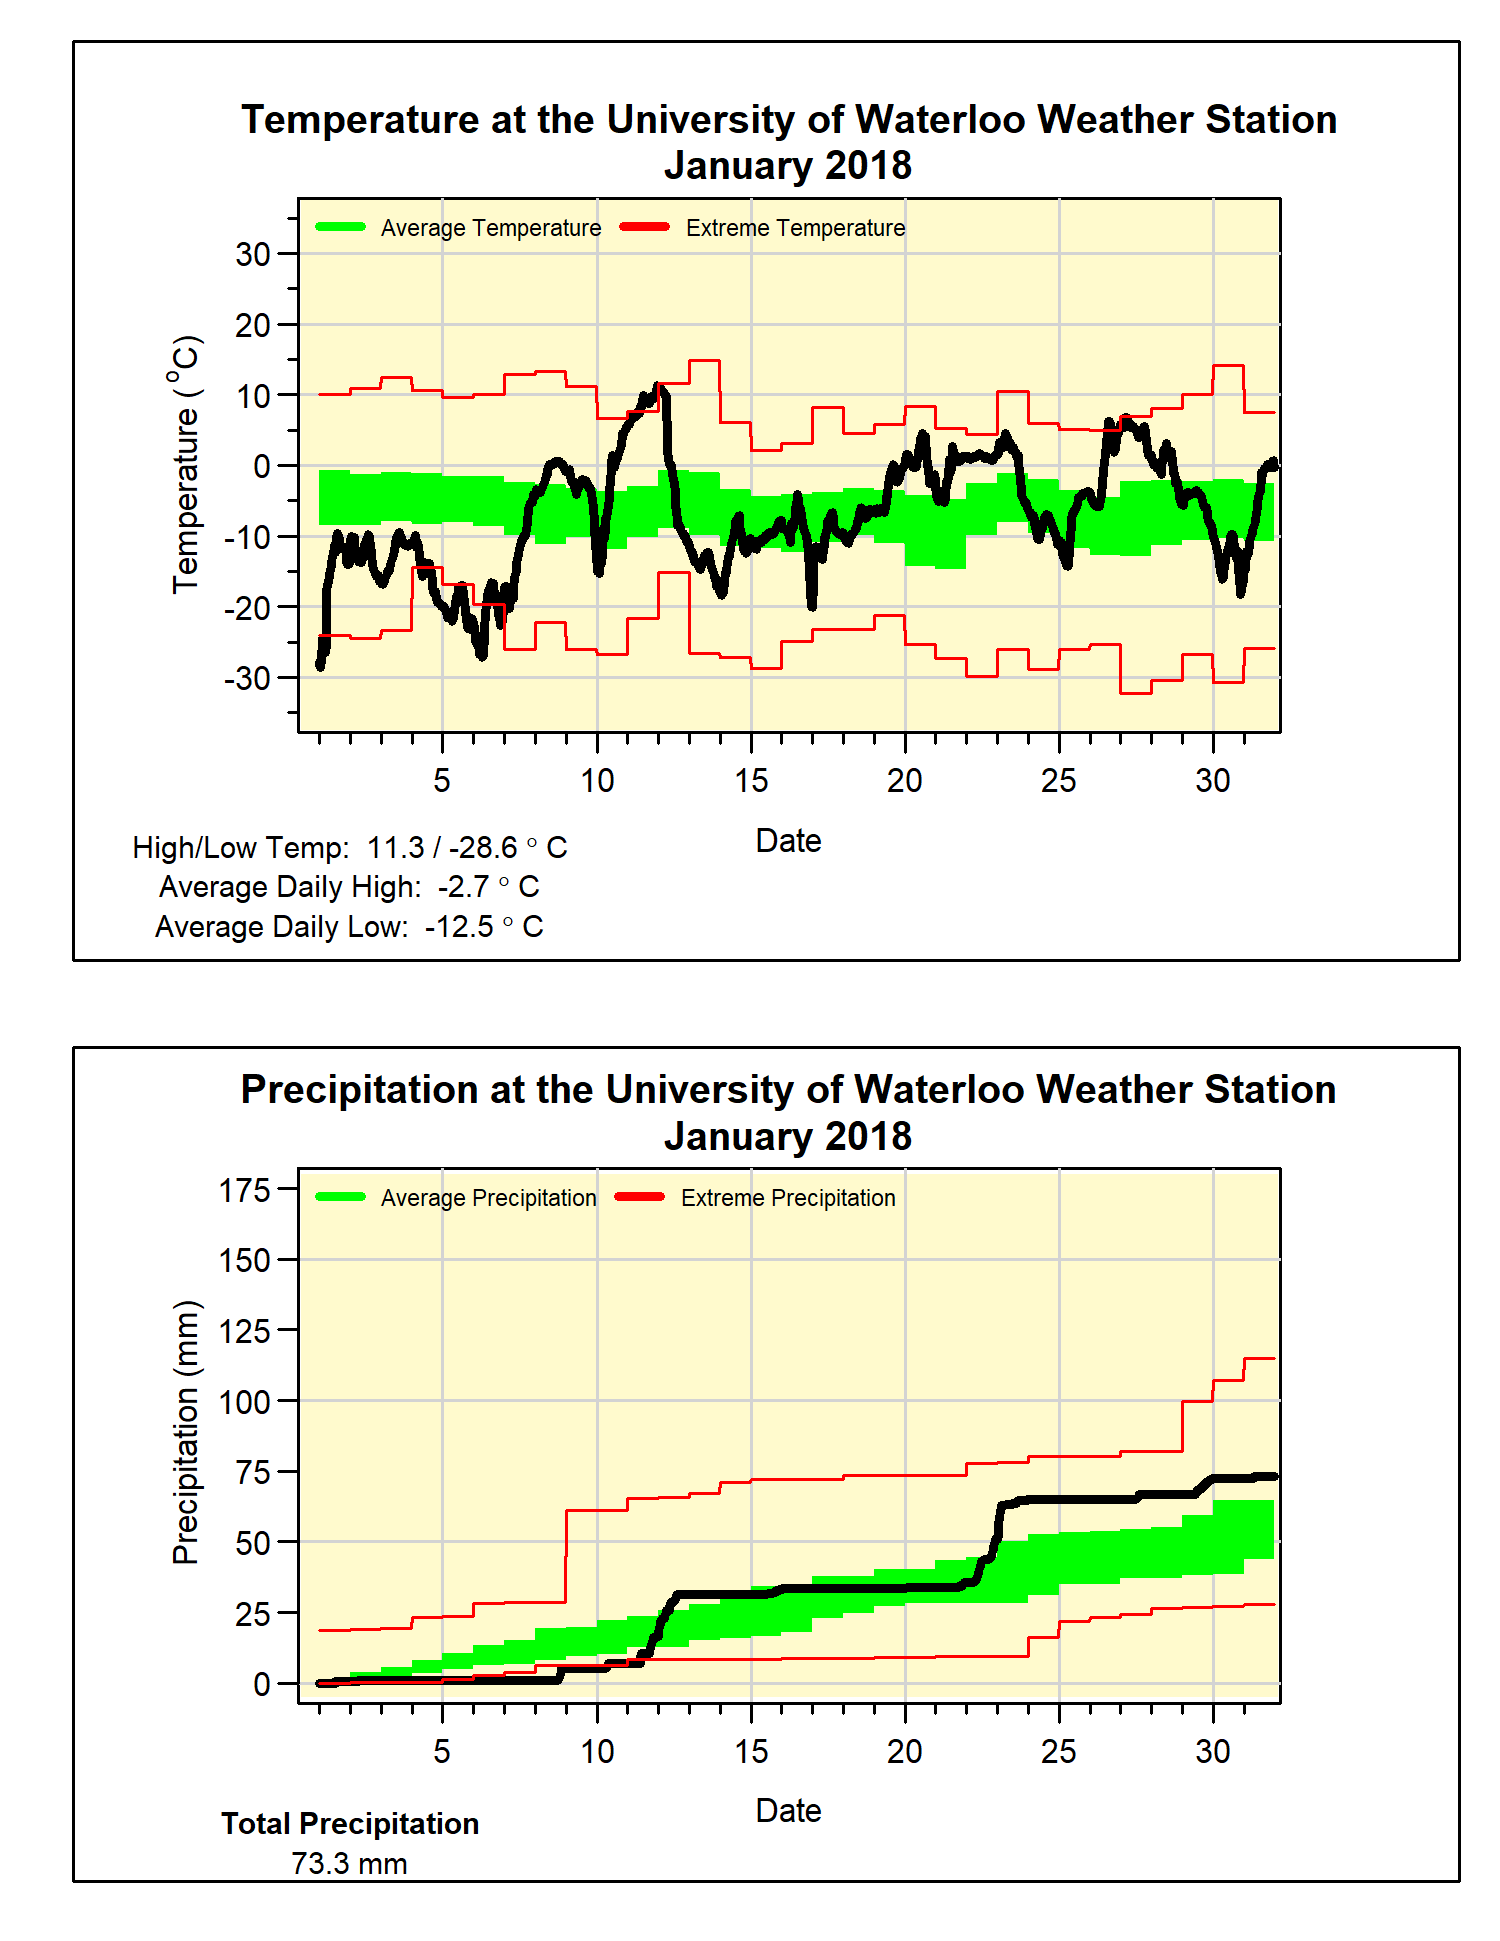
The start of the month was very cold, as well as some days in the low minus 20s, we had a streak of 12 days (going back into 2017) where the temperature never went above -8°C.  This is the second longest streak like this, only surpassed by 1961 when there were 15 and just a little longer than in 1979 when we had 11.

We then experienced many temperature oscillations with a few days above zero, followed by a few below, and so on.  In fact the temperature passed through zero a total of 6 times leading to some mixed precipitation making for some difficult driving and walking conditions.

However, the warmer temperatures couldn’t make up for those really cold temperatures at the beginning of the month leading to an overall temperature that was a little more than a degree below average.

The total precipitation that fell was 73.3 mm, enough above the average of the 65.2 mm to put it into the above average range.  As far as snowfall, we had 28 cm less than the average of 43.7 cm for the month, while the total so far this season is 66 cm compared to the average of 95.3 cm for this point in the snowfall season.


Summary for January 2018:
Maximum Temperature 11.3°C
Minimum Temperature -28.6°C
Average Daily High Temperature -2.7°C (Long term average -2.6°C)
Average Daily Low Temperature -12.5°C (Long term average -10.3°C)
Total Precipitation 73.3 mm (Long term average 65.2 mm)

(Long term averages based on 1981-2010 data for the Waterloo-Wellington Airport)


Wednesday, January 10, 2018

2017 Summary

University of Waterloo Weather Station Annual Summary - 2017

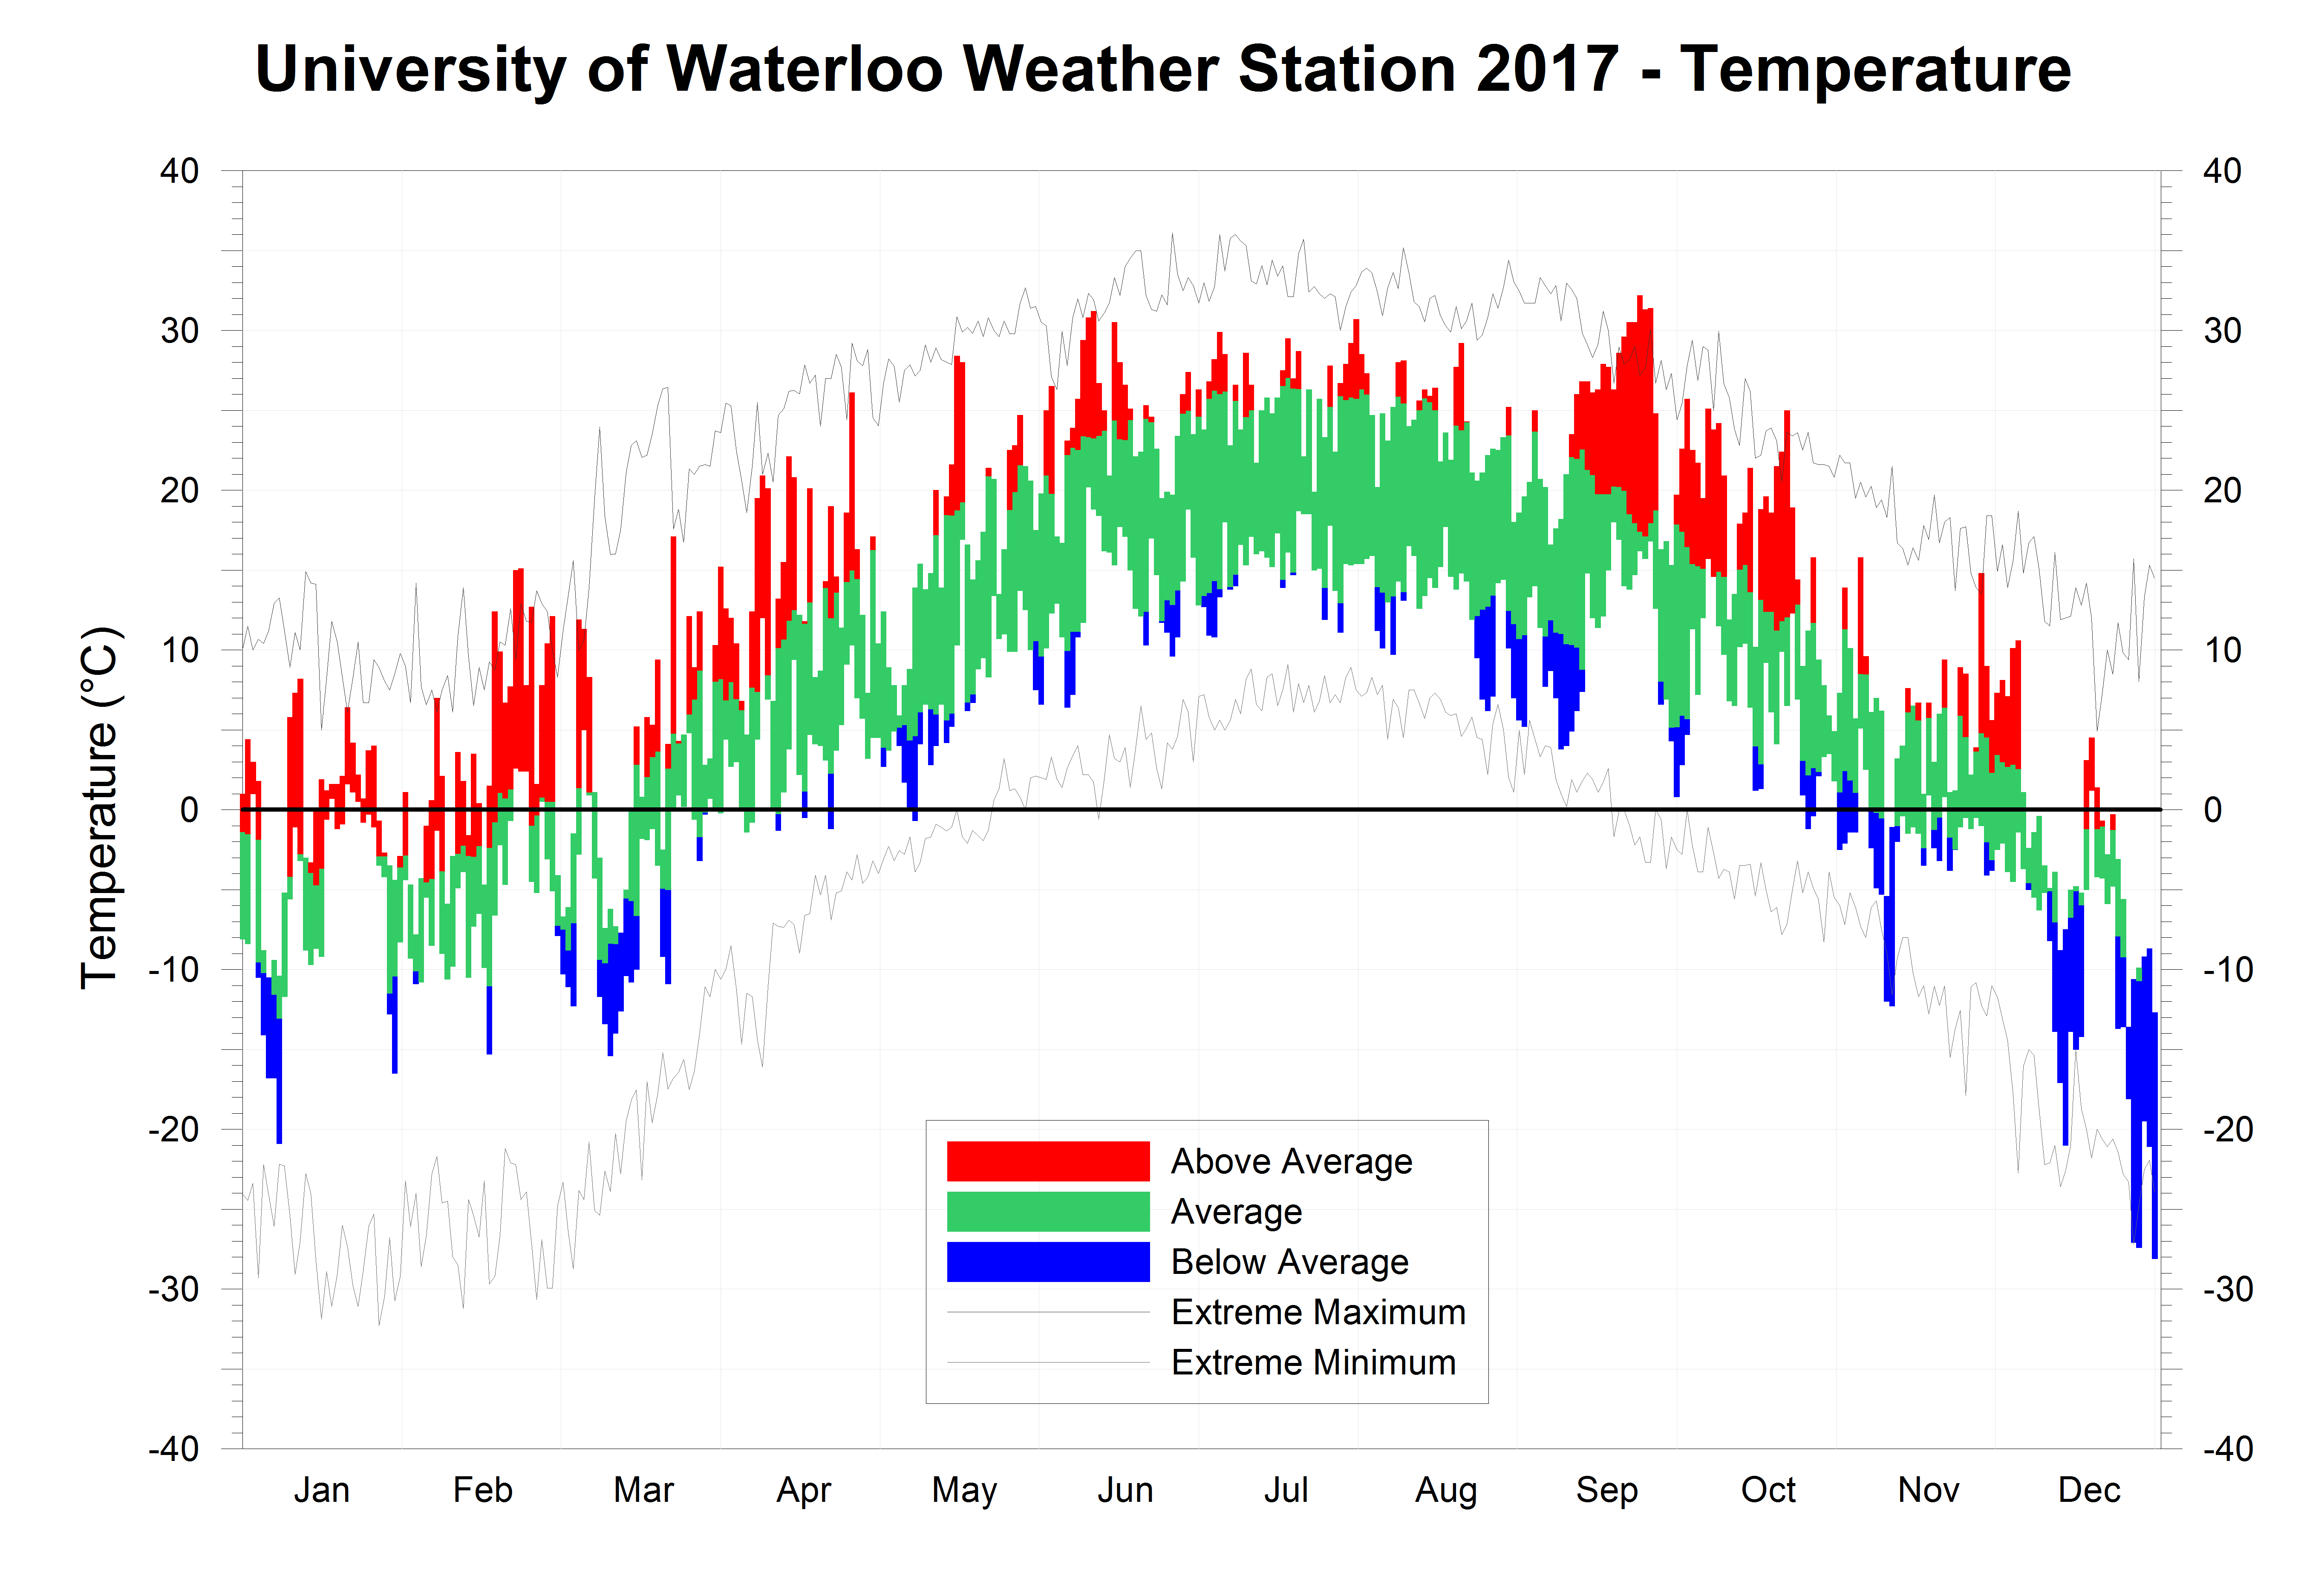
There weren’t that many individual notable moments during 2017, but what was notable was how many times there were consecutive days of interesting weather leading me to call this the “year of streaks”.  There is no official measure of streaks so it can’t be said definitively that it was the most ever, but it seemed like there were lots of them.

It started in January when we saw 12 days in a row that went over 0 degrees, this is something that we had not seen since 1944.  There were also a lot of days were the sun did not make an appearance, leading me to invent something called “dreary” days and there were more of these in January then in any other January in the history of the UW Weather Station.

The next streak came in February with another 12 days in a row above 0, something that hasn’t happened in the over 100 years of weather data in the region and leading to it being the warmest February we have seen.  Also notable was the high of 15.1°C on the 23rd which was the highest February temperature we have ever seen in the region, while in second place was the 15.0°C which happened the day before.

Then for only the 5th time in 100 years March was colder then February followed by a warm April and the see saw continued with a cold May.  The summer was generally very close to average with not a lot of really hot or cold days.

It wasn’t till the end of September that we saw the longest heat wave of the “summer”.  The most significant streak was the 15 days above 25°C between the 12th and the 26th, which is something we have never seen before in September. 

In October there were 12 days where the temperature was over 20°C, we haven’t seen that many since October 1971.  But the most significant day was the 22nd when the temperature topped out at 25°C, this was tied with 1947 as the latest day of the year with a temperature above 25°C.

However, the cold temperatures came back with a vengeance in December, the coldest one since 2000, that featured a streak of very cold days at the end that went into the next year.  It was so cold that during the last 6 days of the month, the daily high temperatures didn’t even get above the average daily low temperatures for those days.

Overall the year was 1.1 degrees above average, making it the tenth warmest we have seen in the region.

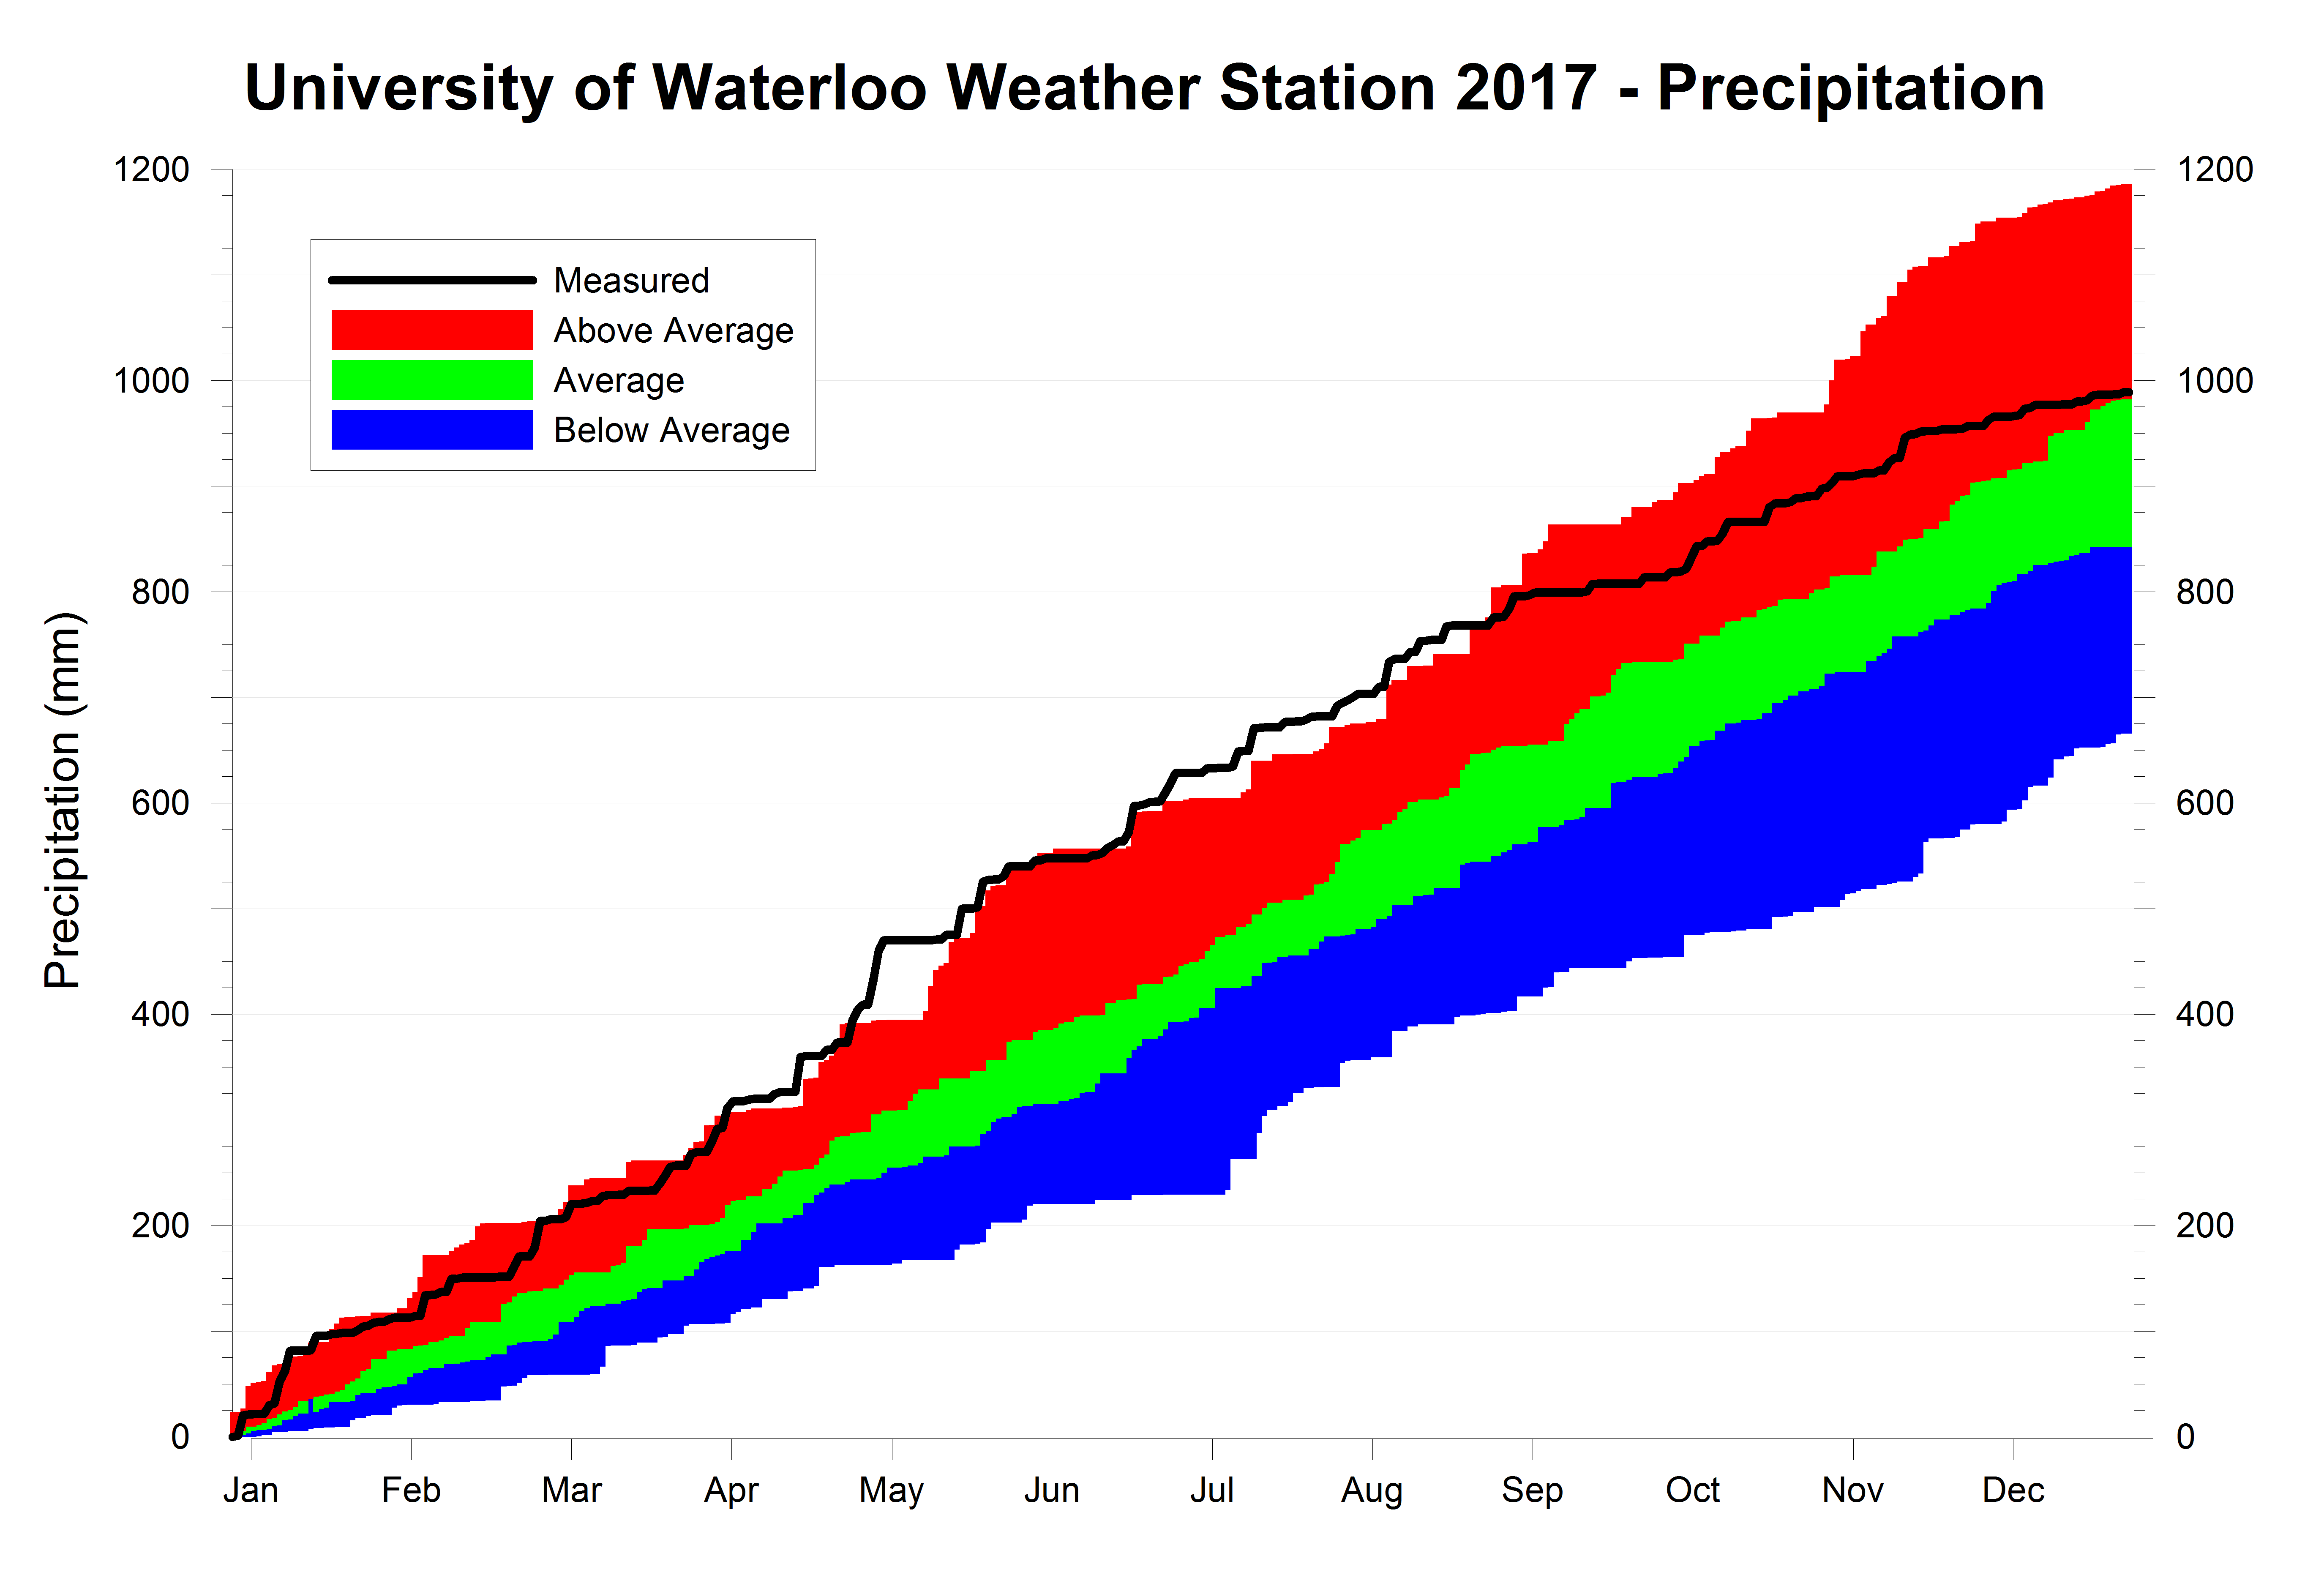
The first half of the year was the second wettest on record, fueled by a very wet April followed by an even wetter May.  The rest of the year was more or less average with the final total of 988.6 mm coming in just within the above average range.


Summary for 2017:
Average Daily High Temperature: 13.09°C (average 12.05ºC)
Average Daily Low Temperature: 3.20°C  (average 1.94ºC)
Total Precipitation: 988.6 mm (average 916.3 mm)


(averages are calculated from 1981-2010 data for the Waterloo-Wellington Airport)

Click on the image below to see the temperature chart:

Click on the image below to see the precipitation chart:

Tuesday, January 2, 2018

December 2017 Summary


A cold and dry December

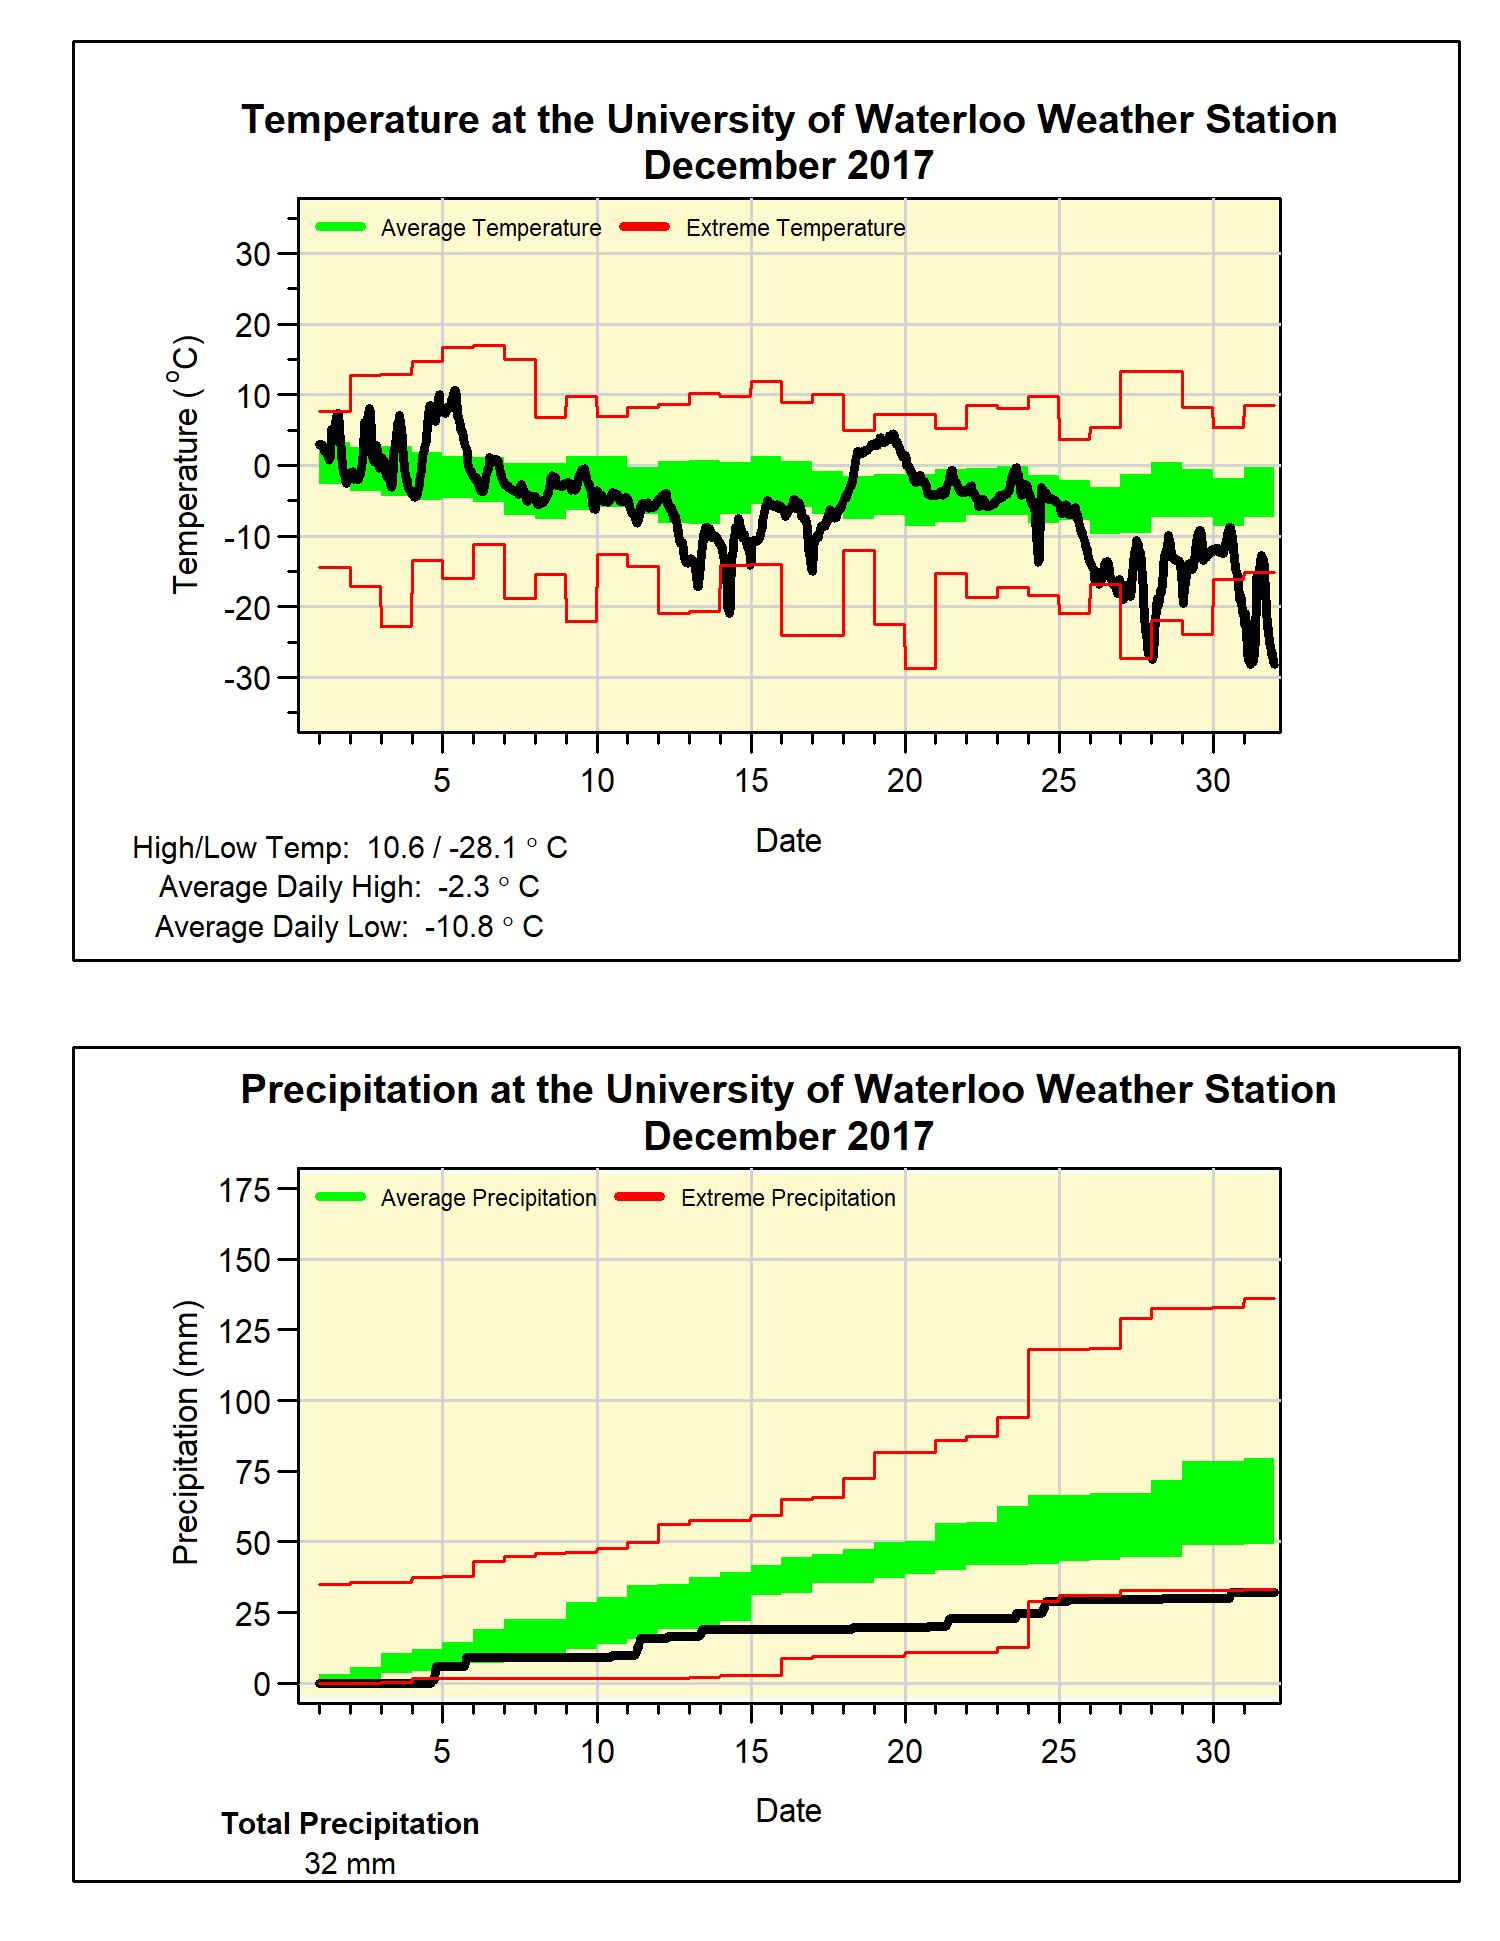
For almost the entire first week, December was pretty warm with some double digit temperatures, however things then got somewhat colder before getting really cold.  So cold that during the last 6 days of the month, the daily high temperatures didn’t even get above the average daily low temperatures for those days.

Overall it was a bit more than 3 degrees below average making it the coldest December since 2000, while the cold streak at the end of the month might turn out to be one of the longest we have seen in the history of records in the region (but more on that next month).

The colder temperatures meant that most of the snow that fell remained on the ground at the end of the month.  However, this might have masked the fact that we didn’t get that much precipitation during December with only 32.0 mm compared to the average of 71.2 mm.

As far as snowfall, we had 31 cm which was just a little less than the average of 37.2 cm for the month.

Summary for December 2017:
Maximum Temperature 10.6°C
Minimum Temperature -28.1°C
Average Daily High Temperature -2.3°C (Long term average 0.2°C)
Average Daily Low Temperature -10.8°C (Long term average -6.8°C)
Total Precipitation 32.0 mm (Long term average 71.2 mm)


(Long term averages based on 1981-2010 data for the Waterloo-Wellington Airport)