Friday, November 11, 2016
UW Weather Station Archive Update
Ever since we switched the equipment at the UW Weather Station back in 2015 we haven't had been able to put up an archive of historical data.
As we have always prided ourselves in the fact that every reading we have ever taken is available to be downloaded, not being able to have a working archive was something that has frustrated me.
After 10 hours of coding today I finally have a system where the *.csv files on the Data Archives page will be updated every 15 minutes. Unfortunately it will be bit longer before there will be the same functionality as we had before with being able to get data for specific data ranges.
Access the csv archive here:
http://weather.uwaterloo.ca/data.html#archive
Please leave any feedback about the archive in the comments.

Saturday, November 5, 2016
October 2016 Summary
Second warmest October in 45 years with average precipitation
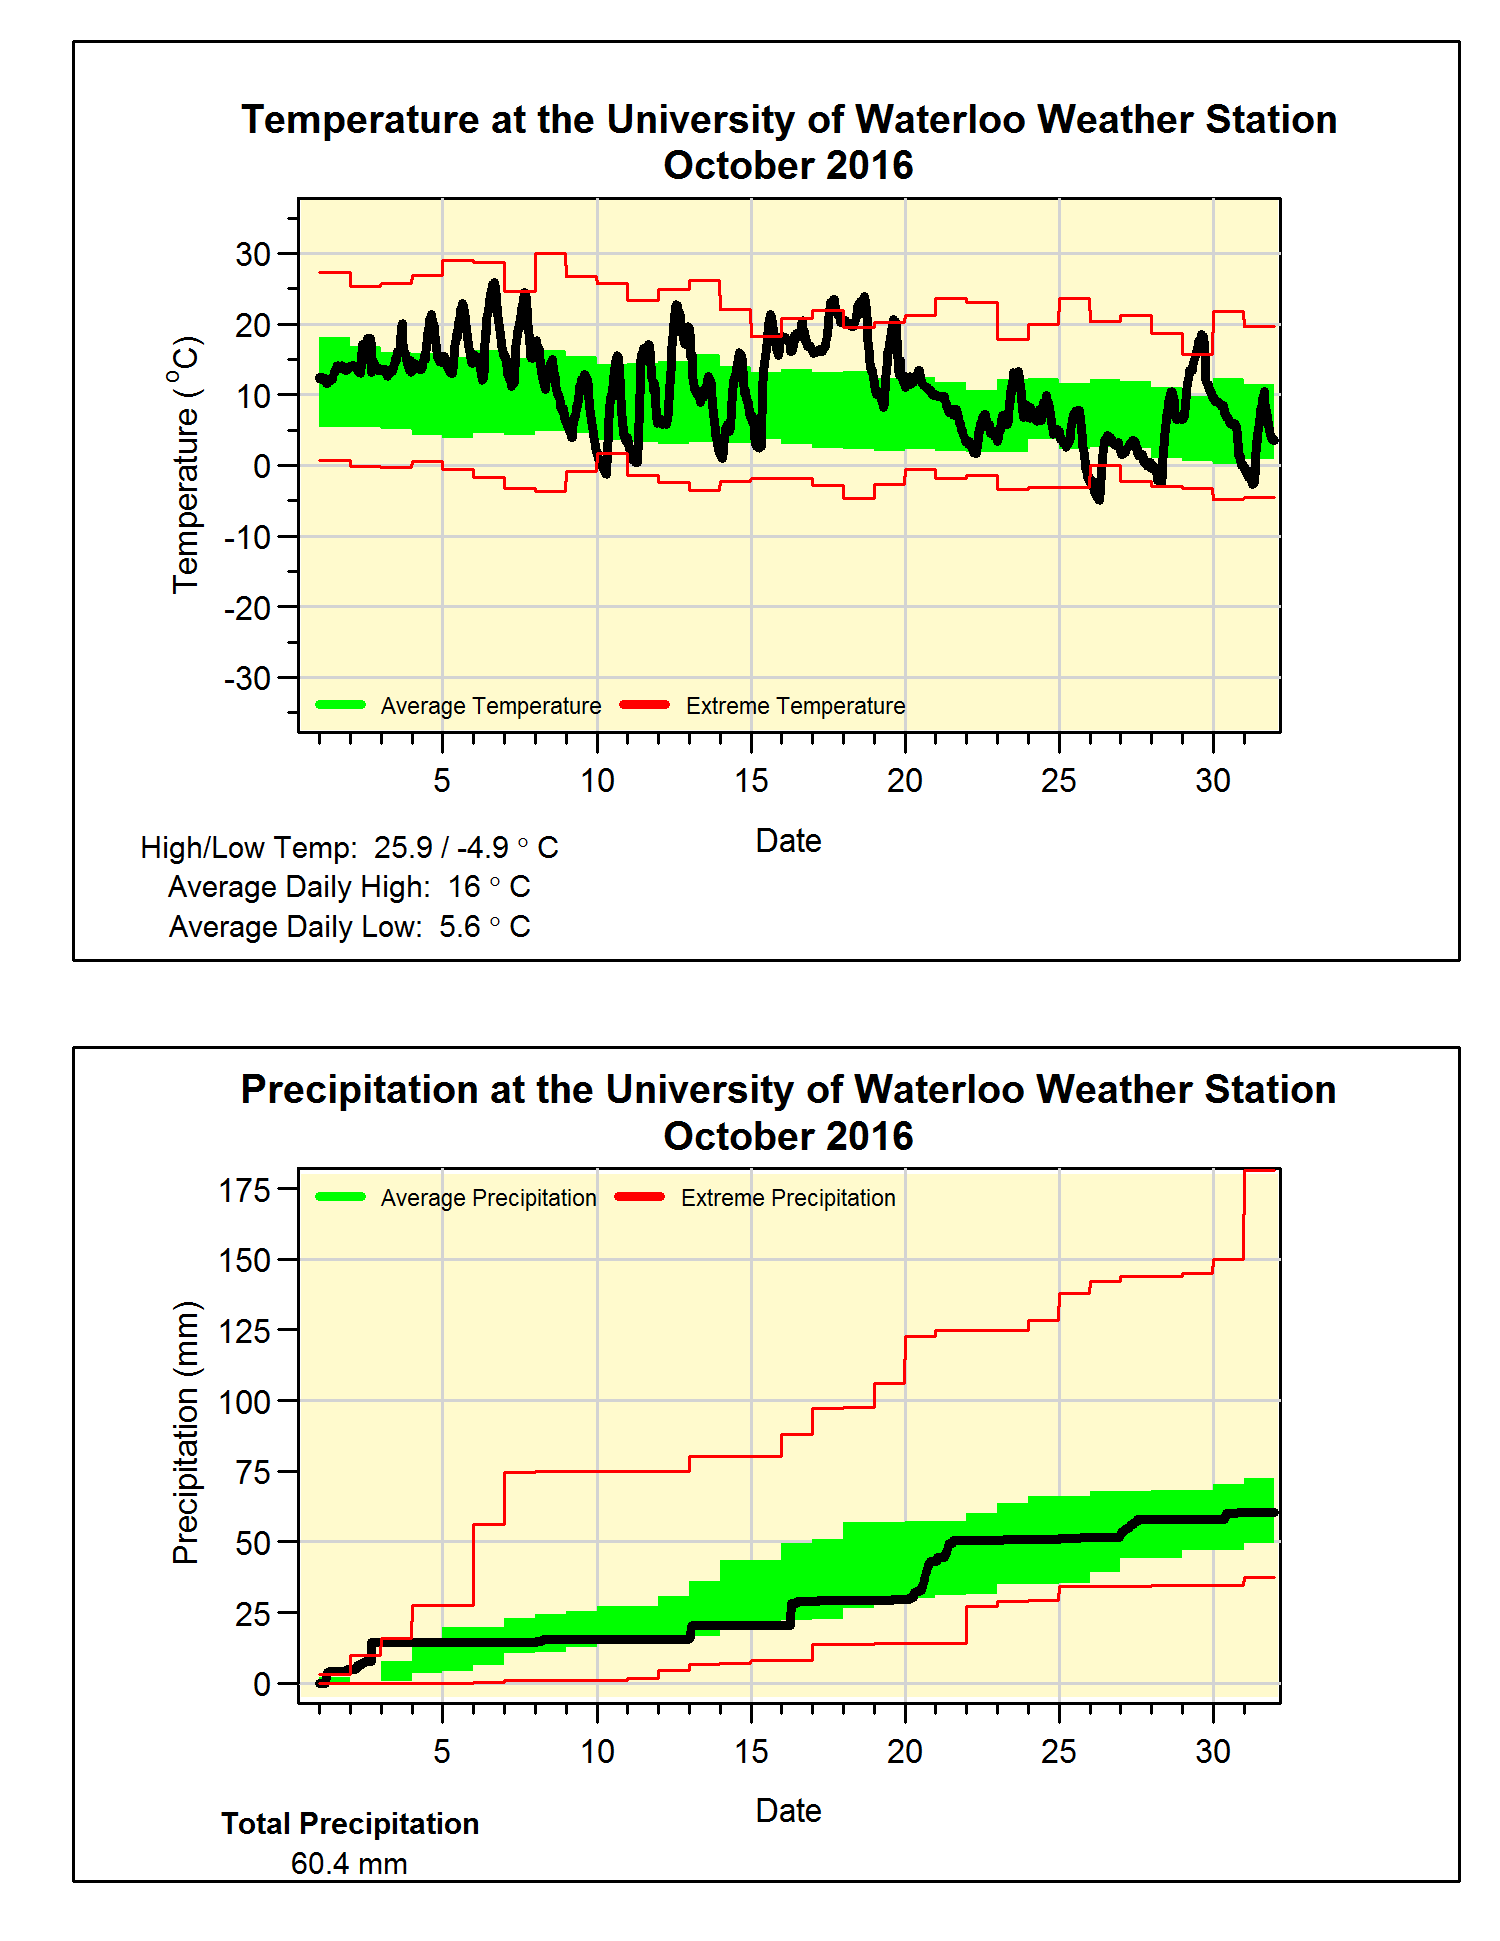
It was another hot month with the average October temperature coming in at 2.6 degrees above average, this made it the second warmest since 1971 (after 2007** See Note below). However, it is also interesting that the on the 26th the temperature got down to -4.9°C which was the coldest October temperature in the region since Oct 14, 1993.
The temperature went below zero on October 10th, this was the first time this had happened since April 30. That means we had 163 days of above zero temperatures, which is pretty much the average length we have seen in the past 15 years (by the way I’m trying to avoid calling it the growing season or frost-free days as those terms seem to cause a lot of confusion).
Although the total precipitation for the month of 60.4 mm was below the average of 67.4 mm, it was close enough to be within the average range. The total for the year so far of 729.4 mm is still a bit below the average for this time of year of 750.6 mm.
Summary for October 2016:
Maximum Temperature 25.9°C
Minimum Temperature -4.9°C
Average Daily High Temperature 16.0°C (Long term average 13.5°C)
Average Daily Low Temperature 5.6°C (Long term average 2.9°C)
Total Precipitation 60.4 mm (Long term average 67.4 mm)
**Note: The first version of this summary mistakenly stated that October 2016 was the warmest in 45 years when in fact it was the second warmest.
(Long term averages based on 1981-2010 data for the Waterloo Wellington Airport)
Sunday, October 2, 2016
September 2016 Summary
A very hot September and back to the dry
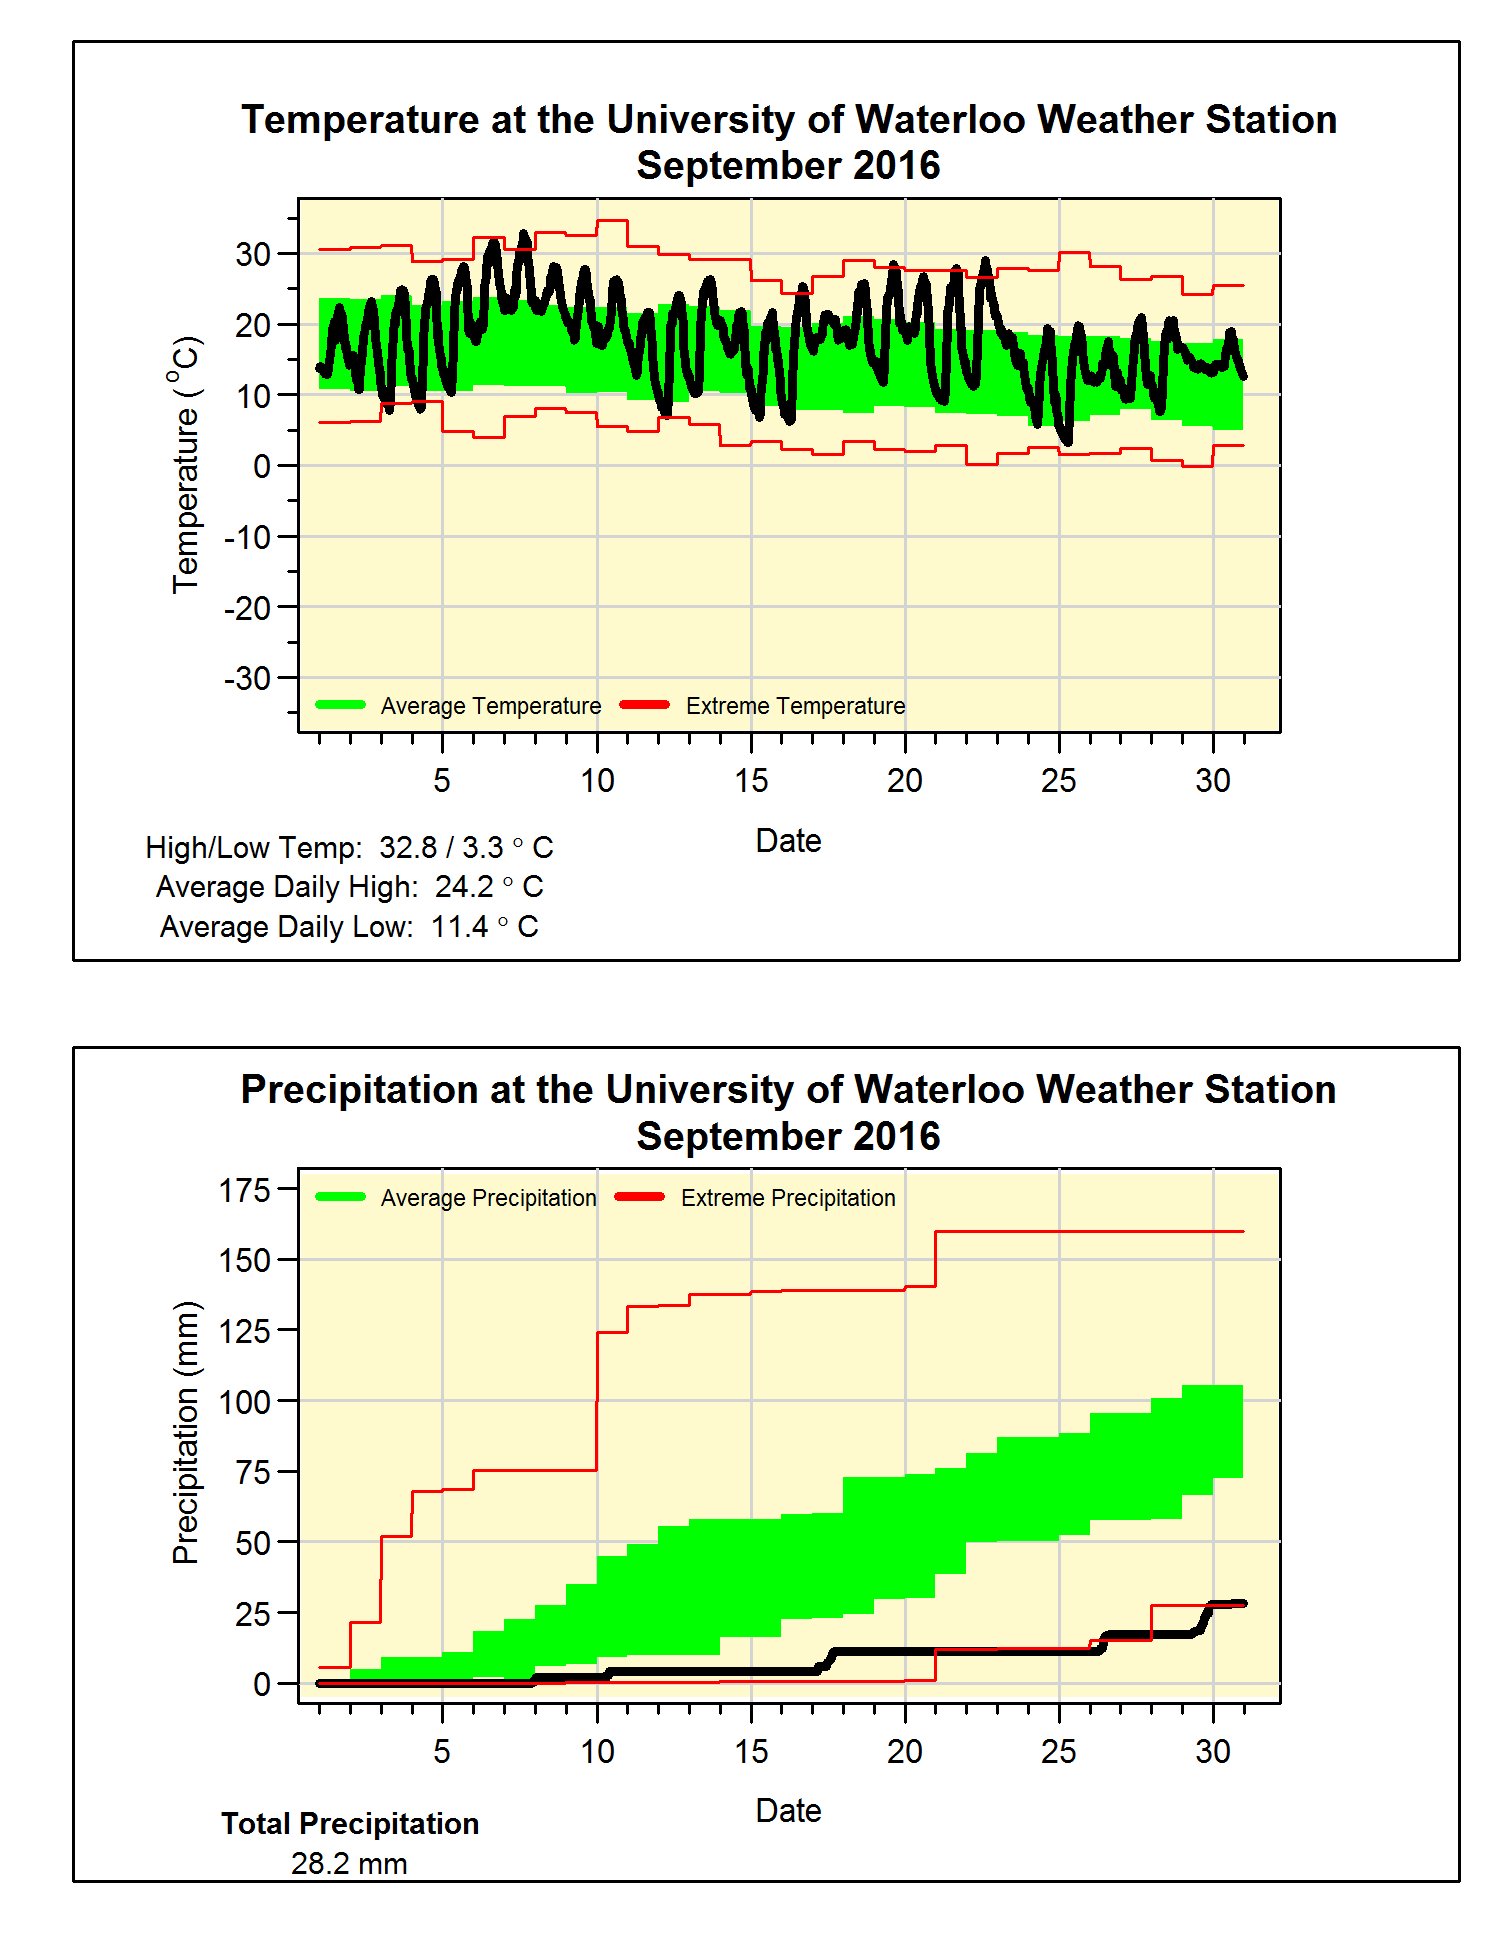
Just like August, September was 3.3 degrees above average and just like the previous month it was also the 5th hottest in the 100 years of records in the region. But whereas last time we had to go back to 1959 to find a hotter month this time we only have to go back to last year when September was over 4 degrees above average.
This year there were a couple of days over 30 early in the month and there was another warm streak in the middle. For the last week the temperature really dropped and although it might have seemed a lot colder it actually just went down to the average.
We might have to soon start using the D word again as this month only saw 28.2 mm of precipitation, this is less than a third of the average of 87.8 mm. The annual precipitation total has been jumping around the average all year and with this dry month we have gone under again (669.0 mm this year – 685.2 mm average).
Summary for September 2016:
Maximum Temperature 32.8°C
Minimum Temperature 3.3°C
Average Daily High Temperature 24.2°C (Long term average 20.4°C)
Average Daily Low Temperature 11.4°C (Long term average 8.6°C)
Total Precipitation 28.2 mm (Long term average 87.8 mm)
Just like August, September was 3.3 degrees above average and just like the previous month it was also the 5th hottest in the 100 years of records in the region. But whereas last time we had to go back to 1959 to find a hotter month this time we only have to go back to last year when September was over 4 degrees above average.
This year there were a couple of days over 30 early in the month and there was another warm streak in the middle. For the last week the temperature really dropped and although it might have seemed a lot colder it actually just went down to the average.
We might have to soon start using the D word again as this month only saw 28.2 mm of precipitation, this is less than a third of the average of 87.8 mm. The annual precipitation total has been jumping around the average all year and with this dry month we have gone under again (669.0 mm this year – 685.2 mm average).
Summary for September 2016:
Maximum Temperature 32.8°C
Minimum Temperature 3.3°C
Average Daily High Temperature 24.2°C (Long term average 20.4°C)
Average Daily Low Temperature 11.4°C (Long term average 8.6°C)
Total Precipitation 28.2 mm (Long term average 87.8 mm)
(Long term averages based on 1981-2010 data for the Waterloo Wellington Airport)
Sunday, September 4, 2016
August 2016 Summary
The hottest August in 55 years and the wettest in 30
The month of August was the hottest we have seen since 1959 and the 5th hottest in the 100 years of records in the region. There was only 1 day that was colder than average and that was only by a less than a degree. The overall temperature was over 3 degrees above average, the most above average month this year.
Drought? What drought? After 3 really dry months in a row, this August was the wettest once since 1985 with 155.6 mm of precipitation. This was almost as much as we had in the previous 3 months combined (167.6 mm). It also puts it at the 7th wettest August in the region.
Generally we don’t see weather that is overall warm and wet at the same time, looking at a graph of temperature versus precipitation anomaly (see below), you can see that 2016 is out on its own towards the upper right of the graph. Note that the crazy total for 1915 was caused by a recorded daily precipitation of 175.3 mm on the 4th which is more than 100 mm more than any other station recorded that day in the area. So I see that data point as suspect, but even if you take 100 mm of the total is was still by far the wettest August we have seen in the region.
Given the wet month it is not surprising that the total for the year of 640.8 mm has gone above the average of 596.0 mm for the end of August.

Summary for August 2016:
Maximum Temperature 33.6°C
Minimum Temperature 10.5°C
Average Daily High Temperature 28.4°C (Long term average 24.8°C)
Average Daily Low Temperature 16.0°C (Long term average 12.9°C)
Total Precipitation 155.6 mm (Long term average 83.9 mm)
(Long term averages based on 1981-2010 data for the Waterloo Wellington Airport)

Thursday, August 4, 2016
July 2016 Summary
Another hot and dry month
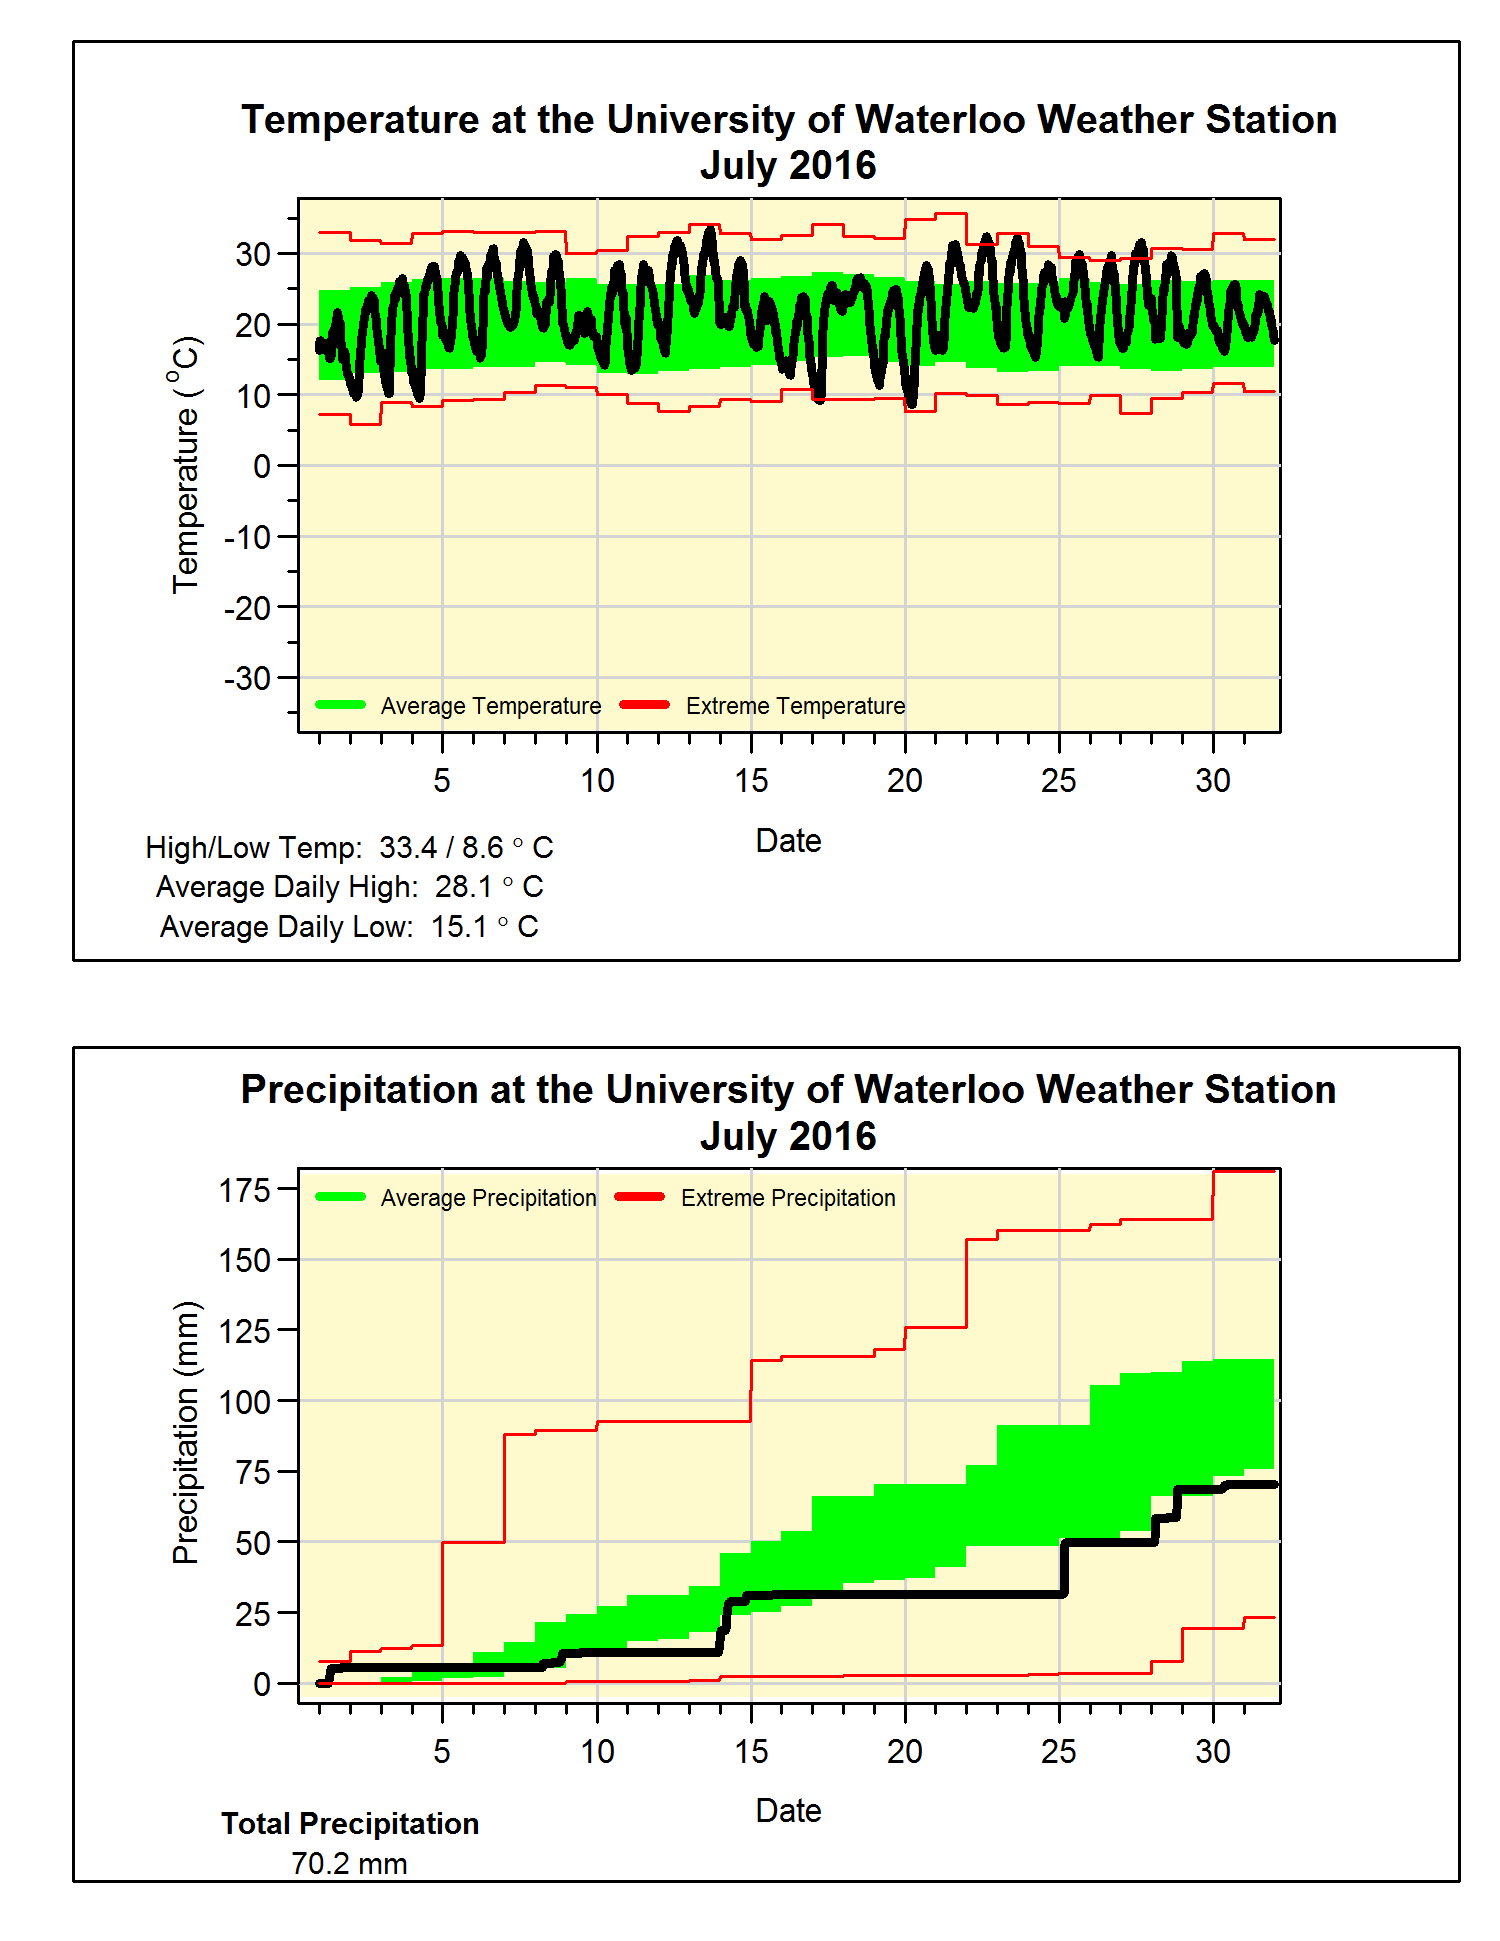
At over one and half
degrees above average, it was definitely a hot month.
With not much else
so say about the heat this month let’s have a couple of fun facts for the summer
so far:
The last time the
daily high temperature was more than 5 degrees below average was back on June
13th. So far we have seen 22 days above 30 degrees, on average we
only see 8 of them during a typical year, but we still have a long way to go to
beat the record of 49 back in 1955.
For the third month in a row the precipitation was below
average. Although it might have been
much worse as it was only in the last week of the month that we saw almost 40
mm of the 70 mm precipitation for July.
But as was typical of the type of storms we have seen this summer, most
of the rain fell in short bursts lasting less than an hour, and this means a
lot of it probably ran off without having time to soak into the ground.
The total precipitation for the year (485.0 mm) has now
started to drop below the average for this time of the year (509.0 mm).
Summary for July 2016:
Maximum Temperature 33.4°C
Minimum Temperature 8.6°C
Average Daily High Temperature 28.1°C (Long term average
26.0°C)
Average Daily Low Temperature 15.1°C (Long term average 14.0°C)
Total Precipitation 70.2 mm (Long term average 98.6 mm)
(Long term averages based on 1981-2010 data for the Waterloo Wellington Airport)
Subscribe to:
Posts (Atom)


 Posts

